Retailer Performance
V. Kumar
UNIVERSITY OFHOUSTON
Kiran Karande
OLDDOMINIONUNIVERSITYRetail stores are segmented using socioeconomic characteristics of the environmental variables both within and outside the store. trade area, and it is shown that the effects of store environment on store The internal retail environmental variables include retailers’ performance vary across segments. Store performance is measured by a micro-marketing strategies and the external retail environment market-based measure—sales and a productivity-based measure—sales that pertains to the neighborhood location and trade area per square feet. The internal store environment includes the number of demographics. The effect of the influence of retail environment checkout counters per square foot of selling area, the number of nongrocery on retail performance is studied using data for 646 grocery products sold (extent of scrambled merchandising), whether the store at stores across the United States. A.C. Nielsen provided this least doubles manufacturers coupons, whether there is a banking facility, Market Metrics data. We add to the past literature on retail and whether the store is open for 24 hours. The external store environment atmospherics and retail performance (see Ghosh and McLaf-includes the type of neighborhood it is located in. A methodology for ferty [1987]; Wrigley [1990]; and Rogers [1992] for excellent predicting store performance (for existing and new stores) based on the reviews) by showing how such information can be used by type of environment and store location by using aggregate secondary data retailers to improve store performance.
is demonstrated. The proposed models are estimated and validated using Past research has shown that store performance1is
influ-Market Metrics geodemographic data for 646 grocery stores provided by enced by variables such as trade area demographics including A.C. Nielsen. It is shown how the findings of this retail environment study population and socioeconomic characteristics (Craig, Ghosh, can be used to offer guidelines to retailers for attaining desired levels of and McLafferty, 1984), level of competition (Ghosh, 1984), sales and sales per square feet by using readily available data. J BUSN RES retail atmospherics including location on intersection, sales
2000. 49. 167–181. 2000 Elsevier Science Inc. All rights reserved. area, credit card service, number of checkout counters, num-ber of aisles (Jain and Mahajan, 1979), and promotions (Wal-ters and Rinne, 1986; Wal(Wal-ters and MacKenzie, 1988). In recent years, the grocery store industry has become increasingly
com-R
etailing atmospherics have been used to create differ- petitive, and therefore additional variables, particularly those ences across stores in order to exploit consumer char- related to the effects of actions taken by the retailer, need acteristics and the competitive environment (Kotler, to be studied. For example, retailers are looking at ways to 1973; Hoch, Byung-Do, Montgomery, and Rossi, 1995). In differentiate themselves from competition by increasing the the past, marketers’ ability to test the variations in retail atmo- level of service at checkout and adding services, such as keep-spherics was constrained because of nonavailability of data ing the store open for 24 hours. They are using promotions covering a wide range of variables across a cross-section of such as double or triple couponing, selling a variety nongro-retailers. However, with the advent of technology, marketers cery products (scrambled merchandising), and locating stores now have access to such data on a wide range of variables in smaller markets with an intent to improve store perfor-(for example, the Market Metrics data in the United States). mance. To the best of our knowledge, no past study2 hasIn this study, we use a broad definition of retail atmospherics, which represents the retail environment. We use a unique
data set covering a wide range of variables related to retail 1Performance is measured as dollar sales, sales per square foot, market
share, retail patronage, store choice, store traffic, and store profits in different studies.
2Other studies (Walter and Rinne, 1986; Walters and MacKenzie, 1988) Address correspondence to V. Kumar, Marvin Hurley Professor of Business
have explained performance by using promotional variables, such as double Administration, Melcher Faculty Scholar and Director of Marketing Research
Studies, University of Houston, Houston, TX 77204-6283. couponing, but have not addressed the range of store environment variables.
Journal of Business Research 49, 167–181 (2000)
2000 Elsevier Science Inc. All rights reserved. ISSN 0148-2963/00/$–see front matter
researched the effect of internal retail environment including the socioeconomic characteristics of the trade area influence the effect of a store’s internal and external environment on level of service, double couponing, extended store hours, the
extent of scrambled merchandising, and external retail envi- sales and sales per square foot. These insights should enable managers to plan for desired levels of performance by using ronment, such as store neighborhood characteristics on
gro-cery store performance. readily available secondary data.
To summarize, this study contributes to the literature in An interesting question to address is whether the effect of
retail environment on retail store performance is similar across several ways. This study focuses on empirically demonstrating the effect of a store’s internal and external environment on all neighborhoods. Past research has studied the effects of
different variables on store performance without attempting store performance. It is, also, one of the first studies to empiri-cally show that using the same retail environment strategies to segment stores to assess the differential impact of variables
across stores. Researchers studying store choice have acknowl- across all stores might not be an appropriate strategy. Strate-gies should, in fact, depend upon the socioeconomic charac-edged (Ghosh, 1984) and shown the effect of factors, such as
income, occupation, and ethnicity on the relative importance teristics of the trade area. Most studies in the past have focused on forecasting market-based performance measures, such as given to variables by shoppers (Craig, Ghosh, and McLafferty,
1984). However, such modeling requires the collection of sales (Ingene and Lusch, 1980; Kumar and Leone, 1988) or market share (Durvasula, Sharma, and Andrews, 1992). Here, primary data. Our study deals with store level secondary data
that is cross-sectional in nature. As a result, segmenting stores in a single study, we address two dimensions of perfor-mance—market-based and productivity-based performance. by using this data offers useful insights into the determinants
of grocery store performance. In other words, our study integrates a broad spectrum of variables in modeling the effect of store atmospherics on store We add to the knowledge generated by past research by
integrating a wide range of variables to model grocery store performance.
In this study, we show that socioeconomic characteristics performance. Specifically, we develop two models explaining
the effect of a store’s internal and external environment on of the trade area moderate the effect of retail atmospherics on store performance. We demonstrate a methodology for the variation in (1) a market-based measure of performance3—
sales, and (2) a productivity-based measure of performance— predicting store performance (for existing and new stores) based on the internal and external environment of grocery sales per square foot. Furthermore, we segment the stores on
the basis of their socioeconomic characteristics and empirically stores by using aggregate secondary data. Specifically, the findings are used to offer guidelines to retailers for attaining demonstrate the differential impact of a store’s internal and
external environment on store performance across segments. desired levels of sales and sales per square foot by using readily available data.
The proposed models4 are estimated and the consistency of
results assessed using the Market Metrics data. This research is organized as follows: first, past research is reviewed in light of the current study. Hypotheses are pre-Our findings should provide useful insights into issues that
retailers regularly encounter within a store, such as the impact sented next. Then, data, methodology, and results are dis-cussed. Implications of the results to grocery store managers of the number of checkout counters, the kind of merchandise
sold, double couponing, keeping the store open for 24 hours, are drawn. Finally, limitations of this study and suggestions for future research are discussed.
and neighborhood characteristics on sales and sales per square foot. In addition, it should help them understand whether
Literature Review and Hypotheses
3Store performance can be assessed using three different measures (Dunn,
We position this research in two ways. First, we discuss the Lusch, and Gable, 1995): market-based performance measures, such as sales
or market share; productivity-based performance measures, such as sales literature on why retail atmospherics is critical for a store’s per square foot or sales per employee; and profitability-based performance
performance. Next, we discuss our study in the light of past measures, such as gross margin or return on assets. It is useful to study
research on measuring store performance and then other rele-all types of store performance measures because these measures of store
performance are mutually exclusive. For example, stores with high dollar vant studies. In doing so, we provide a brief review of the sales might not ensure a high productivity-based performance (e.g., sales per literature on methods used for assessing/forecasting sales per-square foot) or a high profitability based performance (e.g., gross margin).
formance in retail outlets. This is important since our frame-In this research, since profit margins are not available across retailers, we
restrict our analysis to only market and productivity-based measures of perfor- work also enables retailers to generate an estimate of
perfor-mance. mance measures.
4It is important to state why we use different models for explaining
weekly dollar sales and sales per square foot because it can be argued that
the weekly sales can be predicted knowing the sales per square foot and the
Retail Atmospherics
square footage of the store. There are two reasons for specifying separateAtmospherics are often designed to create a buying environ-models. First, sales and sales per square foot are conceptually different
depen-dent variables. One is a market-based measure of performance and the other ment that produces specific emotional effects that will enhance is a productivity-based measure of performance. Second, even if we could
a consumer’s likelihood of purchase. Both the functional attri-predict sales by estimating only the sales per square foot model, the effect
Table 1. A Brief Review of Literature on Retail Performance
Performance Level of Data
Method Measure Explanatory Variables Collection Comments
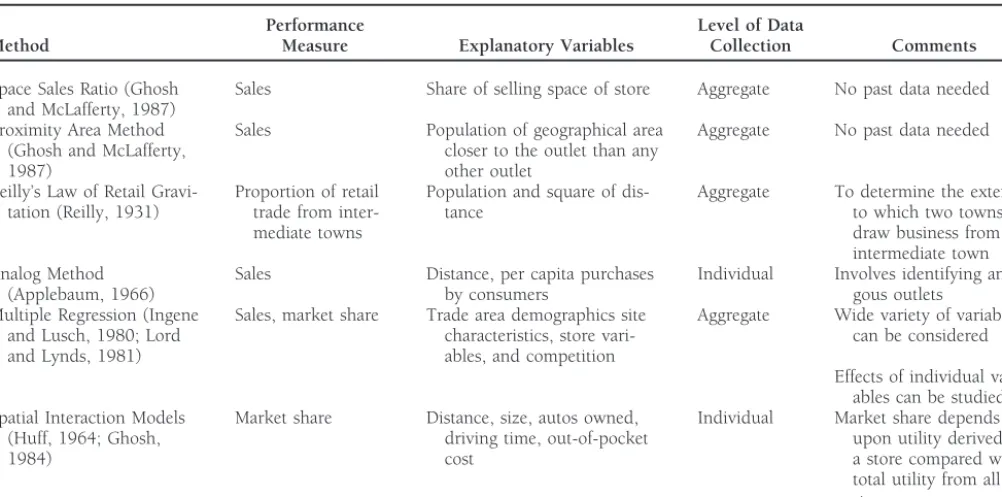
Space Sales Ratio (Ghosh Sales Share of selling space of store Aggregate No past data needed and McLafferty, 1987)
Proximity Area Method Sales Population of geographical area Aggregate No past data needed (Ghosh and McLafferty, closer to the outlet than any
1987) other outlet
Reilly’s Law of Retail Gravi- Proportion of retail Population and square of dis- Aggregate To determine the extent tation (Reilly, 1931) trade from inter- tance to which two towns
mediate towns draw business from an
intermediate town Analog Method Sales Distance, per capita purchases Individual Involves identifying
analo-(Applebaum, 1966) by consumers gous outlets
Multiple Regression (Ingene Sales, market share Trade area demographics site Aggregate Wide variety of variables and Lusch, 1980; Lord characteristics, store vari- can be considered and Lynds, 1981) ables, and competition
Effects of individual vari-ables can be studied Spatial Interaction Models Market share Distance, size, autos owned, Individual Market share depends
(Huff, 1964; Ghosh, driving time, out-of-pocket upon utility derived by
1984) cost a store compared with
total utility from all stores
attributes (e.g., pleasantness) that a consumer elicits in his/ created three different types of stores—K-Mart, Big K, and her mind determine a store’s personality. Darden and Babin Super K. Similarly, Kroger has developed a new concept called (1994) indicated that the emotional and functional aspects the Signature store (in addition to the regular store). The are strongly correlated with each other. Therefore, this study differences across these types of stores being the assortment focuses on the retailing personality as measured by the func- of merchandise sold as well as various services including in-tional aspects of a store’s environment. In fact, Titus and store bakery, banking facilities, open for 24 hours, etc. More Everett (1995) argued that the design of the shopping environ- quality services are offered in larger stores, which are located in ment is an important element in the consumer retail search many neighborhoods. In other words, the store’s environment
process. should be attractive enough (in case of grocery stores, it could
According to Ward, Bitner, and Barnes (1992), be the advertising of the availability of banking services, travel agency, restaurant, open for 24 hours, offering of double or The physical environment that a retail store presents to
triple couponing, etc.) for a consumer to enter. In order to potential customers can be divided into two parts: the
complete a sale, the other environmental variables, such as external environment, that part of the store visible prior
assortment of merchandise and in-store bakery, should be to entry into the retail sales or service area (parking lot,
acceptable to the consumer. Thus, retail atmospherics play a fac¸ade, entrance, etc.), and the internal environment, that
critical role in consumer shopping behavior. part visible from the retail selling space. Although no
re-search that we know of addresses the issue, it is reasonable
to suppose that the relative importance of the external
Store Performance
versus the internal environment in determining a store’s An aggregate measure of the effect of consumer shopping categorization may differ across retailers. behavior is store performance. Ghosh and McLafferty (1987),
Wrigley (1990), and Rogers (1992) provide excellent reviews Darley and Gilbert (1985) and Holahan (1986) suggested
on forecasting retail performance. Table 1 summarizes the that the built environment has many significant influences on
literature on forecasting retail performance along four dimen-human psychology and behavior.
sions—the method used, the type of performance measure Donovan and Rossiter (1982) and Gardner and Siomkos
used (sales, market share), the type of explanatory variables (1986) have suggested the importance of physical
environ-used (for example, managerial judgements, distance, etc.), and ment in retailing. Based on the literature on typicality and
type of data collection required (individual level vs. aggregate). attitude (Loken and Ward, 1990), it is proposed that a
con-Our study uses linear models and requires aggregate level sumer’s attitude be positively related to the internal and
research by proposing a method for forecasting weekly dollar estimates. He proposed that parameter nonstationarity arises due to two factors—the socioeconomic characteristics of the sales (a measure of market-based performance) and sales per
shopper and the spatial characteristics of the alternative con-square foot (a measure of productivity-based performance).
sidered (competition) by the individuals. His study tested While earlier research has predominantly explained
market-nonstationarity of parameters in a “gravity” model due to based performance (sales, market share) by using variables
spatial characteristics of competition. Like Ghosh (1984), we including distance, size of the store, and trade area
demo-propose that the effects of environmental variables vary de-graphics, this study focuses on the effect of a store’s internal
pending on socioeconomic characteristics of the trade area. and external environment on sales and sales per square foot.
While Ghosh’s (Ghosh, 1984) study focused on testing of In addition, the moderating effects of the socioeconomic
char-nonstationarity, our study focuses on explaining store perfor-acteristics of the trade area also are demonstrated.
mance. Also, while his study was done at the individual level Other related research on retail store choice has dealt with
(involving primary data collection), our study uses aggregate helping managers select neighborhoods under different
cir-secondary data (which is readily available). cumstances. These studies include selecting store locations by
Cottrell’s (Cottrell, 1973) and Davies’s (Davies, 1973) stud-using managerial judgement (Durvasula, Sharma, and
An-ies also addressed store performance. However, they were drews, 1992), under a changing environment (Ghosh and
carried out at a time when geodemographic data were difficult McLafferty, 1982), selecting multiple store locations (Achabal,
to obtain. Therefore, they are not discussed in detail. Thus, Gorr, and Mahajan, 1982), and a portfolio of stores (Mahajan,
the present study builds up on these past studies and attempts Sharma, and Srinivas, 1985). Like forecasting performance
to provide an integrated view for the retailer to improve their studies, these studies primarily focus on achieving desirable
performance based on the store’s internal and external envi-levels of sales or market share by using external environment
ronment. characteristics.
It is also important to compare this study with other
rele-Hypotheses
vant studies. Walters and Mackenzie (1988) and Walters and
Rinne (1986) developed hypotheses on the effects of loss The focus of this study is on offering guidelines to retailers leaders, in-store price specials, and double coupon promo- for determining the appropriate retail environment to attain tions on overall store sales, profits, and traffic. Thus, in addi- desired levels of store performance. The internal environment tion to market-based factors (sales and traffic), they also ex- we study to explain store performance includes convenience plained profitability based performance (profits). Their study (number of checkout counters per square foot of area), scram-primarily focused on studying the impact of promotional poli- bled merchandising (number of nongrocery items sold), cies on store performance. Like Walters and Mackenzie’s (Wal- whether a store at least doubles manufacturers’ coupons, whether a store has banking facilities, and whether a store is ters and Mackenzie, 1988) and Walters and Rinne’s (Walters
open 24 hours. The total number of households in the area and Rinne, 1986) study, the dependent measure of interest
and the geographical region where a store is located operation-is store performance. However, our study differs from theirs
alizes a store’s external environment. The socioeconomic char-in scope. While they considered only promotional policies,
acteristics of the trade area (part of the external environment) we include a number of a store’s internal and external
environ-studied include the percentage of households with annual ment variables, including promotional policy variables, such
income greater than $30,000, the percentage of households as double couponing. Also, we explain market-based
perfor-with a family size of four or more, and the percentage of mance (dollar sales) and productivity-based performance
households owning their homes5. Hypotheses on the effect of
(sales per square foot).
the internal and external environmental variables are derived Hoch et al.’s (Hoch, Byung-Do, Montgomery, and Rossi,
based on the theory of the allocation of time between different 1995) study used geodemographic data to predict store level
activities (Becker, 1965). Hoch, Byung-Do, Montgomery, and price elasticities. Their study, too, was conducted with
promo-Rossi (1995) and Blattberg, Buesing, Peacock, and Sen (1978) tional policy as the focus (the sales impact of a reduction in
in the context of sales promotion have used this theory. While price due to retail price promotion). They use Becker’s (Becker,
Hoch, Byung-Do, Montgomery, and Rossi (1995) applied the 1965) theory of allocation of time to develop the hypotheses,
theory for predicting store level price elasticity by using trade which also forms the theoretical basis for our hypotheses. Our
area demographics, Blattberg, Buesing, Peacock, and Sen study differs from Hoch et al.’s (Hoch, Byung-Do,
Montgom-(1978) applied the theory to determine the demographic char-ery, and Rossi, 1995) study in focus. They focused on
promo-acteristics of deal prone consumers. tional policy, and their analysis was done at the product
Becker’s (Becker, 1965) theory postulated that shopping category level. We include a wide range of environmental
activity is a part of the overall household production process. variables, and our analysis is done at the store level.
Further-more, in addition to explaining dollar sales, we also explain
sales per square foot. 5Some of the operationalizations of the variables are constrained by the
Households determine their returns from shopping (how Literature on multipurpose shopping indicates that ag-glomeration of diverse retailers in shopping centers increases much and what they buy) by analyzing total costs of shopping.
the attractiveness of those places for consumer shopping In addition to the cost of goods, the total costs of shopping
(Craig, Ghosh, and McLafferty, 1984). Agglomeration is ad-for a household include inventory, transportation,
opportu-vantageous because it facilitates multipurpose travel by con-nity, and search costs. For example, the costs of shopping for
sumers and allows them to benefit from economies of scale. the same basket of goods at the same store for households
When shopping at grocery stores, the availability of diverse living near the grocery store are lower than those for
house-merchandise increases the attractiveness of stores because holds living farther from the store. Similarly, the costs of
shoppers can do one-stop shopping instead of shopping at shopping for households whose incomes are high are more
two or more different stores. In the context of the theory of than that for households with relatively low incomes due to
allocation of time, the total cost of shopping reduces due to higher opportunity costs of time. Furthermore, the theory
the availability of diverse merchandise. In addition to buying postulates that households tend to substitute the cost of time
more of the goods they would have bought at the same store, with goods and vice versa. For example, high-income
house-consumers buy other merchandise that they would have holds might be more interested in buying expensive
conve-bought at other stores, resulting in higher store sales. nience goods thereby trading off the costs of the product
Stores selling nongrocery products are said to use scram-against the costs of time. Using Becker’s (Becker, 1965) theory,
bled merchandising. Such products include automotive sup-we propose two sets of hypotheses: (1) the effect of retail
plies, film developing, sporting goods, and video renting. environment on sales, and (2) the effect of retail environment
The number of nongrocery products and services sold by the on sales per square foot.
retailer operationalizes the extent of scrambled merchandising. In the development of hypotheses, the discussion
sur-We hypothesize that, rounding the hypotheses related to the effects of individual
variables on sales and sales per square foot is similar. However, H1b: Sales of a grocery store are positively related to the we are interested in empirically exploring the differential ef- extent of scrambled merchandising by the grocery fects (in terms of magnitude as well as direction) of the internal store.
and external environment variables. Therefore, hypotheses
Boston College conducted a research and found that in the related to both sales and sales per square foot are developed
Chicago area, the number one reason why consumers shop and stated simultaneously.
a store is for assortment and selection (Liebeck, 1994). How-THE EFFECT OF A STORE’S INTERNAL ENVIRONMENT ON SALES ever, Hutchinson (1993) opined that consumers limit their AND SALES PER SQUARE FOOT. The total time spent in grocery shopping on a given trip for two basic reasons. First, there are shopping can increase considerably because of long waits due costs to shopping that offset the potential benefits of finding a to insufficient checkout counters (relative to the size of the higher quality item or a lower price. Each consumer may have store). If the number of checkout counters relative to the size no more than two or three options (i.e., stores) in his/her of the store (convenience) is high then the waiting time is consideration set (Hauser and Wernerfelt, 1990). Since con-likely to be lower. Consequently, the opportunity cost to sumers want to buy high quality products at a lower price, shoppers due to waiting will be lower. Shoppers can partially it is not necessary that they would shop in one store, even substitute this cost saving by shopping for other goods, though it offers a larger assortment of merchandise. Given thereby increasing store sales. Also, the more convenience- that stores are located close to one another, shopping costs can be lower resulting in increase in the number of stores oriented consumers who shop at other stores could switch
shopped by consumers. stores (Kumar and Leone, 1988) due to greater convenience.
Therefore, it is possible that as retailers expand their store In a study of supermarket stores, Cottrell (1973) found
size by offering more assortments, the increase in sales per that sales per square foot were higher for stores with higher
square foot need not be increasing in the same proportion. number of checkout counters per square foot of store area.
In other words, Also, Ingene (1984) used waiting time at checkout to measure
service quantity and showed that it influenced market
poten-H2b: Sales per square foot of a grocery store are negatively tial for a store. Based on Becker’s (Becker, 1965) theory and related to the extent of scrambled merchandising by past literature, we hypothesize that, the grocery store.
H1a: Sales of a grocery store are positively related to the Couponing, in general, and double or triple couponing, in number of checkout counters per square foot of sell- particular, appeal to a sizeable market segment and may attract
ing area. not only coupon users among the store’s regular clientele
lating store traffic and increasing sales for products for which cally dispersed areas or in densely populated areas. In either case, the total cost of shopping at outlets located in such areas valid coupons are in circulation. Doubling the value of
manu-facturers’ coupons redeemed in a store increases the value of is high for a household. For households in a geographically dispersed area, the distance traveled to the store will be higher, the coupon by substantially decreasing the price the consumer
must pay for the product. which will influence both transportation and opportunity cost of time spent in traveling. For households in densely popu-In the context of our theory, cost of shopping reduces
because of double couponing, and households can substitute lated areas, the total cost of shopping is relatively high because of higher opportunity costs of time spent due to additional this cost saving by buying additional items, thereby increasing
store sales. Therefore, we hypothesize that, waiting and crowding in grocery stores.
Households therefore will try to compensate higher costs
H1c: Sales of a grocery store are positively related to
of shopping by spreading the opportunity and transportation whether the store doubles the value of manufacturer
costs over a larger bundle of goods. In other words, stores in coupons.
such areas will tend to attract more primary shoppers (who
H2c: Sales per square foot of a grocery store are positively buy a range of grocery products) than secondary shoppers related to whether the store doubles the value of filling in a need resulting from out-of-stock conditions at manufacturer coupons. home (Hoch et al., 1995). Hence, the stores’ policy of locating in an area with a high number of households should result Some retailers provide 24-hour service and others provide
in greater sales. Using an alternative argument, we see that service for limited hours. With the changing pace of society,
with a higher number of households, there is greater market many consumers might find it more convenient to shop at
potential. Stores in areas with greater market potential are night or after the regular working hours of the grocery store
likely to have more sales than stores located in low potential because their opportunity cost of time is lower at that time.
areas6. Therefore, we hypothesize that,
Also, many consumers who prefer to shop at such times (due
to lower costs) might shift from stores that are not open 24 H1f: Sales of a grocery store are positively related to the hours. Shoppers partially substitute this reduced opportunity total number of households in the trade area. cost with more goods, thereby increasing store sales. There- H2f: Sales per square foot of a grocery store are positively fore, we hypothesize that, related to the total number of households in the trade
area.
H1d: Sales of a grocery store are positively related to whether the grocery store is open 24 hours.
Different markets have different characteristics. For
exam-H2d: Sales per square foot of a grocery store are positively ple, in the United States, the population density is higher in related to whether the grocery store is open 24 hours. the Northeast than in the South. Therefore, stores in the Northeast should have higher sales per store. Also, the envi-Recently, banks have started opening branches in many
ronment in different regions is different. For example, stores locations to increase their market share. One of the popular
in the South sell alcoholic beverages, but those in the Northeast places where banks are being located is within grocery stores.
do not. These differences should influence the sales in grocery The banking service is being offered as a convenience for
stores. Because of the multiplicity of unknown differences customers. While the banks believe that there is some benefit
across geographical regions, it is difficult to hypothesize the to them through multiple outlets, it is not clear how the
direction. Therefore, we hypothesize that, grocery industry is going to be benefited. The speculation is
that if a store can draw more customers into their store because H1g: Sales of a grocery store vary across geographical re-of banking facilities then the store has something to gain. On gions in which they are located.
the contrary, it is not known whether the additional space H2g: Sales per square foot of a grocery store vary across allocated for banking is useful for stores with respect to sales geographical region in which they are located. per square foot. The assumption is that the presence of
bank-ing facilities should enhance both the store sales and sales per
square foot.
Methodology
H1e: Sales of a grocery store are positively related to the
Data
presence of a bank in the grocery store. A.C. Nielsen provided the Market Metrics data at the store level. It covers five different regions of the United States
H2e: Sales per square foot of a grocery store are positively
(Northwest, Midwest, Southeast, Northeast, and Southwest), related to the presence of a bank in the grocery store.
and varying types of stores (supermarkets, superstores, etc.). THE EFFECT OF A STORE’S EXTERNAL ENVIRONMENT ON SALES
AND SALES PER SQUARE FOOT. Outlets located in areas with
Data for the 646 stores7 in this study can be classified into SALES
j5 a01 a1* CONVEj1 a2* SCRAMBj
1 a3* DCj1 a4* O24j1 a10* Bankj
three categories:
1 a5* THHj1 a6*NEASTj1 a7*MWESTj
1. Store description: includes data such as average weekly
1 a8* NWESTj1 a9* SWESTj1ej (1)
sales (in dollars), total selling area, and number of
checkout counters for each store. PRODUCTIVITYj5b01 b1* CONVEj1b2* SCRAMBj
2. Store’s internal environment: includes the types of prod- 1b3*DCj1 b4*O24j1b10* Bankj
ucts sold in each store. For example, pharmacy prepared 1b5*THHj1b6*NEASTj
food, etc. (there are 28 different kinds of products in- 1b7*MWESTj1 b8*NWESTj
cluded). Also, whether the store is open 24 hours, pro- 1b9*SWESTj1 dj (2)
vides banking facilities, offers double couponing, etc.
Where, j 5grocery store (j 51 to 460). SALES 5 weekly 3. Store’s external environment: includes the total number
dollar sales for grocery store. PRODUCTIVITY 5 sales per of households in the trading area and the region where
square foot for the grocery store. CONVE 5 number of the store is located, as well as the number of people
checkout counters per 10,000 square foot of selling area. in different age groups, income groups, family sizes,
SCRAMB 5 number of nongrocery products sold (ranging occupation, and number of people renting or owning
from 0 to 28). DC51 if store doubles or triples manufacturers’ their residence.
coupons (0 otherwise). O24 51 if store is open 24 hours (0 otherwise). Bank 5 1, if banking facility is available. Market Metrics define trading area for all stores by using
THH 5 total number of households in the trade area (in proprietary models that take into account population density
thousands). NEAST51 if store is located in the Northeast (urban vs. suburban), competition, road conditions, and
vari-(0 otherwise). MWEST51 if store is located in the Midwest ous regional differences. Furthermore, they define a trading
(0 otherwise). NWEST51 if store is located in the North-area by expanding a polygon around each store location to
west (0 otherwise). SWEST 5 1 if store is located in the enclose an area large enough to support the all commodity
Southwest (0 otherwise).a0-a95parameter estimates for the
volume (ACV) of the store (Hoch, Byung-Do, Montgomery,
SALES model.b0-b95parameter estimates for the
PRODUC-and Rossi, 1995).
TIVITY model.ej 5 error term for the SALES model. dj 5
After removing the data on stores with extreme values
error term for the PRODUCTIVITY model. (outliers), the data were divided into an estimation sample of
We checked for heteroscedasticity and multicollinearity. 460 stores and a holdout sample of 160 stores. The holdout
There were no serious problems of heteroscedasticity as evi-sample would be used for checking the consistency of the
denced by a plot of the error terms with the predicted values. parameter estimates. This division was done using stratified
Also, there was very little multicollinearity as evidenced by random sampling with the stratification based on the region.
the correlations between the independent variables as well as In other words, we segregated the data into five groups for
the condition index (which is below the condition index of the five regions. Then, from each group we randomly selected
30 for moderate levels of multicollinearity as suggested by approximately three-fourths of the sample for estimation and
Kleinbaum, Kupper, and Muller, 1988). one-fourth for holdout. Finally, we stacked the data for all
the stores in the estimation sample for the five regions to
perform the analysis. Similar stacking was done for the holdout
Results
sample. The random selection of stores for the estimationThe Effect of Retail Environment on Sales
sample was done using the RANUNI procedure in SAS.
(the SALES Model)
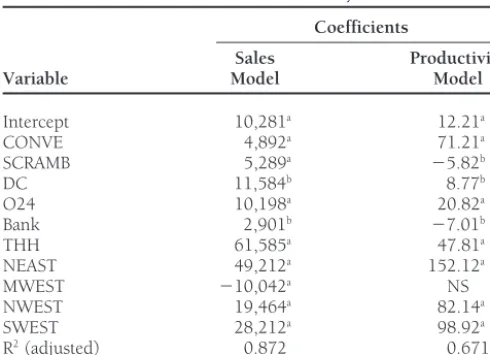
The SALES model results are summarized in Table 2. Results
Model
indicate that the retail environment variables significantly ex-We specify the two models—the SALES model for explaining plain the variation in store sales across grocery stores (Model the effect of retail environment on sales and the PRODUCTIV- F5429,p50.0001). Also, 87.2% of the variation in store ITY model for explaining the effect of retail environment on sales is explained by store policies and store location (Adjusted sales per square foot. We tested different model forms (linear, R250. 872). Past studies attempting to predict store
perfor-exponential, and multiplicative) and found that the linear mance also have found similar R2(Ingene and Lusch, 1980;
form offered the best fit8. The SALES and the PRODUCTIVITY
Ghosh, 1984).
models can be specified by equations 1 and 2: The effect of number of checkout counters per square foot of store area (convenience) is positive and significant. Therefore, hypothesis H2a is supported. Sales are positively 7Note that the data is cross-sectional and there is only one observation related to the extent of scrambled merchandising (a
255289,
per store. p50.0001). The more nongrocery products a store sells, the
8The error sums of squares in predicting the original form of the
Table 2. Results of the Sales and Productivity Model square foot across supermarkets (Model F 5 112.2, p 5 0.0001). Also, the retail environment explains 67.12% of the Coefficients
variation in weekly sales per square foot.
Sales Productivity
Sales per square foot are positively related (b1 5 71.21,
Variable Model Model
p50.0001) to the number of checkout counters per square foot of store area (convenience). In other words, the more
Intercept 10,281a 12.21a
CONVE 4,892a 71.21a
convenience a grocery store offers, higher is their sales per
SCRAMB 5,289a 25.82b
square foot. Therefore, hypothesis H2a is supported. Sales per
DC 11,584b 8.77b
square foot are negatively related to the extent of scrambled
O24 10,198a 20.82a
merchandising by a store (b2 5 25.82, p5 0.0001). This
Bank 2,901b 27.01b
result is as hypothesized and offers an interesting finding.
THH 61,585a 47.81a
NEAST 49,212a 152.12a Stores that sell more nongrocery products get more dollar
MWEST 210,042a NS
sales, but it leads to lower sales per square foot. This finding
NWEST 19,464a 82.14a
is acceptable given that many retailers are facing a downward
SWEST 28,212a 98.92a
trend in sales per square foot. This is partly because the
R2(adjusted) 0.872 0.6712
additional merchandise carried may be of a lower price or just more space is added to the existing merchandise display.
Bank, availability of banking facilities; CONVE, convenience: number of checkout
count-ers per square foot of selling area; DC, double couponing; MWEST, store located in Sales per square foot are significantly related to a store offering
midwest region; NEAST, store located in northeast region; NWEST, store located in
northwest region; NS, not significant; O24, open 24 hours; SCRAMB, scrambled mer- double couponing (b358.77,p50.0715) and a store being
chandising; SWEST, store located in southwest region; THH, total households. open 24 hours (b
4520.82,p50.01). Therefore, hypotheses
aSignificant at the 5% level.
bSignificant at the 10% level. H2c, H2d. and H2e are supported. However, the addition of
banking facilities yields a lower sales per square foot (b105
27.01,p5 0.082). This implies that the space provided to the bank does not result in a proportionate increase in store supported. Sales are positively related to whether the store
doubles the manufacturer coupons (a3511584,p50.0689), sales per square foot.
Sales per square foot are positively related to the total which is also in the hypothesized direction. This is an
interest-ing findinterest-ing because of a tendency among retailers to use double number of households in the trade area (b5 5 47.81,p 5
0.0001). Therefore, hypothesis H2f is supported. The coeffi-couponing strategy to combat competitive pressures (i.e., not
to lose sales to competition). Store sales are significantly re- cients for three of the four regions in which the store was located were found to be significant. Stores in the Northeast lated to a store being open 24 hours, and therefore hypothesis
H2d is supported. The presence of banking services in the (b6 5 152.12, p 5 0.0001), Northwest (b8 5 82.14, p 5
0.0001), and Southwest (b1598.92,p50.0007) have higher
grocery store increases the sales significantly (a10 5 2901,
p50.0592), and therefore H1e is supported. sales per square foot than stores in the southeastern part of the United States. However, there is no statistically significant Dollar sales are positively related to the total number of
households served by the store (a5 561585,p 50.0001). difference between sales per square foot of stores in the
Mid-west and stores in the Southeast. Overall, there is support for Therefore, hypothesis H1f is supported. The coefficients for
the geographic regions in which the store is located (Northeast, hypothesis H2g.
In summary, the results are as hypothesized with the excep-Midwest, Northwest, and Southwest) were found to be
signifi-cant (a6549212,p50.0001,a75 210042,p5 0.0462, tion of the effect of banking services on sales per square foot.
a8519464,p50.0230,a9528212,p50.0104,
respec-tively). The southeastern region was treated as the base level.
Identification of Homogeneous Trade Areas
Stores in the Northeast, Northwest, and Southwest have higherby Using Socioeconomic Characteristics
weekly dollar sales than stores in the southeastern part of theThe 460 stores were segmented using cluster analysis based United States. This could be for a variety of reasons including
on the socioeconomic characteristics of the trade area: percent-population density, size of the stores, types of merchandise
age of households with annual income greater than $30,000, sold, and level of competition. Also, stores in the Midwest
percentage of households with four or members, and percent-have lower sales than stores in the Southeast. Therefore,
hy-age of households owning their residences. First, hierarchical pothesis H1g is supported.
clustering was conducted using Ward’s method. Punj and Stewart (1983) recommend that hierarchical and
nonhierar-The Effect of Retail Environment on Sales
chical clustering be used sequentially. The results from Ward’sper Square Foot (The PRODUCTIVITY Model)
method were used as seed for a nonhierarchical clustering. The hierarchical and nonhierarchical clustering were done The PRODUCTIVITY model results are summarized in TableTable 3. Interpretation of Segment Solution time and are willing to pay for the added convenience.
There-fore, high-income households tend to spend more money for Segment Proportions
the same bundle of products than low-income households Number
do. It follows, then, that higher the percentage of high-income
Segment HHSIZE HHINC HHOWN of stores
households in a trade area, higher will be the effect of both internal and external environment on sales of a store in that
1 30.2 (high) 74.8 (high) 75.4 (high) 107
2 21.4 (low) 67.2 (high) 64.4 (high) 160 trade area. From another perspective, the greater the
percent-3 20.7 (low) 44.2 (low) 66.3 (high) 109 age of households with high incomes, the greater the extent 4 17.1 (low) 42.1 (low) 40.7 (low) 84 of dispensable income in the trade area and therefore the
greater the impact of retail environment on store sales.
HHSIZE, percentage of households with four or more family members; HHINC,
percent-age of households with household income greater than $30,000; HHOWN, percentpercent-age Inventory or storage costs influence a household’s ability
of households owning their homes. to buy larger quantities and take advantage of deals.
House-holds with storage facilities have the ability to buy larger quantities by benefiting from deals and sales promotions. based on the relative increase in R2with number of clusters,
Homeowners have greater storage space compared with those and the absolute value of R2as criteria. An overall R2of 68.86%
that rent and live in apartments and therefore can buy larger suggests that the clusters are homogeneous and well separated. quantities. Therefore, the greater the percentage of home
own-ers in a trade area, the greater the impact of retail environment INTERPRETATION OF THE CLUSTER SOLUTION. The cluster
solu-on store sales. tion was interpreted using cluster means (Aaker, Kumar, and
Time is important to larger households because of the Day, 1998). The cluster means are given in Table 3. Based on
variety of activities including those involved in childcare and the variable proportions for each cluster, they were classified as
other forms of time commitment (time that can be used for low or high (on a relative basis). For example, in Table 3, the
other activities and work). Therefore, such households would household income proportions of 74.8% for cluster 1 and
tend to buy brands and products that save time and cost 67.2% for cluster 2 are interpreted as high household income
more. Also, because of greater number of people in the house-whereas household income proportions of 44.2 and 48.7%
hold, their grocery bill would be higher than that for smaller are interpreted as low. Similar interpretations for household
families. Therefore, the greater the percentage of large families size and home ownership are given in Table 3. To summarize,
in a trade area, the greater the impact of retail environment cluster 1 corresponds to trade areas with higher income, bigger
on store sales. families who own homes, cluster 2 corresponds to trade areas
To summarize, households have different costs of shopping with higher income, smaller families who own homes, cluster
depending on their family size, income, and home ownership. 3 corresponds to trade areas with lower income, smaller
fami-Households with higher costs of shopping are likely to be lies who own homes, and cluster 4 corresponds to trade areas
influenced (what they buy and how much they buy) more with lower income, smaller families who tend to rent. The four
by a store’s environment, such as convenience of shopping, clusters consisted of 107, 160, 109, and 84 stores, respectively.
scrambled merchandising, 24-hour service, and whether the CROSS-VALIDATION OF CLUSTER SOLUTION. The cluster cen- store is located in a bigger or smaller trade area than house-troids were obtained from the cluster solution of the estimation holds that have relatively low costs of shopping. Also, the sample of 460 stores. The cluster solution was validated using effects of retail environment on dollar sales are likely to be a holdout sample of 160 stores. Stores in the holdout sample higher in trade areas that have higher percentage of households were assigned to the cluster that had the smallest Euclidean with high costs of shopping.
distance from the four cluster centroids. The degree of agree- The clustering of all the stores in our data set yields four ment between the assignment of the observations and a sepa- segments, which vary on the household income, family size, rate cluster analysis of the holdout sample was used as a and home ownership. We agree that the effects of retail envi-measure of consistency of the cluster solution. It was found ronment variables on store performance should vary with that 140 (87.5%) stores of the 160 stores in the holdout segments given the differences in socioeconomic characteris-sample were correctly classified, indicating good consistency tics. Those in group 1 (high levels for all three socioeconomic of the cluster solution. characteristics) would have the highest total costs of shopping,
followed by group 2 (high levels for two of the three
socioeco-The Differential Effect of Internal and
nomic characteristics) and group 3 (high levels for one of theExternal Environment on Sales and Sales
three socioeconomic characteristics). Group 4 (low levels for all three socioeconomic characteristics) would have the leastper Square Foot due to Socioeconomic
costs of shopping and therefore would be influenced the least
Characteristics of the Trade Area
by the retail environment. Therefore, we hypothesize that, High-income households have high opportunity costs of time.
of a grocery store vary by the segments based on ent across segments. For example, the coefficients for SCRAMB are 9497, 5891, 3071, and 1028 for segments 1 through 4, socioeconomic characteristics.
respectively. It is plausible that affluent customers do not
H4: The effects of retail environment variables on sales per
cherry pick (visiting multiple stores) and therefore shop at square foot of a grocery store vary by the segments
one store for more items relative to customers residing in poor based on socioeconomic characteristics.
neighborhoods. Similarly, consumers in segment 1 (affluent) contribute to sales more due to remaining open for 24 hours
Results
(a14 5 15212) relative to consumers in segment 4 (a44 5We specify the SEGMENTED SALES (equation 3) and PRO- 1429). Given that the customers living in affluent areas have DUCTIVITY (equation 4) model for explaining the differential busy schedules, it is probable that they shop during late eve-effect of retail environment on performance due to socioeco- nings and at nights. The effects due to presence of banking nomic characteristics, and the variables are as defined in equa- services on sales are higher for segment 1 than for other tions 1 and 2. segments. In fact, the effect of the presence of banking services is not significant for segment 4. Also, as more affluent
house-SALESij5 ai01 ai1*CONVEij1 ai2*SCRAMBij
holds (THH) are present, higher is the contribution to sales 1 ai3*DCij1 ai4*O24ij1 ai10Bankij
in segment 1 (a15 5 77451) relative to segment 4 (a45 5
1 ai5* THHij1 ai6*NEASTij
42848). Likewise, the effects due to regions vary across
seg-1 ai7* MWESTij1 ai8*NWESTij (3)
ments. Thus, it is apparent that neighborhood characteristics 1 ai9* SWESTij1eij
are also important in designing the internal and external
envi-PRODUCTIVITYij5bi01bi1*CONVEij1bi2*SCRAMBij ronment.
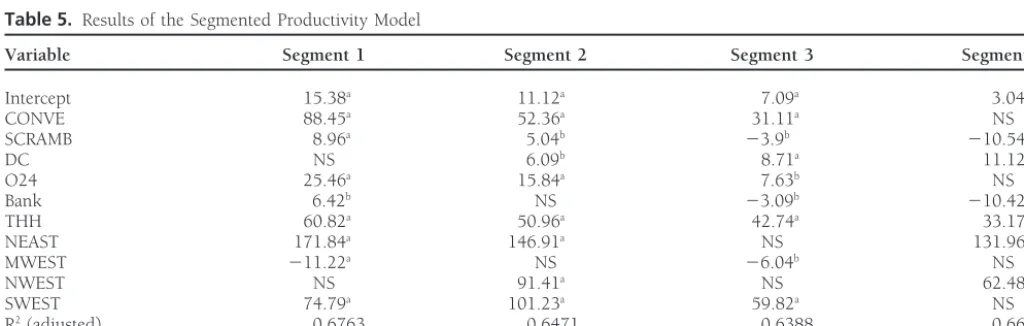
1bi3*DCij1bi4*O24ij1bi10Bankij Regarding the segment-wise productivity model, many
dif-1bi5*THHij1 bi6*NEASTij ferences are observed across segments. In general, the relative
1bi7*MWESTij1bi8*NWESTij magnitudes of effects vary across segments in the productivity
1bi9*SWESTij1dij (4) model.
Where, j5grocery store (j51 to 460). i5segment number
(i 5 1 to 4). ai0-ai9 5 parameter estimates for the SEG-
Evaluating the Consistency
MENTED SALES model.bi0-bi95parameter estimates for the
of Results
SEGMENTED PRODUCTIVITY model.eij 5 error term for
the SEGMENTED SALES model. dij 5 error term for the Analyzing how well the parameter estimates predict sales and sales per square foot assessed the consistency of the SEG-SEGMENTED PRODUCTIVITY model.
The SEGMENTED SALES model (equation 3) was esti- MENTED SALES and the SEGMENTED PRODUCTIVITY models. For this purpose, data from the 160 stores in the mated for the four segments (107 stores in segment 1, 160
stores in segment 2, 109 stores in segment 3, and 84 stores holdout sample was used. The 160 stores were segmented into four groups based on their socioeconomic characteristics. in segment 4). In all the four segments, the retail environment
variables significantly explain the variation in dollar sales (F5 The stores in the holdout sample that had similar neighbor-hood characteristics (to the stores in the estimation sample) 141.8,p5 0.001 for segment 1, F5 161.2,p50.001 for
segment 2, F5 287.3, p5 0.001 for segment 3, and F5 were only included in the analysis. Also, stores with variables outside the range of the estimation sample were not included. 110.8,p50.001 for segment 4). Also, 93.47, 91.44, 96.32,
and 94.12% (given by adjusted R2) of the variation in dollar Overall about 82% (n 5 131) of the observations were
re-tained. Sales and sales per square foot were “computed” by sales of stores in segments 1, 2, 3, and 4, respectively, is
explained by the retail environment variables. The interpreta- substituting coefficients estimated previously (shown in Tables 4 and 5) into equations 3 and 4. The “actual” values for the tion of model coefficients for the four segments is similar to
that of coefficients in the overall SALES models. stores were compared with the computed values. The error in predicting the average weekly dollar sales was calculated An interesting observation from the results is that variables
have different levels of effect in the SALES model across seg- as the difference between actual and computed average weekly dollar sales. The criterion of average absolute error (AAE) was ments in the SEGMENTED SALES model. For example,
conve-nience is significant and has a coefficient of 4892 in the overall used. It must be noted that this reanalysis is an extremely conservative test of the consistency of results and parameter model while it has coefficients of 9282, 4752, 1028, and 0 for
segments 1 through 4, respectively. Also, double couponing by estimates (Karande and Kumar, 1995). Results indicate that the AAE for the SEGMENTED SALES model is $22,984. In the store is significant in the SALES model but is not significant
in segment 1 of the SALES model. It is possible that affluent other words, on an average there is an absolute difference of $22,984 between the predicted and actual (the mean of the customers do not react to double couponing offers relative to
differ-Table 4. Results of the Segmented Sales Model
Variable Segment 1 Segment 2 Segment 3 Segment 4
Intercept 14,821a 9,084b 13,065b 27,042b
CONVE 9,282b 4,752b 1,028a NS
SCRAMB 9,497b 5,891b 3,071b 1,028a
DC NS 9,257b 14,283b 21,251b
O24 15,212b 7,286b 4,117a 1,429a
Bank 4,284b 2,502b 691a NS
THH 77,451b 67,298b 50,297b 42,848b
NEAST 52,147b 41,067b NS 212,517a
MWEST 216,089b NS 29,902b 211,054b
NWEST NS 30,141b 18,456b 10,281b
SWEST 36,421b 25,938b 15,913b NS
R2(adjusted) 0.9347 0.9144 0.9632 0.9412
Number of stores 107 160 109 84
NS, not significant. aSignificant at the 10% level.
bSignificant at the 5% level.
could be attributed to locational differences in competition PRODUCTIVITY model (equation 2) for the same set of stores and intensity of competitive activities. The utility of the SEG- is at least 14 to 20% higher than that with the SEGMENTED MENTED SALES model (equation 3) was compared with that PRODUCTIVITY model (equation 4). The fact that the SEG-of the overall SALES model (equation 1) for the same set SEG-of MENTED SALES and SEGMENTED PRODUCTIVITY models stores (n5131). It is found that AAE for each segment with outperform the overall SALES and overall PRODUCTIVITY the overall SALES model was at least 15 to 20% higher than models, respectively, in prediction lends further support to with the SEGMENTED SALES model. In other words, a retailer our contention that retailers should consider socioeconomic who has a choice between using the aggregate or the seg- characteristics in designing individual store environment. mented model will find that the segmented model results in
a lower prediction error.
Similar analysis was done to assess the utility of the SEG-
Implications for Store Managers
MENTED PRODUCTIVITY model. The AAE for theSEG-A direct implication of the empirical findings is that retail MENTED PRODUCTIVITY model (n 5131) is $50.40 (the
managers should consider the socioeconomic characteristics average of the actual sales per square foot being $576.20)
of the trade area in designing individual store environment. amounting to an 8.7% error. Again, a part of this error could
This information is readily available from sources such as the be attributed to locational differences in competition.
Further-more, it is found that AAE for each segment with the overall census. Specifically, three types of implications can be drawn.
Table 5. Results of the Segmented Productivity Model
Variable Segment 1 Segment 2 Segment 3 Segment 4
Intercept 15.38a 11.12a 7.09a 3.04b
CONVE 88.45a 52.36a 31.11a NS
SCRAMB 8.96a 5.04b 23.9b 210.54a
DC NS 6.09b 8.71a 11.12a
O24 25.46a 15.84a 7.63b NS
Bank 6.42b NS 23.09b 210.42a
THH 60.82a 50.96a 42.74a 33.17a
NEAST 171.84a 146.91a NS 131.96a
MWEST 211.22a NS 26.04b NS
NWEST NS 91.41a NS 62.48a
SWEST 74.79a 101.23a 59.82a NS
R2(adjusted) 0.6763 0.6471 0.6388 0.6642
Number of stores 107 160 109 84
NS, not significant. aSignificant at the 5% level.
1. The Differential Impact of Individual Store Environment The impact of individual store policies and store location Variables on Sales and Sales per Square Foot for Stores variables is illustrated with scrambled merchandising as an in Different Segments and the Effects of Not Considering example. The impact of the extent of scrambled merchandising Socioeconomic Characteristics in Designing Individual on dollar sales and sales per square foot can be determined by Store Environment considering two stores in segment 4, one selling 20 nongrocery products as opposed to the other selling 15 nongrocery prod-Different magnitudes of effects for different segments: The
ucts. Dollar sales for the store by using greater scrambled effects of scrambled merchandising and total number of
merchandising (20 nongrocery products) would be expected households on sales are different for stores in trade areas
to be $15,355 per week more than the other store (a325
characterized by segments 1 through 4. For example, selling
3,071). Similarly, the sales per square foot for the store by an additional nongrocery product results in additional weekly
using greater scrambled merchandising would be expected to sales of $9,497 for stores in segment 1, $5,891 for stores in
be $19.50 lower per square foot than the other store (b25
segment 2, $3,071 for stores in segment 3, and $1,028 in
23.9). The impact of other store environment variables on segment 4. In other words, selling nongrocery products results
dollar sales and sales per square foot can be similarly inter-in the greatest sales inter-increases for stores inter-in segment 1. If
cluster-preted. ing is not done, this differential effect gets averaged out in
the overall sample where one would forecast that an additional 3. Predicting Store Performance sales of $5,289 are generated (irrespective of the segments)
Tables 6 and 7, respectively, illustrate examples of how a by selling an additional nongrocery product. Similarly, the
range of dollar sales and sales per square foot can be obtained effect of locating a store in a larger area (higher number of
with different store environment characteristics. For example, households) is most pronounced in segment 1. An additional
for a store in segment 1 with strategy 1 in Table 6, a store 1,000 households result in incremental weekly sales of
manager can expect to attain weekly sales of $582,539. The $77,451 for stores in segment 1, $67,298 for stores in segment
store is located in an area with 5,000 households in the North-2, $50,297 for stores in segment 3, and $4North-2,848 for stores
east and has a store environment that includes four checkout in segment 4. Again, if segmenting is not used, the effect gets
counters per 10,000 square feet of selling area, the sale of averaged out in the total sample where one would forecast
eight nongrocery products and services, and offers double that 1,000 additional households should generate an increase
couponing. With the same strategy, store managers could of $61,585. Similar interpretations can be offered for the
attain sales per square foot of $942. We caution the reader differences in the magnitude of impact of convenience, the
that the implications offered are valid only over the range of total number of households, banking services, open for 24
values taken by the variables for the different clusters in the hours, and double couponing in different regions on sales per
estimation sample of the data set available to us.9
square foot.
Tables 6 and 7 offer some interesting implications in terms Different direction of effects: Although, the overall impact
of the quantitative impact of store environment on weekly of double couponing on sales is positive in the overall sample,
dollar sales and sales per square foot: double couponing does not impact sales significantly for stores
First, the same store policies result in different levels of in segment 1. While there is an impact of a store being open
sales and sales per square at different locations. For example, for 24 hours on sales per square foot in the total sample, it
for a store belonging to segment 1, strategy 3 and 10 in Table is found that for stores in segment 4, it has no impact.
Conve-6 show the impact of locating a store serving a larger number nience has a positive impact on sales in the total sample.
of households. Other policies remaining the same, dollar sales However, its effect on sales is not significant in segment 4.
go up from $530,392 per week to $762,745 per week and Segment 4 includes households with low income, smaller
sales per square foot increase to $953 from $770 when the families, and those who do not own their homes and therefore
number of households increases from 5,000 to 8,000. might perceive that the availability of additional convenience
Similarly, the impact of regional differences can be seen results in higher prices.
in strategies 1, 2, 3, and 4. The same strategies in different Similarly, the effect of scrambled merchandising on sales
geographical regions yield different results. It is seen that for per square foot is not significant in segment 4. However,
stores in segment 2, the same strategy yields the highest sales offering an additional nongrocery item leads to a decrease in
in the northeast and the lowest in the Midwest and Southeast. sales per square foot of $3.90 for stores in segment 3 and
However, for segment 4, the same strategy yields the highest $10.54 for stores in segment 4. Again, the effect gets averaged
sales in the Northwest and lowest sales in the Northeast. out in the total sample where it leads to a decrease in sales
Second, different levels of weekly dollar sales and sales per per square foot of $5.82 (leading to larger forecasting error).
square foot can be obtained with different store policies at The effects of store neighborhoods in different regions can be
the same location. For example, for a store in segment 4, similarly interpreted.
2. The Impact of Individual Store Policies and Store
179
Retail
Store
Environment
on
Retailer
Performance
J
Busn
Res
2000:49:167–181
Table 7. Predicted Values of Sales per Square Foot with Overall and Segmented Productivity Models
STRAT THH CNV SCMB DC O24 Bank NEAST MWEST NWEST SWEST SEG 1 SEG 2 SEG 3 SEG 4 Overall
1 5 4 8 1 1 0 1 0 0 0 942 685 330 228 671
2 5 4 8 1 1 0 0 1 0 0 759 538 324 96 519
3 5 4 8 1 1 0 0 0 1 0 770 629 330 158 601
4 5 4 8 1 1 0 0 0 0 0 770 538 330 96 519
5 5 5 18 1 1 0 1 0 0 0 1,120 787 322 122 684
6 5 3 8 0 0 0 1 0 0 0 828 610 283 217 570
7 5 4 8 0 0 1 0 0 1 0 751 607 311 137 565
8 3 4 8 0 0 0 0 0 1 0 623 505 229 81 476
9 5 3 15 1 1 0 0 0 1 0 745 612 272 84 489
10 8 4 8 1 1 0 0 0 1 0 953 782 459 258 745
Table 6. Predicted Values of Sales with Overall and Segmented Sales Models
STRAT THH CNV SCMB DC O24 Bank NEAST MWEST NWEST SWEST SEG 1 SEG 2 SEG 3 SEG 4 Overall
1 5 4 8 1 1 0 1 0 0 0 582,539 469,320 311,630 259,669 451,080
2 5 4 8 1 1 0 0 1 0 0 514,303 428,253 301,728 261,132 391,826
3 5 4 8 1 1 0 0 0 1 0 530,392 458,394 330,086 282,467 421,332
4 5 4 8 1 1 0 0 0 0 0 530,392 428,253 311,630 272,186 401,868
5 5 5 18 1 1 0 0 1 0 0 618,555 491,915 333,466 271,412 449,608
6 5 3 8 0 0 0 0 1 0 0 489,809 406,958 282,300 238,452 365,152
7 5 4 8 0 0 1 0 0 1 0 519,464 444,353 312,377 259,787 402,451
8 3 4 8 0 0 0 0 0 1 0 360,278 307,255 211,092 174,091 276,380
9 5 3 15 1 1 0 0 0 1 0 587,589 494,879 350,555 289,663 453,463
10 8 4 8 1 1 0 0 0 1 0 762,745 660,288 480,977 411,011 606,087