Employment Sector
Employment Working Paper No.
140
2013
The Philippines Employment
Projections Model: Employment
targeting and scenarios
Souleima El Achkar Hilal, Theo Sparreboom, Douglas Meade
Employment Trends Unit
Copyright © International Labour Organization 2013 First published 2013
Publications of the International Labour Office enjoy copyright under Protocol 2 of the Universal Copyright Convention. Nevertheless, short excerpts from them may be reproduced without authorization, on condition that the source is indicated. For rights of reproduction or translation, application should be made to ILO Publications (Rights and Permissions), International Labour Office, CH-1211 Geneva 22, Switzerland, or by email: [email protected]. The International Labour Office welcomes such applications.
Libraries, institutions and other users registered with reproduction rights organizations may make copies in accordance with the licences issued to them for this purpose. Visit http://www.ifrro.org to find the reproduction rights organization in your country.
ILO Cataloguing in Publication Data
El Achkar Hilal, Souleima; Sparreboom, Theo; Meade, Douglas
The Philippines employment projections model: employment targeting and scenarios/ Souleima El Achkar Hilal, Theo Sparreboom, Douglas Meade ; International Labour Office, Employment Sector, Economic and Labour Market Analysis Department. - Geneva: ILO, 2013
Employment working paper ; No.140, ISSN 1999-2939 (print); 1999-2947 (web pdf)
International Labour Office; Economic and Labour Market Analysis Dept; International Labour Office; Employment Sector
employment / employment policy / projection / model / data collecting / role of ILO / Philippines
13.01.3
The designations employed in ILO publications, which are in conformity with United Nations practice, and the presentation of material therein do not imply the expression of any opinion whatsoever on the part of the International Labour Office concerning the legal status of any country, area or territory or of its authorities, or concerning the delimitation of its frontiers. The responsibility for opinions expressed in signed articles, studies and other contributions rests solely with their authors, and publication does not constitute an endorsement by the International Labour Office of the opinions expressed in them. Reference to names of firms and commercial products and processes does not imply their endorsement by the International Labour Office, and any failure to mention a particular firm, commercial product or process is not a sign of disapproval.
ILO publications and electronic products can be obtained through major booksellers or ILO local offices in many countries, or direct from ILO Publications, International Labour Office, CH-1211 Geneva 22, Switzerland. Catalogues or lists of new publications are available free of charge from the above address, or by email: [email protected]
Visit our website: http://www.ilo.org/publns
Preface
The primary goal of the ILO is to contribute, with member States, to achieve full and productive employment and decent work for all, including women and young people, a goal embedded in the ILO Declaration on Social Justice for a Fair Globalization (2008),1 and which has now been widely adopted by the international community. The integrated approach to do this was further reaffirmed by the 2010 Resolution concerning employment policies for social justice and a fair globalization.2
In order to support member States and the social partners to reach this goal, the ILO pursues a Decent Work Agenda which comprises four interrelated areas: Respect for fundamental worker’s rights and international labour standards, employment promotion, social protection and social dialogue. Explanations and elaborations of this integrated approach and related challenges are contained in a number of key documents: in those explaining the concept of decent work,3 in the Employment Policy Convention, 1964 (No. 122), in the Global Employment Agenda and, as applied to crisis response, in the Global Jobs Pact adopted by the 2009 International Labour Conference in the aftermath of the 2008 global economic crisis.
The Employment Sector is fully engaged in supporting countries placing employment at the centre of their economic and social policies, using these complementary frameworks, and is doing so through a large range of technical support and capacity building activities, policy advisory services and policy research. As part of its research and publications programme, the Employment Sector promotes knowledge-generation around key policy issues and topics conforming to the core elements of the Global Employment Agenda and the Decent Work Agenda. The Sector’s publications consist of books, monographs, working papers, employment reports and policy briefs.
The Employment Working Papers series is designed to disseminate the main findings of research initiatives undertaken by the various departments and programmes of the Sector. The working papers are intended to encourage exchange of ideas and to stimulate debate. The views expressed are the responsibility of the author(s) and do not necessarily represent those of the ILO.
JoséManuel Salazar-Xirinachs Executive Director
Employment Sector
1 See http://www.ilo.org/public/english/bureau/dgo/download/dg_announce_en.pdf.
2 See http://www.ilo.org/public/libdoc/ilo/2010/110B09_108_engl.pdf.
3 See the successive Reports of the Director-General to the International Labour Conference:
Acknowledgements
The ILO Employment Trends team has worked in collaboration with Inforum (University of Maryland) to develop employment projection models for a number of developing countries. The development of the Philippines Employment Projections Model is based on the ILO Trends – Inforum methodology and was commissioned by the ILO Country Office for the Philippines in September 2010. The initial version of the model was presented during a workshop held in Manila in November 2010, and has subsequently been updated and expanded. The version of the model presented in this paper was completed in May 2012.
The authors would like to thank Moazam Mahmood and Irmgard Nübler for their review of the paper, as well as Ekkehard Ernst, Olga Strietska-Ilina, Christian Viegelahn and Hana Rihova Zackova for comments at various stages. In addition, the paper benefited from the comments on a presentation during the Economic and Labour Market Analysis Department’s Seminar on Labour markets in crisis: short-term and structural policy responses (Geneva, December 6-7, 2012); the usual disclaimer applies.
Abbreviations
BLES Bureau for Labour and Employment Statistics
BPO business process outsourcing
DOLE Department of Labour and Employment
DTI Department of Trade and Industry
EAPEP Economically Active Population and Estimates
EPMs employment projection models
EPR employment-to-population ratio
FIES Family Income and Expenditure Survey
GDP Gross Domestic Product
ICT information and communication technology
IPP Investment Priorities Plan
LFPR labour force participation rate
LFS Labour Force Survey
LMIA labour market information and analysis
LP labour productivity
MDG Millennium Development Goal
NEDA National Economic Development Authority
NSCB National Statistical Coordination Bureau
OFW overseas Filipino workers
PDP Philippines Development Plan
PEPM Philippines Employment Projections Model
PEDP Philippines Export Development Plan
PHP Philippines peso
PSIC Philippines Standard Industrial Classification System
UR unemployment rate
VER vulnerable employment rate
WP working poverty
WPR1 working poverty rate (1.25$/day)
WPR2 working poverty rate (2$/day)
Abstract
Employment projection models (EPMs) are important analytical tools to be used in strategic planning and policymaking, as they allow for a comprehensive analysis of the labour market in its broader economic context. They also serve a consistent analytical framework for an assessment of the effects policy scenarios including employment targeting.
This working paper illustrates the potential and applications of EPMs, building on the Philippines Employment Projection Model (PEPM). PEPM is an example of EPMs that have been built with support from the ILO as well as Inforum for Ukraine, Mongolia, Peru and Viet Nam, which are based on an interindustry input-output structure. The paper describes the main features of the model, and provides an analysis of the results (mid-term employment projections), given the baseline assumptions.
The paper details how the model can be used to provide information on employment targeting, in particular based on the MDG employment indicators, which capture both the volume and (measures of) the quality of employment. The paper also illustrates the use of the model to assess structural and sectoral change, fiscal policy and skills mismatch, which is facilitated by the interindustry nature of the model.
Contents
Page
Preface ... iii
Acknowledgements ... iv
Abbreviations ... v
Abstract ... vi
Introduction ... 1
1. The Philippines Employment Projections Model (PEPM) ... 2
1.1. Background of the work ... 2
1.2. Brief description of the model ... 3
1.2.1. Model mechanics ... 4
1.3. Baseline results & analysis: crisis, recovery and mid-term projections... 6
1.3.1. The Philippines’ economy and outlook ... 7
1.3.2. Labour market situation and outlook ... 10
1.3.3. Quality of employment ... 13
1.3.4 Industry level results ... 15
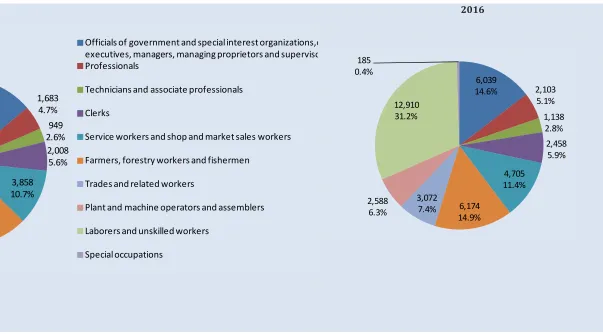
1.3.4. Occupational employment ... 29
2. Policy scenarios and applications ... 34
2.1. Skills mismatch ... 34
2.2. Fiscal policy and labour market impacts – Austerity scenario ... 46
3. Conclusions and further work ... 50
References ... 53
Annex 1 PEPM Variables, Data Sources and Baseline Assumptions ... 55
List of tables Table 1 Real GDP and its components ... 7
Table 2 Labour market aggregates ... 11
Table 3 Quality of employment ... 13
Table 4 MDG employment indicators ... 14
Table 5 Agriculture final demands and gross value added ... 16
Table 6 Agriculture output, productivity and employment ... 16
Table 7 Industry final demands and gross value added ... 17
Table 8 Industry output, productivity and employment ... 18
Table 9 Employment by industry sub-sector ... 18
Table 12 Employment by services sub-sector ... 23
Table 13 Correlations between LP, VER, and WP ... 27
Table 14 Employment by Occupation (thousands) ... 31
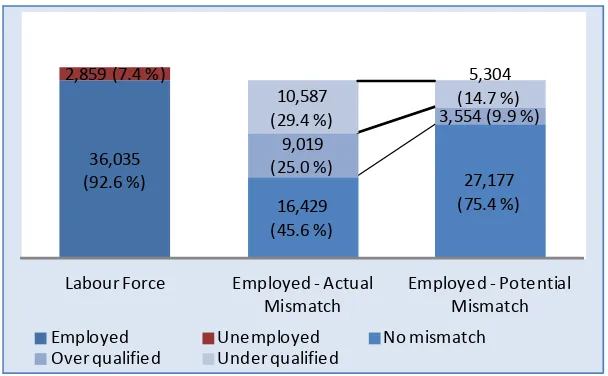
Table 15 Working-age population, labour force, employed, and skills mismatch by skill levels (thousands of persons) ... 36
Table 16 Skills mismatch (% of employed, 2001-2016) ... 38
Table 17 Skills mismatch indices ... 39
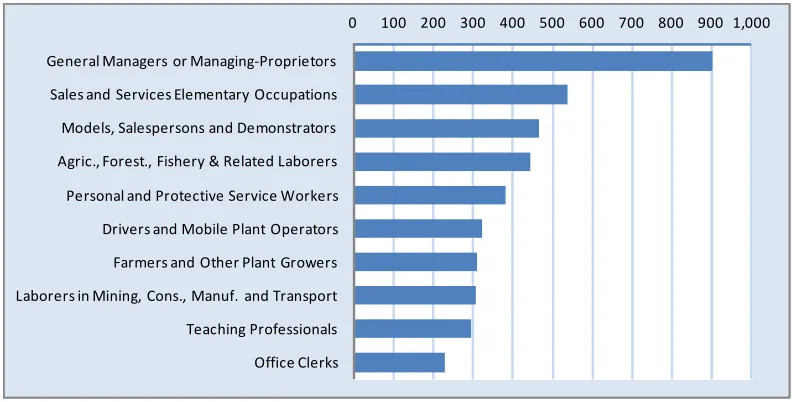
Table 18 Skills mismatch by occupational group (2010) ... 43
Table 19 Fiscal, macroeconomic and labour market variables – Baseline results and austerity scenario (2001-2016) ... 47
Table 20 Austerity scenario and the MDGs ... 48
Table 21 Government consumption by sector (bil. PHP) – Baseline results and austerity scenario (2000-2016) ... 49
List of figures Figure 1 Gross capital formation (% of GDP) - Selected economies in East Asia & the Pacific... 8
Figure 2 GDP by expenditure category - 2010 ... 9
Figure 3 Real and Nominal GDP - Forecasts comparison ... 9
Figure 4 Real GDP and its components ... 10
Figure 5 EPR, LFPR and UR (2001-2016) ... 12
Figure 6 Vulnerable employment and working poverty (2003-2015) ... 15
Figure 7 Employment and value added share by sector (2000, 2010, 2016) ... 15
Figure 8 Output and labour productivity in manufacturing sub-sectors ... 19
Figure 9 Output and labour productivity in other industry sub-sectors ... 20
Figure 10 Output and labour productivity in services sub-sectors ... 24
Figure 11 Average annual employment growth (%) - 2010-2016 - Top 10 sectors ... 26
Figure 12 Employment growth (thousands) - 2010-2016 - Top 10 sectors ... 27
Figure 13 LP and VER by sector, 2010 ... 28
Figure 14 VER and WPR2 by sector, 2010 ... 28
Figure 15 LP and WPR1, WPR2, by sector, 2010 ... 28
Figure 19 Actual and potential skills mismatch in employment (2010) ... 37
Figure 20 Actual and potential skills mismatch (2001-2016) ... 38
Figure 21 Skills mismatch and dissimilarity index (2001-2016)... 39
Figure 22 Skills mismatch by level of educational attainment (2001, 2010, and 2016) ... 40
Figure 23 Industries with largest share of overqualified workers - 2010 and 2016 ... 41
Figure 24 Industries with largest share of under qualified workers - 2010 and 2016 ... 42
Figure 25 Industries with the largest share of workers employed at their skill level (no mismatch) - 2010 and 2016 ... 43
Introduction
Employment targeting or setting employment targets as development objectives has become increasingly relevant in the aftermath of the recent global economic crisis. Developed and developing countries alike have found themselves confronted with the pressing challenge of reviving their economies and/or ensuring that output growth is accompanied by sufficient productive employment opportunities. Furthermore, the ongoing Euro zone crisis and concerns about the debt levels of many countries have raised the additional challenge of balancing economic growth and job creation on the one hand with austerity policies and debt reduction on the other. In a number of countries, achieving these objectives simultaneously has proven to be quite difficult, and a trade-off between the two sets of objectives has seen politicians confronted with mass protests and social unrest.
Setting employment outcomes as policy objectives and monitoring progress towards achieving them is an essential part of policies to mitigate the social impacts of the ongoing crises as well as broader development policies. Monitoring strategies for employment targets require effective labour market information and analysis (LMIA) systems and the methodologies that can be used are linked to the level of development of these systems (Sparreboom, 2013). For instance, at least three methods can be used to measure progress on the Millennium Development Goal (MDG) target of halving poverty (working poverty) by 2015, each of which has advantages and drawbacks in terms of data and resource requirements, analytical potential, etc. The first approach, linked with a first level LMIA system, involves a direct extrapolation of working poverty trends, without accounting for economic growth or other factors. A second approach, linked with a first or second level LMIA system, takes into account the interplay between economic factors and labour market outcomes. This approach is based on the concept of employment elasticity of growth, and can give an economic growth target that would need to be achieved in order to reach the working poverty reduction target. A third method, associated with a third level LMIA system involves the use of econometric or employment projection models (EPMs). It is the latter method that is the focus of this paper.
EPMs are important analytical tools to be used in strategic planning and policymaking, as they allow for a comprehensive analysis of the labour market in its broader economic context. For instance, they allow analysing the labour market impacts of exogenous shocks such as a decline in foreign direct investment or an export shock, or of changes in fiscal or economic policies, such as increased government spending or implementation of austerity measures, or export promotion policies. Because the models explicitly account for the inter-industry linkages within each economy, they can be used to analyse the impact that increased demand for the product of one industry has on other industries (spill-over effects in terms of output growth and/or employment growth). They are therefore particularly useful in assessing structural and sectoral change.
1. The Philippines Employment Projections Model (PEPM)
1.1.
Background of the work
The ILO Employment Trends team has worked in collaboration with Inforum4 (University of Maryland) to develop EPMs for a number of developing countries. EPMs vary in complexity and sophistication, depending on data availability and quality, as well as on resources involved in developing them. Models developed thus far for Ukraine,5 Viet Nam,6 Mongolia7 and the Philippines can be considered as basic-to-intermediate models (having some elements associated with each of the two levels of sophistication).8 Of these four countries however, the Philippines has the most extensive data and therefore a slightly more sophisticated model.
The development of the Philippines Employment Projections Model was commissioned by the ILO Country Office for the Philippines in September 2010. The model was developed in Stata software, using the ILO Trends – Inforum methodology (El Achkar, 2012). The initial version of the model was presented during a 7-day workshop held in Manila in November 2010, which aimed to introduce participants to EPMs and improve their capacity to use these analytical tools for more informed employment policymaking. Initial results were used as inputs for preparing the Philippines Development Plan (PDP) 2011-2016.9 The model was subsequently updated and expanded in July 2011, and presented in August 2011 during a second 5-day workshop in Manila, which included an appreciation seminar for social partners, with tripartite representation.10
The most recent version of the PEPM, which is presented in this paper, has been updated in May 2012. In addition, this version was validated (in Stata) by Inforum (Meade, 2012), and results of this validation have been incorporated. The models developed by Inforum use a software framework called G7, which is the statistical estimation and time series program developed and distributed by Inforum. Building on G7, Interdyme is the framework for building employment projection models. In comparison with Stata, the G7/Interdyme modeling framework has several advantages and disadvantages. G7 is a flexible, interactive, easy to use free software program that provides powerful capabilities for the manipulation and viewing of scalar, vector and matrix variables in a time-series. However, the concepts of model building in G7/Interdyme are difficult, and Stata is more
4 Inforum, or Interindustry Forecasting at the University of Maryland, has been developing employment projection models for over 20 years. The Inforum group has a network of partners in different countries that use a common methodology and software. For more information, see http://www.inforum.umd.edu.
5 See Meade (2008).
6 See Meade (2010) and Viet Nam Ministry of Labour, Invalids and Social Affairs (2011).
7 See El Achkar Hilal (2011).
8 Data requirements for three levels of sophistication of employment projection models (basic, intermediate and advanced) are explained in Werling and Meade (2010).
9 The PDP 2011-2016 is available at: http://www.neda.gov.ph/PDP/2011-2016/default.asp.
familiar to many economic and labour market analysts. Although Stata was primarily designed as statistical software, the features are sufficiently flexible to enable the creation of datasets that can implement vectors or matrices of data over time.
1.2.
Brief description of the model
One of the advantages of the EPMs framework is that it brings together economic and labour market variables, enabling users to analyse relationships between the two sets of variables.11 Specifically, economic variables in the PEPM include National Accounts data: Input-Output (IO) table for 2000, elements of the 2006 IO table, Gross Domestic Product (GDP) and its components in current and constant units for 1998-2010, and real and nominal GDP by sector data, also for 1998-2010. The relationships contained in a country’s IO Table are at the core of these models. Therefore, the models explicitly account for inter-industry linkages as well as the different industries’ contributions to country’s GDP through both the expenditure and income approaches.
Labour market variables include employment by sector and by occupation, the labour force, the working-age population, labour force participation rate, unemployment rate and other indicators. The PEPM includes annual labour market indicators and figures, compiled from quarterly Labour Force Survey (LFS) micro-datasets for 2001-2010,12 as well as merged Family Income and Expenditure Survey (FIES) – LFS micro-datasets for the years 2000, 2003, 2006 and 2009. Compiling figures from the micro-datasets ensures the consistency of the definitions and measurements used, and therefore data comparability across time. In addition, labour force, working-age population and labour force participation data from the ILO’s Economically Active Population Estimates and Projections (EAPEP) database (1980-2020, see ILO, 2011a) are used for exogenous assumptions on labour force growth over the forecast period.
Most of the data listed above were available from the National Statistics Office (NSO), the National Economic Development Authority (NEDA), and the National Statistical Coordination Bureau (NSCB), either on the departments’ and agencies’ websites, or upon request. Additional data on remittances were obtained from the Philippines Central Bank,13 and government finances data were obtained from the World Bank’s World Development Indicators (WDI) database. GDP expenditure components and deflators forecast (2011-2020) data were obtained from the Economist Intelligence Unit (EIU), and real and nominal GDP estimates and forecasts (1985-2015) used mainly for comparison purposes and as a basis for some of the exogenous assumptions, were obtained from the International Monetary Fund (IMF).
Before the model can be run, input data are adjusted to ensure consistency and comparability across data sources and years, and also to fill-in missing observations. In particular, data are adjusted to obtain a consistent national accounts framework over time (for all years over the historical period). This involves:
• Aggregating industry data such that data from all sources refer to the same 25 industries, based on the Philippines Standard Industrial Classification System (PSIC) 1-digit
11 For more information on the theoretical framework and foundations of the models, please refer to Almon (2012), ‘The Craft of Economic Modeling’, available at: http://inforumweb.umd.edu/papers/ publishedwork/books/craft1.pdf.
12 Note that annual data for 2002 from the LFS refers to the average of the first three quarters of the year only.
level.14 The 25 industries include 7 manufacturing sectors which allow for a detailed analysis of the effects of industrial policies.
• Adjusting GDP expenditure components data to national account totals for all years. • Ensuring that real variables refer to the same base year, in this case 2000.
• Interpolating data to fill-in missing observations in time series.
• Updating the IO table consistently with the industry and national account totals, using the RAS procedure.15
1.2.1.
Model mechanics
In the PEPM, some variables are endogenously determined, while others are assumed to grow based on an exogenous forecast. Assumptions regarding the exogenous growth of variables can be modified to produce alternative scenarios. Annex 1 contains a list of data sources, endogenous and exogenous variables.
The PEPM is specified as a series of loops within which a number of equations are run, and variables are simultaneously determined. Specifically, the major (largest) loop is the annual loop, which runs once for each year of the forecast (2011-2020). Within the annual loop is the GDP loop, which runs several times until the forecast year’s GDP and its components converge (their value no longer changes from one iteration to another). Within the GDP loop, there is the output loop, which also runs several times until gross output for all industries converges for the year of the forecast. Within the output loop, an iterative process called Seidel takes place, which solves the input-output identity and simultaneously determines gross output and imports by industry. Productivity ratios are then used to obtain employment by industry, and industry-occupation matrices are used to obtain employment by occupation. The model has also been extended to provide information on the quality of employment, specifically, by projecting vulnerable employment and working poverty by industry.
At the beginning of each annual loop, final demand components (private and government consumption, gross capital formation, and exports) are obtained in real terms, at the industry and aggregate levels. Depending on the models, some expenditure components of GDP at the aggregate level are determined exogenously,16 while others are endogenous, simultaneously determined with GDP. In the current version of the PEPM, three expenditure components are endogenously determined (simultaneously with GDP): Private consumption, through a consumption equation; government consumption, through a
14 Information on the 2009 PSIC is available at http://www.nscb.gov.ph/csd/psic1.asp. The industry groups used in the PEPM correspond to the 1-digit PSIC classification, with the exception of the manufacturing sector, which is further disaggregated.
15 The RAS procedure is a widely used method which was first mentioned by Leontief in the 1941 edition of The Structure of the American Economy, but the idea seemed to pass unnoticed until Stone’s description of the method in A Computable Model of Economic Growth (Chapman and Hall, London, 1962). The method requires an IO table (estimated from full data) for a past year, and row and column sums for the current year IO table. The procedure, also referred to as ‘Bi-proportional adjustment’ consists in finding a set of multipliers (R) to adjust the rows of the existing matrix (A), and a set of multipliers (S) to adjust the columns, so that the cells in the adjusted matrix sum to required row and column totals in the current year.
government spending equation;17 and imports, aggregated from industry imports determined through the Seidel process.18 Note that gross capital formation, which was endogenous in previous versions of the PEPM is now exogenously determined.19 This change was made mainly because of the somewhat strange historical relationship between investment and growth in the Philippines.20 Furthermore, making investment exogenous limits the number of GDP components determined endogenously in the PEPM to three, thus making the model’s GDP forecast more consistent with that of the Economist Intelligence Unit.
After the private consumption and government spending equations are run, each of the final demands are determined at the industry level through regressions that use a combination of variables among the macro-level variables determined in the previous steps and industry output.21 The idea behind using the macro-level variables in the corresponding industry-level regressions is to link the growth of the industry level variables with the growth of the variable at the aggregate level. This is consistent with the data adjustment procedure used to extrapolate the industry-level final demands over the historical period, using the growth of the corresponding aggregate level final demands (national account control totals).
Note that again, because of the model specification as a system of simultaneous equations, some of the dependent variables are determined jointly with some of the regressors, which has implications for the interpretation of regression results and coefficients. The industry level private consumption of households (fceh, with an ‘R’ and ‘N’ indicating real or nominal values, respectively), gross capital formation (gcf) and exports (ex) equations were specified as follows for most sectors:
where var = {fceh, gcf, ex}
In some cases, where the above regressions resulted in a poor fit, the equations were slightly modified. Specifically, for eight sectors,22 the final private consumption equation was modified as follows:
17 The consumption equation and government spending equation are discussed in El Achkar Hilal (2012).
18 In the initial version of the PEPM, gross capital formation and imports were endogenously determined, while private consumption, government consumption and exports were projected based on exogenous assumptions. In the 2011 PEPM, household consumption was also made endogenous. In the most recent version of the PEPM, gross capital formation was made exogenous, and government consumption made endogenous instead.
19 Specifically, in the 2011 PEPM, gross capital formation was determined through the investment equation, specified as follows:
20 See: “Rising Growth, Declining Investment: The Puzzle of the Philippines”, A.M. Bocchi, World Bank Policy Research Working Paper 4472
21 Note that in previous versions of the PEPM, the growth rate of industry level final demands was forecasted exogenously, based on historical trends and additional information (e.g. planned investment or government spending in certain sectors). The industry level final demands have therefore been ‘endogenized’ in the most recent version of the PEPM.
For two sectors,23 the exports equation was modified as follows:
Final government consumption at the industry-level was also specified for the three industry sectors24 for which it is relevant and set to zero for the other sectors, as per the Philippines’ IO table. Therefore, for each of the public administration, education and health care sectors, government final consumption (fceg) was specified as:
The import share of domestic demand is also extrapolated over the forecast period for each sector, using a linear trend.
A smoothing technique is used to ensure that the final demands obtained through the industry-level regressions do not result in extreme values. Specifically, when the absolute value of the change in final demand for a sector exceeds 15 per cent, only half of this change is applied to the relevant variable. The industry-level final demands are then scaled to be consistent with the aggregate level final demands determined through the macro-level equations or exogenous assumptions.25
In addition to these equations, gross output by industry and industry imports are also determined within the GDP loop through a process called Seidel as mentioned above. Seidel is an iterative process (method of successive approximations) used to solve the input-output identity and translate the final demand components for each industry into gross output by industry.26
1.3.
Baseline results & analysis: crisis, recovery and mid-term projections
This section provides an analysis of the results of the latest PEPM run, given the baseline assumptions of the model. The assumptions can be modified to allow for scenario modeling as explained further below.
The section starts with an analysis of the model’s results at the macro (national) level, and then examines the Philippines’ progress with respect to the MDG employment targets. It aims to demonstrate the wealth of information that is generated by employment projection models. This information includes industry-level developments of value added and employment, measures of employment quality (as captured by the MDG employment indicators), as well as occupational forecasts. This information can be used to inform
23 The two sectors are: Manufacturing and Repair of Furniture, Recycling and Manufacturing NEC (9) and Construction (12).
24 Specifically, the industry-level final demand equation was specified for: Public Administration and Defense, Compulsory Social Security (21); Education (22); Human Health and Social Work Activities (23).
25 This is done with a technique called ‘right direction scale’ which is a method of proportionally scaling a vector while taking into account the sign of the vector elements (method used to ensure that scaling results are accurate in the presence of both positive and negative vector elements).
policymakers on issues such as the identification of sub-sectors that are pivotal in the generation of decent work opportunities, and the future demand for education and skills.
The forecast period presented in this paper is between 2010 (last year for which most data are available) and 2016, chosen for consistency with the timeframe of the PDP 2011-2016. However, the model’s projection period can be extended to 2020. When discussing the MDGs, however, the forecast period is limited to 2015, which is the target date for the achievement of the Goals.
1.3.1. The Philippines’ economy and outlook
The Philippines economy grew at an average annual rate of 4.8 per cent between 2000 and 2010, despite a number of crises related to export shocks, food and fuel prices, politics and natural disasters (table 1). The recent global economic crisis, which started in developed economies in 2008 and spread to developing economies, resulted in slower economic growth (1.1 per cent) for the Philippines in 2009. A significant decline in demand from abroad affected export-oriented sectors, and the impact spread to other sectors through lower domestic demand. Although export sectors are concentrated in urban areas, rural areas were also affected through lower remittances, reverse labour migration, and a decline in prices of minerals and agricultural exports. Lower domestic demand also affected imports, which declined by 8.1 per cent in 2009.
!
"
! "
#$ ! "
% ! "
Source: NSCB and PEPM 2012
" #$ % & ' ( ) *
10 20 30 40 50
2000 2001 2002 2003 2004 2005 2006 2007 2008 2009 2010
East Asia & Pacific (developing only) Indonesia
Malaysia Philippines
Thailand China
Source: World Bank, World Development Indicators, 2012
The low level of domestic investment in the Philippines, despite relatively high economic growth rates, has been the subject of much debate. Among the explanations provided are: inadequate infrastructure and transport and logistics network (ADB, 2007a); weak institutions, bureaucratic inefficiency and corruption (NEDA, 2011); fiscal constraints on government investment, which in turn deters private investment; low marginal return to capital for capital-intensive firms; rent-seeking activities of large corporate conglomerates controlled by politically influential local elites; and fast growth in low capital-intensive services sectors, such as the business process outsourcing (BPO) and information and communication technology (ICT) sectors, which do not require rapid investment growth to benefit from high profits (Bocchi, 2008).
The decreases in exports (-7.8 per cent) and in gross capital formation (-8.7 per cent) in 2009 were offset by a significant increase in government spending (10.9 per cent) and by sustained growth in private consumption expenditure (2.3 per cent) (table 1). The rise in government spending or the final consumption of government was due to a policy response, adopted by a number of governments around the world, of implementing stimulus packages and special measures to mitigate the crisis impact on workers and their families. Government expenditure had been on the rise even prior to the crisis, enabled by the reform of the value added tax system in 2005 (Aldaba and Hermoso, 2010).
Growth in private consumption expenditure or final expenditure of households was slower than the recent years’ average, but remained positive nevertheless. It is likely that this increase was supported by the steady flow of remittances, which, contrary to expectations did not decline during the crisis (Aldaba and Hermoso, 2010).
The economy recovered in 2010, with a growth rate of 7.6 per cent, driven by a 31.6 per cent rise in gross capital formation and a 21 per cent increase in exports (table 1). Imports rebounded as well, growing by 22.5 per cent. Private consumption growth was higher than in 2009, with 3.4 per cent. Government consumption growth was lower than in 2009, but remained relatively high at 4 per cent.
The Philippines’ economy is forecasted to grow at an average annual rate of 4.2 per cent between 2010 and 2013, and of 6.2 per cent between 2013 and 2016, which results in an average annual rate of 5.2 per cent over the forecast period (2010-2016). The forecasted real GDP growth is slightly higher than the IMF and EIU forecasts (figure 3), but lower than the government target of 7-8 per cent under the PDP (NEDA, 2011, p.32).
Final household consumption and final government consumption are projected to "
0 2000 4000 6000 8000 10000 12000 14000 16000 18000
PEPM Real GDP (bil. 2000 PHP) PEPM Nominal GDP (bil. PHP)
EIU Real GDP (bil. 2000 PHP) EIU Nominal GDP (bil. PHP) IMF Nominal GDP (bil. PHP) IMF Real GDP (bil. 2000 PHP)
Sources: IMF, WEO; EIU 2012; PEPM 2012
" + ! " +
69% 10%
21% 0%
Final consumption of households
Final consumption of government
Gross capital formation
Net exports
equivalent to that of the historical period (2000-2010) for private consumption, but higher than that of the historical period for government consumption.27 Gross capital formation is projected to grow at an average annual rate of 4.8 per cent over the forecast period; exports are expected to grow at an average annual rate of 4.4 per cent, while imports are only forecasted to grow at an average rate annual rate of 2.8 per cent.28 Figure 4 illustrates the growth of GDP expenditure components over the historical and forecast periods.
" ,
0
2
0
0
0
4
0
0
0
6
0
0
0
8
0
0
0
2000 2004 2008 2012 2016
Private Cons. Expend., bil. PHP Gov't Cons. Expend., bil. PHP Gross Capital Formation, bil. PHP Exports, bil. PHP
Imports, bil. PHP Gross Domestic Product, bil. PHP
Source: PEPM 2012
1.3.2. Labour market situation and outlook
Limited productive employment opportunities in the formal sector in the Philippines have resulted in a large number of people seeking jobs abroad, and have discouraged others from participating in the labour market, as reflected in relatively low labour force participation rates compared to other Asian countries (King Desjardin, 2010). In 2010, the working-age population of the Philippines, which consists of the population aged 15 years and older, excluding overseas Filipino workers (OFWs) was just over 60 million people, nearly two-thirds of the total population. Out of these 60 million, only 39 million were in the labour force, including 36 million employed persons (table 2).
Between 2001 and 2010, the labour force and employment grew at the same average annual rate as the working-age population (2.4 per cent). As a result, the labour force
27 The underlying baseline assumptions behind the forecasted growth of these two variables are a linear trend over the forecast period in the growth of tax revenues, government spending, official development assistance (ODA), and slowly decreasing remittances growth (growth rate forecasted by the Central Bank for 2011, decreasing slowly to the historical average by 2020). The assumptions behind the growth of government consumption will be revised to simulate a lower government spending/austerity scenario and analysed in Section 2.2. The assumptions on the growth of remittances have also been revised and analysed to produce alternate scenarios, but these are not discussed in this paper, which presents a selected number of applications of the PEPM.
participation rate (LFPR) and employment-to-population ratio (EPR) did not increase during this period. Indeed, both the LFPR and the EPR decreased between 2001 and 2008. In 2009, the LFPR increased by 0.4 percentage points, partly due to the ‘added-worker effect’ – an increase in labour force participation as household members join the workforce to compensate for the decline in household income. This effect is also likely to have driven the 2.9 per cent net employment growth and the rise in EPR in 2009. In 2010, both the LFPR and EPR increased slightly, by 0.1 percentage point.
The unemployment rate in the Philippines increased from 7.0 per cent in 2001 to 7.4 per cent in 2008. In 2009, it increased slightly to 7.5 per cent before decreasing to 7.3 per cent in 2010. In a developing country like the Philippines, the unemployment rate alone does not adequately reflect the extent of labour underutilization. This is because a large share of workers is involved in low-productivity work, or vulnerable employment, often in the informal sector, or is underemployed. Nevertheless, the unemployment rate of the Philippines is high relative to other developing countries. A number of explanations for this relatively high unemployment rate have been suggested, including limited employment opportunities and an inefficiently protected formal labour market where regulation is driven by political rather than economic imperatives (Bocchi, 2008).
- . "" "
& ' (
) !* ' +,
(-. / ! ! ' (
# 0 ' (
1 0 ' ( "
. / ! 2! 0 '
2 2 ! 3 !* !( "
. / ! ! 2 !
4 '5(
# 0 " "
4 '5(
1 0 4 '5(
Source: PEPM 2012
The slowdown in economic activity caused labour productivity to drop by 1.7 per cent in 2009. This was followed by high productivity growth (4.7 per cent) as the economy recovered in 2010. Labour productivity is projected to grow at an annual average rate of 2.0 per cent between 2010 and 2013, and of 3.6 per cent between 2013 and 2016. The projected average annual growth rate of labour productivity over the forecast period (2.8 per cent) surpasses that of the 2001-2010 period (2.5 per cent).
Labour force growth is projected to be slightly slower than that of the working-age-population between 2010 and 2013, resulting in a decrease in the labour force participation rate to 63.9 per cent.29 The labour force participation rate is then projected to remain relatively constant over the rest of the forecast period.
Employment growth is projected to be slower than working-age population growth between 2010 and 2013, but faster than working-age population growth for the rest of forecast period. As a result the EPR is projected to decline to 59.0 per cent by 2013, but increase back to 59.4 per cent by 2016.
The net employment growth projection of 5.4 million workers between 2010 and 2016 is slightly below the PDP 2011-2016 target of 6 million.30
The unemployment rate is projected to increase to 7.7 per cent in 2012, and decline thereafter to 7.0 per cent by 2016. In the first half of the projection period, the unemployment rate would be higher than the rates expected in the PDP (6.8 – 7.0 per cent) but would converge towards these rates in the second half of the projection period. Note that the PEPM GDP growth forecast is also lower than the PDP target. If higher growth rates were realised, the unemployment rate forecast would be revised downwards (provided labour force participation does not change).
" / ' 0 - 1 # %
5.0 6.0 7.0 8.0 9.0 10.0
58.0 59.0 60.0 61.0 62.0 63.0 64.0 65.0 66.0
2001 2004 2007 2010 2013 2016
EPR (Left axis) LFPR - Baseline (Left axis) LFPR - PDP assumption (Left axis) UR - Baseline (Right axis) UR - PDP assumption (Right axis)
Sources: LFS (2001-2010), ILO (2011a), and PEPM 2012
The PEPM unemployment rate projection is also based on the above-mentioned labour force projections (from EAPEP). The labour force growth projection in the PDP 2011-2016 is higher, however (2.75 per cent annual growth instead of 2.3 per cent over the forecast period). If the PDP labour force participation rate projections were realised, the LFPR would increase steadily over the forecast period to 65.4 per cent in 2016 (figure 5). The unemployment rate (UR) would also continue to increase over the forecast period, however, to 9.2 per cent in 2016. Thus, because the PEPM’s main output is the employment forecast, and unemployment is obtained as a residual from the exogenously determined labour force, an increase in the labour force due to a change in the model’s assumptions is absorbed entirely into unemployment. In order for some of the additional labour market participants to be absorbed into employment, additional assumptions such as those underlying the economy’s growth forecast would have to change as well. In other words, unless we also assume that economic growth will be faster than the baseline scenario, leading to higher employment growth, the additional labour force growth will result in higher unemployment levels and rate.
Because a large number of workers in developing economies are engaged in low productivity, vulnerable employment, often in the informal sector, employment and unemployment rates and trends alone are not sufficient to adequately depict the labour market situation in these economies. Additional indicators that reflect the quality of employment and the living standards of workers are also needed for a more complete analysis. EPMs can be extended to allow projecting these additional indicators, some of which are presented in the next section.
1.3.3. Quality of employment
In this paper, the employment indicators used to measure progress on achieving MDG target 1B are used to assess the quality of employment (see box 1). Out of the 36 million workers in the Philippines in 2010, 15 million or 41.7 per cent were either own-account workers or contributing family workers – the two employment status categories that constitute vulnerable employment (table 3). Vulnerable workers usually suffer from inadequate working conditions, have low productivity and income, and lack social security protection, as these workers are often employed in the informal sector. They and their families are therefore often at risk of living in poverty. In 2010, 6 million workers or 16.6 per cent of the employed in the Philippines were living with their families in extreme poverty, or below the international poverty line of 1.25 $/day, adjusted for purchasing power parity (PPP), and another 8 million people were living under the 2.00 $/ day poverty line.
2 + +
( 3 " * " #$%
( 4 (
" " " " " "
# 0 ' (
6 ! / 0
' (
6#4 '5(
) !* ! 0
' 78 0, ( "
)24 ' 78 0, 5(
) !* ! 0
' 78 0, ( "
)24 ' 78 0, 5(
Sources: Sources: LFS and LFS-FIES (2003, 2006, 2009), PEPM 2012
5 ! 6 7 + " "
4 0 ! ! 3 ! 0 ! ' ! 0 ! 0
/9 ( : ! ! ! ! ! /9 % $ ,
#2; ! ! ! 0 0 & 0 / ! !* /9
! ! 0 ! , ! !
& 3 0 ! ! ! ! * ; < = ';<= (
& !! ! 3 !* , ! ! , / ! 0 ! "
! 3 !*
! 0 ! ! ! ! ! ! > ' ! 0
3 !* ! , 3 0 ( ! ;<= = ' ! $ ! ! 0 !(,
0 ! ! ! ! ! ? ' ! ! 0 ! !0 !0
( ! ;<= = ' ! ! : 0 3 ! 3 ( @ 0, ;<= 0
! ! 3 '%.A, (B
=! 3 ! =<2 ! ! 0 ' ! ! 3 ! / ! ! 0 " .2( # 0 " " ! '#24(
2! ! 0 / 3 7 '222( ! 0 ' ! 3 !* ! 0 ! " )24(
2! ! 3 " ! / 0 3 !* ! 0
' ! ! / 0 ! " 6#4(
@ ! 3 3 0 " ! ! !
& / ! 2#2; ! 9 ! ! ! ! & ! ! : ! ! 2#2; !
/0 !, 3 ! 3 ! 3 $ / ! * !
, 7 +
;<= % !B
.2 ! 3 ! #24 )24 6#4
"
& ' " , 5 ( " " "
! C ' " , 5 ( " " " "
@ ! B . @" %#@ ' , , ( 2#2;
> 3 , ! ! / ! ! ! ! ! B / !
! 0, ! =<2 ! ! 0 , ! 3 ! ! , !
! / 3 3 3 ! 3 D 3 !* ! 0 ! 3 ! 3 !D
! / 0 ! 3 ! 3 ! & 0 " " ! 3 ! 3
! 3 ! / , 0 ! 3 ! 3 !* "
! 3 ! !
> 3 , ! ! ;<= , ! ! ! $ !
! ! 3 !* ! 0 ! / 0 ! , / ! ! * 0 / 3 !
! ! & 0 " " ! ! ! /0 ! ! / 3
, 3 / ! ! 0 ! / ! 3 !
& ! ! , ! / ! , / ! ! ! ! ,
! 0 ! !0 ! * ! ;<= 0
! /0 @ 0 ! 0 ! , ! ! 0 ! ' !
! ! 8 ! ! ! ( ! .2 ! 3 !*
Vulnerable employment is projected to grow at an average annual rate of 1.8 per cent during the forecast period, a rate that is slower than the employment growth rate (table 3). Therefore, the vulnerable employment rate is projected to continue declining to 40.4 per cent by 2016, despite an increase in the number of vulnerable workers. Similarly, working poverty rates are projected to continue declining, despite an increase in the number of working poor.
1.3.4
Industry level results
One of the strengths of EPMs is the ability to generate projections at the level of detailed industries. This section illustrates the use of EPMs for the identification of sectors or subsectors that could be pivotal in the generation of decent work opportunities. The PEPM 2012 covers 1-digit PSIC sectors, with further disaggregation for the manufacturing sector.
" 8 ' + 3 * + # 0 0 %
0 10 20 30 40 50 60 70
GVA share (%)
Employment share (%)
GVA share (%)
Employment share (%)
GVA share (%)
Employment share (%)
Agriculture Industry Services
2000 2010 2016
Source: PEPM 2012
" 9 + : . " 3 + # /%
10.0 15.0 20.0 25.0 30.0 35.0 40.0 45.0 50.0
4.0 6.0 8.0 10.0 12.0 14.0 16.0 18.0
2003 2006 2009 2012 2015
Vulnerable employment (mil., left axis) Working poverty (1.25$/day, mil., left axis) Working poverty (2.00$/day, mil., left axis) VER (%, right axis)
WPR1 (%, right axis) WPR2 (%, right axis)
Agriculture
Between 2000 and 2010, the agriculture sector’s value added share in the Philippines’ economy remained nearly constant at approximately 6 per cent (figure 7). The sector’s share in employment decreased from approximately 37 per cent in 2000 to 33 per cent in 2010. Nevertheless, in 2010, agriculture remained a major sector in terms of employment, with nearly twelve million workers (table 6).
/ (" " 3
3 # 6
; % " " "
# 6
; % "
'! # 6 ; % "
< # 6 ; % "
9 ( # 6
; % " "
Source: PEPM 2012
In the PDP 2011-2016, agribusiness, forest-based and livestock industries have been identified as priority areas. The government has committed itself to solve pending property rights issues, improve infrastructure in rural areas, and expand and diversify export markets for agro-based products namely through newly signed Free Trade Agreements (FTAs), thus setting the stage for faster agriculture growth and investment. Over the forecast period, agriculture value added is forecast to grow at an average annual rate of 6.9 per cent, which is higher than the historical period’s average of 4.8 per cent (table 5). The sector’s share in value added is projected to increase to 6.5 per cent by 2016.
(" 0 3 + +
= # 6 ; % " "
- 3 +
# * 6 ; : . % "
' + # * 6% "
' + # * 0 $%
Source: PEPM 2012
historical period – to 31 per cent by 2016. Labour productivity growth in agriculture is therefore forecasted to increase at a higher average annual rate (5.1 per cent) over the forecast period than over the historical period (2.3 per cent).
Industry
Industry’s share in value added in the Philippines declined from 41.2 per cent in 2000 to 35.3 per cent in 2010. Deindustrialization is forecast to continue with a decrease of industry’s share in value added to 33 per cent by 2016 (table 7). This decline is partly attributable to the manufacturing sub-sector, which has seen its share in the country’s GDP decrease in past years. Industrial output is projected to grow at an average annual rate of 3.9 per cent over the forecast period, which is slower than its growth rate of 6 per cent over the historical period (table 8). This is partly attributable to the slow projected growth of gross capital formation of only 1 per cent, compared to 3.4 per cent over the historical period.
8 < + " 3
3 # 6 ; % "
# 6
; % "
'! # 6 ; % "
< # 6 ; % "
9 ( # 6 ; % "
Source: PEPM 2012
In 2010, some 5.4 million workers were employed in the industry sector, and this number is projected to increase to approximately 6 million by 2016 (table 8). Employment growth in industry is forecasted to be slightly higher (1.6 per cent compared to 1.4 per cent for the historical period). The sector’s share in employment, which fell from 16.8 per cent in 2000 to 15 per cent in 2010, is projected to decline further to 14.4 per cent by 2016. This process of deindustrialisation is particularly alarming in the Philippines, because it is occurring at low level of industrial development (ADB, 2007b). The slow growth in industry employment may have significant implications, as the sector often comprises a higher share of decent work opportunities and higher productivity jobs. The industry sector’s labour productivity was 15 times that of the agriculture sector, and 4 times that of the services sector in 2010. Labour productivity growth in the industry sector is forecasted to be slower (2.3 per cent) over the forecast period (table 8).
industries and promote linkages between them and mineral-based manufacturing industries with the objective of doubling mining exports by 2016.31
< + 0 3 + +
= # 6 ; % "
- 3 + # * 6
; : . % "
' + # * 6% ' + # * 0 $%
Source: PEPM 2012
Industry employment growth is projected to be slowest in manufacturing (only 0.5 per cent annual growth), which is the largest industry sub-sector in terms of employment, with over 3 million workers in 2010 (table 9). Employment growth in manufacturing is projected to be driven by growth in wood and paper products, printing and publishing, in food products, beverages, and tobacco products, in non-metallic mineral products and basic metal products.
' + + +
7 " 2 + "
7 " " "
2! , > ! , & / 2!
& $ , ) ! ? !
. ! 2! " " " " "
) 2 ! 2! , 2!
2 /
E " ; ! 2! "
> ; ; 2! " "
; !0 #: " " " "
; ! 4 !
! ! , 4 0
; ! E#C
" " " " "
' +0 0 & (
> " & + "
? & +0 & : " 0 ? 7 "
( 3 > < +
Source: PEPM 2012
" = 3 + " 0 500 1000 1500 2000 2500 3000 3500
2000 2005 2010 2015
Food Products, Beverages, and Tobacco Products 0 50 100 150 200 250 300 350 400
2000 2005 2010 2015
Textiles, Wearing Apparel and Leather Products 0 100 200 300 400 500 600
2000 2005 2010 2015
Wood and Paper Products, Printing and Publishing 0 500 1000 1500 2000 2500 3000 3500
2000 2005 2010 2015
Non-metallic Mineral Products
0 200 400 600 800 1000 1200 1400 1600 1800
2000 2005 2010 2015
Basic Metals and Metal Products
0 500 1000 1500 2000 2500 3000 3500 4000 4500
2000 2005 2010 2015
Machinery and Equipment
0 200 400 600
2000 2005 2010 2015
Manufacturing and Repair of Furniture, Recycling and Manufacturing NEC
" = 3 + * +
0 100 200 300 400 500 600
2000 2005 2010 2015
Mining and Quarrying
0 50 100 150 200 250 300 350 400 450
2000 2005 2010 2015
Construction
0 2000 4000 6000 8000 10000
2000 2005 2010 2015
Electricity, Gas, Steam and Air-Conditioning Supply
0 500 1000
2000 2005 2010 2015
Water Supply, Sewerage, Waste Management and Remediation Activities
Output (bil. 2000 PHP)
Labour productivty (thous. 2000 PHP per worker)
Other manufacturing sub-sectors are projected to have a decline in employment: textiles, wearing apparel and leather products; manufacturing and repair of furniture and other manufacturing not elsewhere classified; and machinery and equipment. In the two former subsectors, the declining trend in output and labour productivity over the past years should slow down or reverse (figure 8), but benefits in terms of employment growth are not expected in the medium term. In the latter subsector, output and productivity are projected to continue growing, but labour productivity growth is expected to surpass output growth, leading to a decline in employment. Note that the machinery and equipment subsector’s labour productivity level is already considerably higher than the other manufacturing subsectors (figures 8 and 9). This subsector includes electronic products, the largest merchandise export of the Philippines, and accounted for some 55 per cent of manufacturing exports in 2010 (PEPM, 2012).
Employment in construction, the second largest industry sub-sector in terms of employment, is forecasted to continue growing at 2.6 per cent annually over the forecast period, which is nearly the same rate as the historical period. In the PDP 2011-2016, the government has stated its intention of using public private partnerships (PPPs) to implement significant infrastructure programs, which should raise the construction sector output and employment levels over the medium term. The government has also committed to increasing incentives for investment in mass and socialised housing and to increasing the target number of housing loans, in order to address a housing shortage. The Construction Industry Strategic Plan for the 21st Century or CI21 was also developed to provide a framework for faster growth of the construction industry (NEDA, 2011).
Employment in electricity, gas and steam and air-conditioning is projected to be modest (1.3 per cent) over the forecast period, while employment in water supply, sewerage, and waste management and remediation activities is projected to grow at 3.3 per cent (table 9).
Services
The services sector is the largest sector in the Philippines, both in terms of value added and employment (figure 7). In 2010, more than half of workers (51.2 per cent) were employed in services.
The sector’s share in value added increased from 52.9 per cent in 2000 to 58.8 per cent in 2010, and is forecasted to increase further to 60.5 per cent by 2016 (table 10). The high growth in services value added is projected to be driven by sustained high growth of the sector’s gross capital formation and exports.
& 3 " 3
3 # 6 ; %
3 # 6
; %
# 6
; % "
'! # 6 ; % "
< # 6 ; % "
9 ( # 6 ; %
Source: PEPM 2012
& 3 0 3 + +
A '/ 2 2(
. / ! 2! 0 ' 2 2 ! 3 !* !(
# 0 ' (
# 0 ' ! , 5(
Source: PEPM 2012
Labour productivity in the services sector is projected to grow at an average annual rate of 2.2 per cent over the forecast period (table 11). The service sector is far from homogenous, and its sub-sectors differ significantly in terms of labour productivity and working conditions (figure 10).
Within the overall services sector, employment growth rates are projected to be the highest in real estate activities (8.2 per cent annually over the forecast period), professional, scientific and technical services (6.3 per cent); and administrative and support service activities (6 per cent) (table 12). Note that for the first two sub-sectors, growth rates are from relatively low employment levels. The real estate activities industry is the services sub-sector with the highest labour productivity levels (figure 10). Note that the rapidly expanding call and contact centres, business processing outsourcing and other ICT-based services can be considered to fall under professional, scientific and technical services, administration and support services activities, and information and communication.32 These
are the three subsectors that have had the highest employment growth over the historical period, and which are forecasted to continue to have high employment growth over the forecast period. The education sub-sector is also projected to have a high employment growth rate (average of 4.8 per cent and 4.2 per cent annually) over the forecast period.
' + + 3
) 4 &! D 4 !
; ! 6 ; ! 0
&! ! @ !
? @ !
?
% ! C
% ! ?
4 # ?
2! , @ &
@ !
? ! @ ! @ !
?
2 / ? ! < D
C !0 @ @ ! 0
#
@ ) !*
?
?! , # ! ! !
A ! @ ! ? & 3
Source: PEPM 2012
" = 3 + 3
0 200 400 600 800 1000 1200 1400
2000 2005 2010 2015
Wholesale and Retail Trade; Repair of Motor Vehicles and Motorcycles
0 100 200 300 400 500 600 700
2000 2005 2010 2015
Transportation and Storage
0 100 200 300 400 500 600 700 800
2000 2005 2010 2015
Accomodation and Food Service Activities
0 200 400 600 800 1000 1200 1400 1600
2000 2005 2010 2015
Information and Communication
0 200 400 600 800 1000
2000 2005 2010 2015
Financial and Insurance Activities
0 1000 2000 3000 4000 5000 6000
2000 2005 2010 2015
Real Estate Activities
" # % 0 200 400 600 800 1000 1200
2000 2005 2010 2015
Professional, Scientific and Technical Services 0 100 200 300 400 500
2000 2005 2010 2015
Administrative and Support Service Activities 0 100 200 300 400 500
2000 2005 2010 2015
Public Administration and Defense; Compulsory Social Security
0 200 400 600 800 1000 1200
2000 2005 2010 2015
Arts, Entertainment and recreation
0 50 100 150 200 250 300 350
2000 2005 2010 2015
Education 0 200 400 600 800 1000 1200 1400
2000 2005 2010 2015
Human Health and Social Work Activities
0 100 200 300 400
2000 2005 2010 2015
Other Service Activities
Output (bil. 2000 PHP)
Industry projections, employment growth and employment quality
From a policy perspective, it is important to know which industry sectors have the highest employment generation potential in the medium-term. The PEPM results suggest that most of the Philippines’ medium term employment growth will be in the services sector, and the deindustrialization of the past decade will continue. Seven out of the top ten sub-sectors with the highest employment growth rates over the 2010-2016 period are services sub-sectors; while the remaining three are industry sub-sectors, specifically, mining; manufacturing of wood and paper products, printing and publishing; and water supply, sewerage, waste management and remediation (figure 11).
The services sub-sectors with high projected employment growth rates are sub-sectors with relatively high labour productivity and a higher prevalence of decent work opportunities. In particular, among the top sectors with high employment growth rates are services subsectors associated with BPOs and ICT services, such as professional, scientific and technical services; administrative and support services activities; and information and communication. BPOs, ICT services and related knowledge-based services rank high among the government’s priority areas in terms of both investment and export promotion, as listed in the 2011 Investment Priorities Plan (IPP, see OPP, 2011) and the Philippines Export Development Plan 2011-2013 (PEDP, see DTI, 2011).
" (3 " + " : * #$%
Source: PEPM 2012
" ' + " : * # * %
0 200 400 600 800 1,000 1,200 1,400 1,600 1,800
Wholesale & Retail Trade; Repair of Motor Vehicles & …
Agriculture, Forestry and Fishing
Transportation and Storage
Education
Public Admin. & Defense; Compulsory Social Security
Administrative and Support Service Activities
Construction
Accomodation and Food Service Activities
Manuf. of Wood & Paper Products, Printing & Publishing
Manuf. of Food Products, Beverages, & Tobacco Products
Source: PEPM 2012
By 2016, the wholesale and retail trade sector is projected to employ nearly 1.7 million additional workers, and the agriculture, forestry and fisheries sector is projected to employ approximately 900 thousand additional workers. Another half a million additional workers are projected to be employed in transportation and storage.
The public sector is projected to employ a large number of workers. Specifically, more than 370 thousand additional workers would be employed in public administration, defense and compulsory social security. More than 370 additional workers are also expected to be employed in education, in both private and public sectors.
More than 350 thousand additional workers are expected to be employed in administrative and support service activities, and another 340 thousand additional workers are expected to be employed in construction. The accommodation and food services activities sub-sector, which is often associated with tourism, is projected to employ nearly 240 thousand additional workers by 2016. The government’s policies to actively promote tourism (with a target of doubling the annual number of tourist arrivals to 6 million by 2016)33 would therefore support growth in the hotel and restaurants industry, as well as in transportation, arts, recreation and entertainment, and other services.
> : - 0 9' 0 ?
- 9' ? # 6 /@A +% ? # 6 @A +%
-9' "
? # 6 /@A +% "
? # 6 @A +% "
Note: This table shows pairwise correlations between the four variables for all PEPM 2012 sectors over the historical period 2001-2010.
Two manufacturing sub-sectors are among the top 10 sub-sectors in terms of number of additional jobs: wood and paper products, printing and publishing, as well as food products, beverages and tobacco products.
Which sectors or sub-sectors are projected to absorb the largest share of the growing workforce is an important policy consideration. More decent work opportunities are needed to reduce poverty incidence and improve living standards. In general, sectors with higher labour productivity tend to have lower vulnerable employment and poverty rates. As shown in table 13, labour productivity negatively correlates with vulnerable employment and working poverty, while the latter two variables are positively correlated.
" - 9' + 0
0 2 0 4 0 6 0 8 0 V u ln e ra b le e m p lo y m e n t ra te ( % )
0 2000 4000 6000 8000 Labour productivity (thous. PHP per worker)
" , 9' ? + 0
0 2 0 4 0 6 0 8 0 W o rk in g p o v e rt y r a te ( 2 .0 0 $ /d a y , % )
0 20 40 60 80
Vulnerable employment rate (%)
*Note: Blue dots (outliers) in graphs 7 and 8 represent the Real Estate industry, where own-account workers have high labour productivity and high income.
Source: PEPM 2012
" / - ? 0 ? 0 + 0
0 2 0 4 0 6 0 8 0
0 2000 4000 6000 8000
Labour productivity (thous. PHP per worker)
1.25 $/day, % 2.00 $/day, %
The correlations between labour productivity, vulnerable employment and working poverty are also illustrated in figures 13, 14 and 15. These graphs show that, with the exception of the Real Estate industry, lower levels of labour productivity are associated with higher vulnerable employment rates, which in turn are associated with higher poverty rates. The Real Estate sector is somewhat different as many agents, classified as own-account workers, have high productivity and revenues.