Summary We examined the extent of osmotic adjustment and the changes in relative water content (RWC) and transpi-ration rate (i.e., relative stomatal function) that occur in water-deficit-conditioned 6-year-old Thuja occidentalis L. (eastern white cedar) trees in response to a severe drought. Trees con-ditioned by successive cycles of mild or moderate nonlethal water stress (conditioning) and nonconditioned trees were exposed to drought (i.e., −2.0 MPa predawn water potential) to determine if water deficit conditioning enhanced tolerance to further drought stress. Following drought, all trees were well watered for 11 days to evaluate how quickly osmotic potential, RWC and transpiration rate returned to preconditioning values. Both nonconditioned trees and mildly conditioned trees exhibited similar responses to drought, whereas moderately conditioned trees maintained higher water potentials and tran-spiration rates were 38% lower. Both conditioned and noncon-ditioned trees exhibited a similar degree of osmotic adjustment (−0.39 MPa) in response to drought relative to the well-wa-tered control trees. The well-wawell-wa-tered control trees, noncondi-tioned trees and mildly condinoncondi-tioned trees had similar leaf RWCs that were about 3% lower than those of the moderately conditioned trees.
Following the 11-day stress relief, there were no significant differences in osmotic potential between the well-watered con-trol trees and any of the drought-treated trees. Daily transpira-tion rates and water potential integrals (WPI) of all drought-treated trees approached those of the well-watered control trees during the stress relief period. However, the relationship between cumulative transpiration and WPI showed that previous exposure to drought stress reduced tran-spiration rates. Leaf RWC of the moderately conditioned trees remained slightly higher than that of the nonconditioned and mildly conditioned trees.
Keywords: drought stress, osmotic adjustment, transpiration, water potential integral, water relations.
Introduction
Thuja occidentalis L. is found in habitats representing a broad range of soil water contents. Recent studies by Matthes-Sears and Larson (1991) have indicated that T. occidentalis does not exhibit ecotypic differentiation (Habeck 1958, Musselman et
al. 1975). This has led to the suggestion that physiological (biotic variables) rather than genetic influences might explain this species’ broad tolerance to water availability.
There is evidence that T. occidentalis exhibits osmotic ad-justment in response to water deficits (Collier and Boyer 1989, Edwards and Dixon 1995), but available information on the stomatal responses to water deficits is contradictory. Matthes-Sears and Larson (1990) concluded that T. occidentalis may not possess a sensitive stomatal mechanism to water stress, whereas we have found that the stomatal mechanism of T. oc-cidentalis is sensitive to even relatively mild water stress (water potentials greater than −1 MPa).
According to Kramer (1983) and Turner (1986), plants re-spond to drought either by postponing dehydration by main-taining a high plant water potential or by tolerating dehydration by surviving at a low plant water potential. Plants that rely on a mechanism of dehydration postponement, such as increased stomatal resistance, exhibit reduced transpiration rates and maintain a relatively high water potential in response to drought stress. Plants that rely on dehydration tolerance may exhibit osmotic adjustment, which is a mechanism of turgor maintenance that sustains transpiration at low leaf water poten-tials.
The objectives of our investigation were (1) to determine the extent to which conditioning enhanced tolerance to subsequent water stress, and (2) to determine if and how quickly plant responses (i.e., transpiration, RWC and osmotic potential) turned to preconditioning values when water stress was re-lieved.
Materials and methods
Plant material, location, and fertilizer and watering procedures have been described (Edwards and Dixon 1995). Twenty, 6-year-old Thuja occidentalis L. cv. Emerald trees were divided into three groups. The control group, consisting of 10 trees, was watered every 2 to 3 days. The other two groups, each consisting of five trees, were subjected to either five cycles of water deficit stress to a predawn water potential threshold of −0.9 MPa (mild conditioning) or four cycles of water deficit stress to a predawn water potential threshold of −1.4 MPa (moderate conditioning).
The drought treatment began immediately after the trees in
Mechanisms of drought response in
Thuja occidentalis
L. II.
Post-conditioning water stress and stress relief
D. R. EDWARDS and M. A. DIXON
Department of Horticultural Science, University of Guelph, Guelph, Ontario, N1G 2W1, Canada
Received October 25, 1993
the moderate conditioning treatment had received their fourth and final conditioning cycle (Day 256). The control group was divided into two groups of five trees; one group was well watered every 2 or 3 days (well-watered control) and the other group (nonconditioned control) along with the mildly and moderately conditioned trees were exposed to a severe drought for 9 days. The drought episode was ended when an average predawn water potential (Ψpd) of approximately −2.0 MPa was reached by the nonconditioned group of trees (the first group to reach this threshold). Immediately following drought, all trees were watered every 2 or 3 days for 11 days (stress relief phase). Environmental conditions for the study were similar to those detailed in the accompanying paper (Edwards and Dixon 1995). Leaf osmotic potential and RWC were sampled at the end of the drought and stress relief phases. Transpiration and water potential measurements were made continuously. The measurement procedures have been described in detail in the accompanying paper (Edwards and Dixon 1995).
Osmotic potential and RWC
Osmotic potential at full turgor was measured on freeze dis-rupted leaf tissue using in situ stem psychrometers in a calibra-tion configuracalibra-tion (Edwards and Dixon 1995). Osmotic potential (OP) data were expressed as osmotic potential differ-ence (OPD = OP of stressed trees − OP of control).
Relative water content was measured on the same leaf tissue as osmotic potential as described in the accompanying paper (Edwards and Dixon 1995).
Gravimetric determination of transpiration
Transpiration rates were determined by weighing the potted trees as described in the accompanying paper (Edwards and Dixon 1995). Transpiration for either a drought episode or stress relief phase was calculated by subtracting the weight at the end of the cycle (at 1800 h) from the free-drainage weight determined at the beginning of the cycle (2100 h). Daily transpiration was calculated by determining the amount of water transpired per hour and summing these values for a day. Cumulative transpiration (CT) was calculated by determining the amount of water transpired per hour and summing these values for the drought episode or stress relief phase.
Data analysis
The trees were arranged on two benches in a completely randomized design. Statistical analysis was carried out with SAS statistical software (Cary, North Carolina). Protected LSD (least significant differences) was used to determine treatment differences for OPD, RWC, daily transpiration and WPI.
Cumulative transpiration was regressed on WPI for the drought episode and stress relief phase. The regression models used for the drought episode data were: CT = βo + β1(WPI) (where β0 is the intercept and β1 is the coefficient) for the control (864 data points per equation, R2 = 0.99) and CT = βo + β1 ln(WPI) for all stressed groups (864 data points per equation, R2 = 0.95--0.97). A logarithmic equation was chosen
because transpiration displayed an asymptotic response to WPI. In the stress relief phase, all groups were fitted with linear equations, CT = βo + β1(WPI) (952 data points per equation, R2 = 0.98). Statistical LSD tests were performed on the resulting coefficient (β1) among the groups when their equations were compatible (i.e., β1 from linear and logarithm equations could not be tested together).
Results
Postconditioning drought stress
All trees subjected to drought exhibited significantly lower WPIs and transpiration rates than the well-watered controls. There were no significant differences in WPI (−224 to −230 MPa h) among any of the drought-treated trees. The effects of the severe drought on mean transpiration rates of noncondi-tioned trees (14.78 ± 0.76 g g−1) and mildly conditioned trees (14.32 ± 1.17 g g−1) were not significantly different. However, trees in both of these treatments exhibited significantly greater transpiration rates (P = 0.0001) in response to the severe drought than moderately conditioned trees (11.5 ± 0.27 g g−1). The transpiration rate and WPI of well-watered control trees were 25.6 ± 1.4 g g−1 and −109.8 ± 2.3 MPa h, respectively.
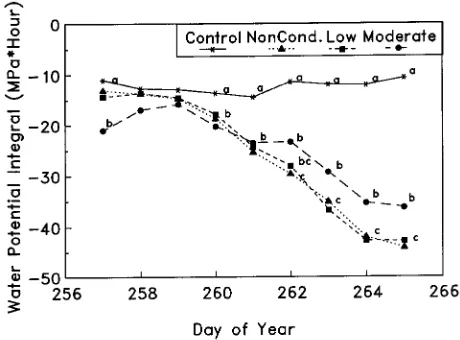
Plots of daily WPI indicated that toward the end of the severe drought episode, moderately conditioned trees exhibited sig-nificantly less water stress than nonconditioned and mildly conditioned trees (Figure 1). Daily transpiration rates gener-ally declined in conditioned trees with duration of the severe drought episode (Figure 2). For the first 2 days of the severe drought, moderately conditioned trees had significantly lower transpiration rates relative to nonconditioned and mildly con-ditioned trees. Thereafter, transpiration rates among noncondi-tioned and condinoncondi-tioned trees were similar (Figure 2). The low transpiration rate of the well-watered controls on Day 262 was due to the influence of ambient environmental conditions
por pressure of 0.25 kPa versus an average of 0.98 kPa for the severe drought episode).
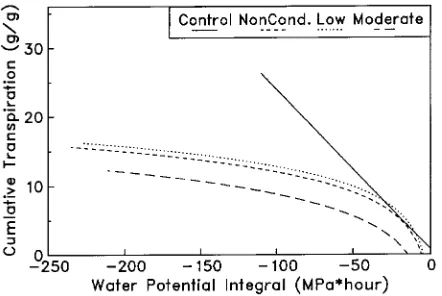
The relationship between CT and WPI was linear for the well-watered controls and curvilinear for all trees subjected to severe drought (Figure 3). There was a tendency for moder-ately conditioned trees to exhibit a lower transpiration rate as the severe drought progressed (i.e., lower transpiration rate per unit of WPI).
There were no significant differences (P = 0.70) in OPD among the trees subjected to the severe drought. Leaf RWC of well-watered control trees and moderately conditioned trees were similar (0.933 ± 0.001 and 0.926 ± 0.004, respectively). These values were significantly higher (P = 0.0001) than those of nonconditioned trees (0.892 ± 0.008) and mildly condi-tioned trees (0.903 ± 0.005).
Stress relief
During the 11-day period of stress relief, WPI and transpiration were significantly lower (P = 0.0006) in trees that had been subjected to severe drought than in well-watered control trees. There were no significant differences in WPI and transpiration rates among the drought-stressed trees during the stress relief period. Values for WPI ranged from −160 to −176 MPa h and transpiration rates ranged from 25.6 to 27.7 g g−1 for the drought-stressed trees compared with values of −133.2 ± 4.5 MPa h and 35.24 ± 1.55 g g−1 for the well-watered controls for the same period.
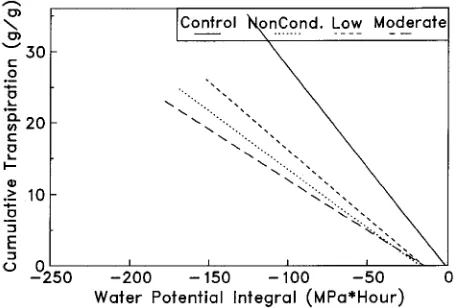
In all drought-stressed trees, WPI and transpiration gradu-ally recovered during the stress relief period (Figures 4 and 5), but the relationship between CT and WPI changed (Figure 6). Nonconditioned and conditioned trees transpired significantly (β1, P = 0.001) less water per unit of plant water stress than the well-watered control trees. The mean β1 coefficient for the
Figure 2. Daily transpiration for trees in the postconditioning drought episode. Each symbol is the mean of five trees. Symbols within dates with no letters are not significantly different at α = 0.05. Standard error values ranged from 0.1 to 0.4.
Figure 3. The relationship between cumulative transpiration (grams of water per gram of leaf dry weight) and hourly water potential integral (MPa h) during the postconditioning drought episode. Each line is the result of regression, performed on 2592 data points, and for all regres-sion equations, β0 and β1 are significant at P = 0.0001. Equations are
as follows: Control (no stress), CT = 0.778 − 0.2347(WPI), R2 = 0.92; Nonconditioned, CT = −7.5194 + 4.2401 ln(WPI), R2 = 0.78; Low stress, CT = −6.4335 + 4.1740 ln(WPI), R2 = 0.87; Moderate stress, CT = −12.4293 + 4.6141 ln(WPI), R2 = 0.93.
Figure 4. Hourly water potential integral totaled daily for trees during the stress relief phase. Each symbol is the mean of five trees. Symbols within dates with no letters are not significantly different at α = 0.05. Standard error values ranged from 0.24 to 0.78.
control was −0.30, whereas the corresponding values for the nonconditioned trees and the mildly and moderately condi-tioned trees were −0.17, −0.19 and −0.14, respectively (LSD = 0.055).
There were no significant differences (P = 0.15) in osmotic potential among any of the drought-treated trees during the stress relief period. Values for OPD were −0.03 ± 0.01, −0.06 ± 0.03 and −0.03 ± 0.02 MPa for the nonconditioned trees and the mildly and moderately conditioned trees, respectively (OP of −1.28 to −1.34 MPa). Leaf RWC of the well-watered control trees, nonconditioned trees and mildly conditioned trees were similar (0.919 ± 0.002, 0.929 ± 0.009 and 0.920 ± 0.007, respectively), whereas leaf RWC of moderately conditioned trees was significantly higher (0.937 ± 0.004; P = 0.04) than those of the well-watered control trees and nonconditioned trees.
Discussion
Postconditioning drought episode
The degree of osmotic adjustment was similar in noncondi-tioned and condinoncondi-tioned trees. Therefore, repeated conditioning by either mild or moderate nonlethal drought did not influence the capacity of T. occidentalis to adjust osmotically in response to subsequent drought. These findings contrast with those of Zwiazek and Blake (1989) who found that conditioned Picea mariana (Mill) BSP. had lower osmotic potentials than non-conditioned trees. This difference may reflect species-depend-ent adaptation.
Moderate conditioning (i.e., Ψpd = −1.4 MPa) caused an increase in tolerance or resistance to subsequent drought, whereas the responses of RWC, WPI and transpiration to
drought in mildly conditioned trees were similar to those in nonconditioned trees. Moderately conditioned trees had higher leaf RWC and often higher daily WPI and lower transpiration rates during the severe drought period than nonconditioned and mildly conditioned trees.
Water potential integral and transpiration totaled for the entire drought episode were less informative than the daily changes in these parameters. For example, early in the drought episode, transpiration of the moderately conditioned trees was about 40% less than that of the nonconditioned trees and mildly conditioned trees, but in the later stages of the drought (Day 262), the transpiration rate was similar among the three treatments (Figure 2). The early decrease in transpiration rate can be attributed to recovery from the conditioning phase of the experiment. Water potential integral totaled for the drought episode was similar among all drought-treated trees. However, the daily plots of WPI indicated that the moderately condi-tioned trees exhibited significantly less stress during the latter stages of the drought than the nonconditioned and mildly conditioned trees, possibly indicating enhanced drought toler-ance.
The higher WPI of the moderately conditioned trees contrib-uted to less severe internal water deficits and thus a higher leaf RWC compared with the nonconditioned trees and mildly conditioned trees. Zwiazek and Blake (1989) reported that stomata of conditioned P. mariana seedlings closed earlier and more completely when exposed to drought stress than the stomata of nonconditioned seedlings, and the early stomatal closure resulted in conditioned seedlings having lower transpi-ration rates and higher water potentials (cf. Seiler and Johnson 1985, 1988).
Responses to a period of stress relief
Both conditioned and nonconditioned trees had lower WPI and transpiration rates than the well-watered control trees when totaled for the entire stress relief period. However, analyses of daily WPI and transpiration rates indicated that recovery oc-curred in about 5 days and, although often not significant, drought-stressed trees always had lower WPI and transpiration rates than the well-watered control trees for the remainder of the drought episode. Decreased transpiration rates in condi-tioned trees after a stress relief phase has also been observed in Pinus taeda L. (Bongarten and Teskey 1986, Teskey et al. 1987). Buxton et al. (1985) reported that evaporative losses by Picea glauca (Moench) Voss., P. mariana and Pinus banksiana Lamb. conditioned in −0.4 and −0.8 MPa polyethylene glycol (PEG) solutions returned to their original rates when returned to control solutions. However, transpiration rates of trees ex-posed to −1.2 and −1.6 MPa PEG solutions showed no signs of recovery 72 h after stress relief (Buxton et al. 1985). Noncon-ditioned trees (exposed to only one episode of water stress) exhibited similar responses in terms of transpiration rates and WPI to the conditioned trees, indicating that even a single exposure to stress caused a change in stomatal functioning. Evaluation of the relationship between CT and WPI during the stress relief phase also indicated that there was a carryover response to drought stress.
Figure 6. The relationship between cumulative transpiration (CT, grams of water per gram of leaf dry weight) and hourly water potential integral (MPa h) for the stress relief period. Each line represents a regression of CT on WPI performed on 2856 data points, and for all regression equations, β0 and β1 are significant at P = 0.001 except were
noted. Equations are as follows: Control (no stress), CT = −0.4268 − 0.2827 (WPI), R2 = 0.91 (β0 not significant); Low stress, CT = −2.8790
− 0.1909 (WPI), R2 = 0.95; Nonconditioned, CT = −2.8149 − 0.1631
Following stress relief, the osmotic potential of all drought-treated trees was similar to that of the well-watered control trees. Others have also noted that accumulated solutes dissi-pate quickly when drought stress is relieved, sometimes within 3 days (Kramer 1983 and Morgan 1984, Blake et al. 1991). Plants that rely on osmotic adjustment as a drought tolerance mechanism must maintain solutes during periods of high water for the next drought (Morgan 1984).
The moderately conditioned trees exhibited a higher leaf RWC in response to the drought stress than the nonconditioned and mildly conditioned trees. The higher leaf RWC of the moderately conditioned trees could be a result of decreased transpiration rates during the drought episode.
Conclusions
The mechanisms of response to drought in T. occidentalis were manifest in both short-term and long-term components that were influenced by the severity and duration of the water stress. In the short term, a relatively modest osmotic adjust-ment occurred as a result of a combination of active solute accumulation and passive solute concentration, which did not appear to influence transpiration significantly via turgor main-tenance. Osmotic adjustment was initiated by as little as a single drought episode and was completely eliminated follow-ing relief of water stress. We conclude that the role of osmotic adjustment in this species is to help maintain turgor during transient midday water deficits in the early stages of drought (Ranney et al. 1991). In the long term, stomatal function was influenced by drought stress resulting in reduced transpiration and hence maintenance of leaf tissue hydration. That is, T. oc-cidentalis is a species that tolerates drought by postponing water stress. Drought-induced inhibition of transpiration per-sisted following relief of water stress, suggesting that mecha-nisms associated with hormone (ABA) accumulation (Zwiazek and Blake 1989) or modification of leaf cell wall properties (e.g., elastic modulus) (Levitt 1986, Blake et al. 1991) are involved in the drought response of this species.
Acknowledgments
The authors gratefully acknowledge the technical assistance of Mr. Jamie Lawson and funding from the Natural Sciences and Engineering Research Council of Canada.
References
Blake, T.J., E. Bevilacqua and J.J. Zwiazek. 1991. Effects of repeated stress on turgor pressure and cell elasticity changes in black spruce seedlings. Can. J. For. Res. 21:1329--1333.
Bongarten, B.C. and R.O. Teskey. 1986. Water relations of loblolly pine seedlings from diverse geographic origins. Tree Physiol. 1:265--276.
Buxton, G.F., D.R. Cyr, E.B. Dumbroff and D.P. Webb. 1985. Physi-ological responses of three northern conifers to rapid and slow induction of moisture stress. Can. J. Bot. 63:1171--1176.
Collier, D.E. and M.G. Boyer. 1989. The water relations of Thuja occidentalis L. from two sites of contrasting moisture availability. Bot. Gaz. 150:445--448.
Edwards, D.R. and M.A. Dixon. 1995. Investigating mechanisms of response to drought in Thuja occidentalis L. I. Water stress condi-tioning and osmotic adjustment. Tree Physiol. 15:121--127. Habeck, J.R. 1958. White cedar ecotypes in Wisconsin. Ecology
39:457--463.
Kramer, P.J. 1983. Water relations of plants. Academic Press Inc., New York, 489 p.
Levitt, J. 1986. Recovery of turgor by wilted, excised cabbage leaves in the absence of water uptake. Plant Physiol. 82:147--153. Matthes-Sears, U. and D.W. Larson. 1990. Environmental controls of
carbon uptake in two woody species with contrasting distributions at the edge of cliffs. Can. J. Bot. 68:2371--2380.
Matthes-Sears, U. and D.W. Larson. 1991. Growth and physiology of
Thuja occidentalis L. from cliffs and swamps: is variation habitat or site specific? Bot. Gaz. 152:500--508.
Morgan, J.M. 1984. Osmoregulation and water stress in higher plants. Annu. Rev. Plant Physiol. 35:299--319.
Musselman, R.C., D.T. Lester and M.S. Abrams. 1975. Localized ecotypes of Thuja occidentalis L. in Wisconsin. Ecology 56:647--655.
Ranney, T.G., R.E. Bir and W.A. Skroch. 1991. Comparative drought resistance among six species of birch (Betula): influence of mild water stress on water relations and leaf gas exchange. Tree Physiol. 8:351--360.
Seiler, J.R. and J.D. Johnson. 1985. Photosynthesis and transpiration of loblolly pine seedlings as influenced by moisture-stress condi-tioning. For. Sci. 31:742--749.
Seiler, J.R. and J.D. Johnson. 1988. Physiological and morphological responses of three half-sib families of loblolly pine to water stress conditioning. For. Sci. 34:487--495.
Teskey, R.O., B.C. Bongarten, B.M. Cregg, P.M. Dougherty and T.C. Hennessey. 1987. Physiology and genetics of tree growth response to moisture and temperature stress: an examination of the charac-teristics of loblolly pine (Pinus taeda L.). Tree Physiol. 3:41--61. Turner, N.C. 1986. Adaptation to water deficits: a changing
perspec-tive. Aust. J. Plant Physiol. 10:175--190.