Summary We measured seasonal and canopy-level gas ex-change in two stands of jack pine (Pinus banksiana Lamb.) and one stand of black spruce (Picea mariana (Mill.) B.S.P.) on relatively clear days from late May until mid-September 1994. Field measurements were made with a portable infrared gas analyzer, and laboratory measurements included photosyn-thetic oxygen evolution and needle chemical composition. Seasonally averaged light-saturated assimilation rates in the field were 4.0 µmol m−2 s−1 in jack pine and 2.7 µmol m−2 s−1 in black spruce. Rates of assimilation and transpiration were highest in midsummer. The seasonal pattern was especially pronounced for black spruce, probably because cold soil tem-peratures limited early season gas exchange rates in this spe-cies. Among stands, instantaneous water-use efficiency was highest in a young jack pine stand early in the season and higher in the upper canopy foliage than in the lower canopy foliage at all sites at the end of the season. Needles of young jack pine exhibited higher photosynthetic capacity, dark respiration and needle N concentrations than needles of trees at the old site. In both species, slight acclimation to shading was manifested by reductions in photosynthetic capacity in the lower canopy foliage. In both species, first-year needles had greater photo-synthetic capacity than older needles but in situ rates of CO2 assimilation in the field showed little difference among needle age classes. In both species, there was a strong correlation between assimilation and stomatal conductance, indicating that assimilation was highly stomatal limited and that environ-mental factors that alter conductance (e.g., VPD) have a strong influence on CO2 and water fluxes, especially after early season thawing concludes.
Keywords: black spruce, boreal forest, BOREAS, canopy posi-tion, jack pine, photosynthesis, shade acclimation.
Introduction
Boreal forests of the northern hemisphere comprise the second largest terrestrial biome in the world and the largest biome in North America (Larsen 1980). In North America, these forests, which are dominated by coniferous species, cover approxi-mately 28% of the continent north of Mexico (Johnson et al.
1995). Low species diversity and frequent disturbance by fire, and more recently by logging, has led to the formation of a patchy mosaic of nearly even-aged stands that tend to be dominated by single species (Elliot-Fiske 1987).
The dominant conifers of the region are jack pine (Pinus banksiana Lamb.) and black spruce (Picea mariana (Mill.) B.S.P.) with white spruce (P. glauca (Moench) Voss) also dominant in some areas. Jack pine dominates the upland re-gions along with quaking aspen (Populus tremuloides Michx.), whereas black spruce frequently dominates low lying or poorly drained areas. Other mixed wood stands may contain the above species along with balsam fir (Abies balsamea (L.) Mill., tamarack (Larix laricina (Du Roi) K. Koch), balsam poplar (Populus balsamifera L.) and others.
Variations in soil water content, soil type, elevation, and other environmental factors along with disturbance history determine which species will dominate a given site (Dix and Swan 1971). For example, jack pine and quaking aspen stands tend to segregate along soil type and moisture gradients with aspen generally favoring sites on loamy soil with intermediate soil water contents, whereas jack pine favors drier and more sandy sites (Mugasha 1986).
Boreal forests may contribute significantly to global carbon and water fluxes (Tans et al. 1990). Moreover, they may also be particularly sensitive to alterations in temperature and water availability that could arise from changes in atmospheric trace gases (Harrington 1987, Schlesinger and Mitchell 1987). In-creases in atmospheric trace gases such as carbon dioxide, chlorofluorocarbons, methane, nitrous oxides and tropo-spheric ozone have been well documented and may produce global effects on Earth’s ozone layer and climate (WMO 1986, Hansen et al. 1988). Therefore, the Boreal Ecosystem--Atmos-phere Study (BOREAS) was initiated to improve our under-standing of the exchange of radiative energy, sensible heat, water and trace gases between the boreal forest and the lower atmosphere (Sellers et al. 1995). An important objective of the BOREAS investigation is to obtain sufficient data to improve computer simulation models of the processes controlling gas exchanges between the atmosphere and the biota, and to assess how these might be altered by global climate change (e.g.,
Variability in leaf-level CO
2
and water fluxes in
Pinus banksiana
and
Picea mariana
in Saskatchewan
JOE H. SULLIVAN,
1BRIAN D. BOVARD
2and ELIZABETH M. MIDDLETON
3 1Department of Natural Resource Sciences and Landscape Architecture, University of Maryland, College Park, MD 20742, USA 2
Department of Botany, Duke University, Durham, NC 27708, USA
3 Laboratory for Terrestrial Physics, National Aeronautics and Space Agency, Greenbelt, MD 20771, USA
Received October 21, 1996
Sellers et al. 1995). To achieve this goal, substantial descriptive and process-level data on key plant species are required.
One may hypothesize that the role each community type plays in regional CO2 or H2O flux is variable because of the variation in site characteristics and species composition. How-ever, few in situ studies have been conducted to test this hypothesis. It is also not well known whether intrinsic differ-ences among species or environmental conditions are primar-ily responsible for the regulation of gas fluxes. Therefore, understanding the seasonal and interspecific variation in leaf-level fluxes of CO2 and H2O and the controls exerted by the environment is an important component of the BOREAS pro-gram. The objectives of this study were to determine whether seasonal leaf-level gas exchange characteristics differed among the Pinus banksiana and Picea mariana sites and to assess the factors that control intraspecific variability of gas exchange at these sites.
Materials and methods
Study sites
Our study sites were located within the area defined by BOREAS as the southern study area (SSA), an area of approxi-mately 11,170 km2, located about 40 km north of Prince Albert, Saskatchewan, centered at approximately 54° N lati-tude and 105° W longitude. The study was conducted at one Picea mariana and two Pinus banksiana sites.
The Picea mariana (old black spruce or OBS) site, located at 53.85° N and 105.12° W, consists primarily of a Picea mariana overstory (up to 12 m tall and 155 years of age) with some tamarack and Pinus banksiana present. Stem densities in the upper and lower strata are approximately 4330 and 3710 live stems ha−1, respectively, with basal areas of 30 and 10 m2 ha−1 (Sellers et al. 1995). Mid-season leaf area index (LAI) is 4.0 (optical estimation) or 6.3 (allometric estimation) (Chen et al. 1997). Brooks et al. (1997) concluded that the large difference between LAI values was associated with the clus-tered nature of the foliage. The site is characterized by poorly drained soil and an organic layer of from 5 to over 100 cm in the low peatland areas.
The Pinus banksiana sites, which were designated as Young Jack Pine (YJP) and Old Jack Pine (OJP), are located at 53.875° N, 104.65° W and 53.916° N, 104.69° W, respectively. Both sites are on sandy well-drained soils with poor water holding capacity and organic layers of 10 to 15 cm. Tree age is approximately 60 to 75 years at the OJP site and 11 to 16 years at the YJP site with canopy heights of up to 15 and 4 m at the OJP and YJP sites, respectively. Stem densities are approxi-mately 1330 and 4056 live stems ha−1 at the OJP and YJP sites, respectively. Mid-season LAI is 2.6 or 2.5 (optical and al-lometric estimations, respectively) at the OJP site, and the corresponding values at the YJP site are 3.1 or 2.8 (Chen et al. 1997). The shrub understory consists primarily of green alder (Alnus crispa Ait. Pursh) at the OJP site and is essentially lacking at the YJP site. Both sites contain ground cover of bearberry, feather mosses and lichens with the later being particularly well developed at the OJP site.
Field measurements
Measurements were made from platform canopy access towers constructed on site by the BOREAS staff at the OBS and OJP sites and from the ground at the YJP site. Data were obtained during three discrete measurement periods (1 to 2 measure-ment days each period) designated by BOREAS as Intensive Field Campaigns (IFCs). These IFCs were selected to measure parameters at bud break (IFC-1 = May 24 to June 12), midsum-mer or peak growing season (IFC-2 = July 26 to August 8) and at the onset of dormancy in autumn (IFC-3 = August 30 to September 15).
In situ gas exchange rates were measured at each site during each IFC with an ADC-IV Portable Photosynthesis System (Analytical Development Corporation, Hoddesdon, U.K.). Fluxes of CO2 and H2O were measured and CO2 assimilation rate (A), transpiration rate (E) and stomatal conductance of water vapor (gs) were calculated, according to the equations of von Caemmerer and Farquhar (1981). Measurements were made on intact branches from both the upper and lower canopy sections of the trees adjacent to the canopy access towers at the OJP and OBS sites and on the young trees present near the flux tower site at the YJP site. For Pinus banksiana, measurements were made on each needle age class present. For Picea mari-ana, the newest age class (1994 needles) was measured alone, whereas the 2- and 3-year-old needles (1992 and 1993 needles) were combined in one measurement, as were the 4-and 5-year-old needles (1990 and 1991 needles). At least eight replicate measurements per IFC, canopy location and age group were made for each species. Measurements were made on trees that were accessible from the canopy access towers (approximately four trees with two upper and two lower branches measured per tree) at the OBS and OJP sites and on the same number of trees for each IFC at the YJP site.
Measurements were made on relatively clear days between 0900 and 1300 h local time. Sampling was stratified across needle age and position to minimize variation due to time of day. All branch tips had been exposed to sunlight for several hours to insure that photosynthetic activation had occurred before the measurements began. Measurements were made at ambient temperature, relative humidity and photosynthetic photon flux density (PPF) when possible. Artificial lighting (12-V quartz halogen lamp) was provided when ambient irra-diance was below 1500 µmol m−2 s−1. Therefore, our values represent ambient light-saturated gas exchange rates. Instanta-neous water-use efficiency (WUE) was calculated as A/E. Gas exchange rates were expressed on a half or hemi-surface leaf area basis standardized for the BOREAS project and obtained by the volume displacement method (cf. Sullivan and Tera-mura 1989).
Laboratory measurements
evolution and photosynthetic pigments and the remaining ma-terial was used for analysis of leaf optical properties (Middle-ton et al. 1997) and N concentration.
To assess potential photosynthetic capacity (Amax) and ap-parent quantum yield (AQY), photosynthetic oxygen evolution was measured on each needle age class collected (generally 3 years for Pinus banksiana and 5 years for Picea mariana) within 24 h after branch samples were excised. Our studies indicated that Amax of the branches was maintained for at least 24 h under the experimental conditions. Photosynthetic oxy-gen evolution was measured at saturating CO2 concentrations (100 mmol mol−1 CO2) with an oxygen electrode (Hansatech Corp., King’s Lynn, U.K.). The temperature of the electrode was maintained by a circulating water bath set at temperatures to approximate maximum air temperature for each IFC (26 °C for IFC-1 and IFC-3 and 28 °C for IFC-2), and maximum PPF was 2175 µmol m−2 s−1 supplied by an LED light source (Hansatech Model LH36 Ultrabright, Hansatech Corp., King’s Lynn, U.K.). To generate the light response curves, PPF was reduced to zero in eight steps, and AQY was computed be-tween 0 and 84 µmol m−2 s−1. Measurements made in the dark were used as estimates of dark respiration rates. Because of instrumentation problems during IFC-1, data are only reported for IFC-2 and IFC-3.
Photosynthetic pigments were extracted with dimethyl sul-foxide (DMSO) from the needles used in the above measure-ments. Absorbances were measured at 470, 640, 648 and 750 nm with a dual beam spectrophotometer (Beckman DU-600 or Perkin-Elmer Lambda 3) and used to calculate chloro-phyll and carotenoid concentrations by the equations of Lichtenthaler (1987) as modified for DMSO by Chappelle and Kim (1992). Chemical analysis of tissue was conducted by the Maryland Soil Testing Laboratory, University of Maryland, with a CHN-600 Elemental Analyzer System (LECO Corp., St. Joseph, MO).
Data were subjected to analysis of variance (ANOVA) to test for main effects of species, site (Pinus banksiana only), IFC, canopy position, needle age and their interactions. Signifi-cantly different means were separated using the Student-New-man-Keouls means separation procedure for multiple means and t-tests for paired measurements using the SAS software package (SAS Institute, Cary, NC, 1985).
Results
Seasonal trends in CO2 and H2O fluxes
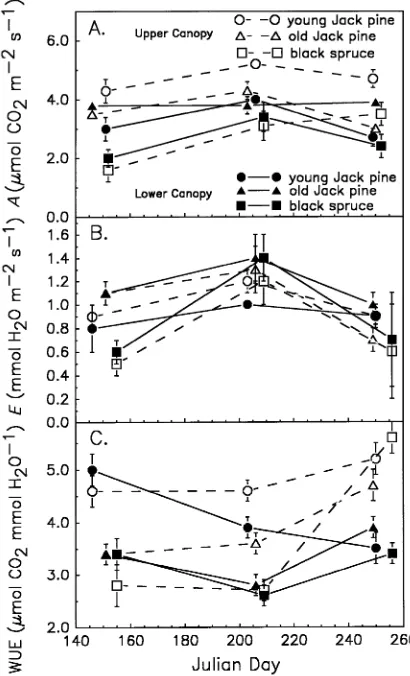
Seasonally averaged assimilation rates (A) were 4.0 and 3.7 µmol m−2
s−1 at the young (YJP) and old (OJP) Pinus bank-siana sites, respectively, and 2.7 µmol m−2 s−1 at the Picea mariana (OBS) site. Assimilation rate was consistently highest in the upper canopy at the YJP site and was lowest during IFC-1 at the OBS site (Figure 1A). Only marginal increases in A were observed during the peak growing season (IFC-2), but transpiration rate (E) of OBS showed a distinct peak at that time (Figure 1B). Transpiration rates differed between species
only during IFC-1 when it was highest at the OJP site, followed by the YJP site and then the OBS site.
Transpiration rate and stomatal conductance (Tables 1--3) were lower during IFC-3 than during IFC-2 and this led to increases in WUE at the final measurement period in all meas-urement groups, with the exception of the lower canopy foliage of young Pinus banksiana, where WUE decreased throughout the season (Figure 1C). At all three sites, instantaneous WUE was higher in the upper canopy foliage than in the lower canopy foliage.
Photosynthetic capacity (Amax) did not differ between the first and second measurement periods or between Pinus bank-siana and Picea mariana (Figure 2A). However, chlorophyll concentration showed a marked increase in OJP during IFC-2 (Figure 2B) but otherwise remained rather constant at each measurement period within a species or canopy stratum. Foliar N concentrations were similar at each IFC for any given measurement group (Figure 2C), but were higher in the young jack pine stand than in the old jack pine stand (11.1 versus 9.5
Figure 1. (A) Carbon dioxide assimilation rate (A), (B) transpiration rate (E) and (C) water-use efficiency (WUE) in Pinus banksiana and
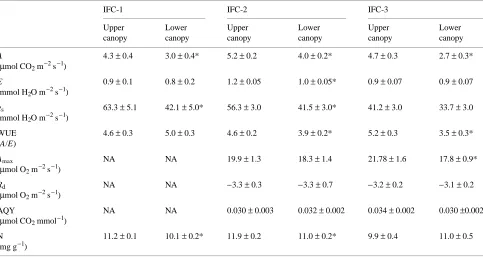
Table 1. Parameters measured for Picea mariana at each field campaign (IFC) of the BOREAS program. Data for A, E, gs and WUE are from field measurements, whereas the remaining data are from laboratory analyses. Values are means ± SE of all needles (all ages combined) measured in the upper and lower canopy at each IFC (n = 24 to 40). An asterisk (*) indicates that one member of a pair of measurements for each IFC differs significantly (P < 0.05) from the other according to t-tests; NA = data not available.
IFC-1 IFC-2 IFC-3
Upper Lower Upper Lower Upper Lower canopy canopy canopy canopy canopy canopy
A 1.6 ± 0.4 2.0 ± 0.3 3.1 ± 0.5 3.4 ± 0.5 3.5 ± 0.4 2.4 ± 0.4* (µmol CO2 m−2 s−1)
E 0.5 ± 0.1 0.6 ± 0.1 1.2 ± 0.2 1.4 ± 0.2 0.6 ± 0.4 0.7 ± 0.4
(mmol H2O m−2 s−1)
gs 27.5 ± 4.7 26.3 ± 3.6 38.2 ± 4.9 32.2 ± 5.3 24.1 ± 2.5 22.3 ± 2.5 (mmol H2O m−2 s−1)
WUE 2.8 ± 0.4 3.4 ± 0.3 2.7 ± 0.2 2.6 ± 0.2 5.6 ± 0.2 3.4 ± 0.2*
(A/E)
Amax NA NA 19.8 ± 1.4 18.4 ± 1.3 19.8 ± 1.6 16.1 ± 1.1* (µmol O2 m−2 s−1)
Rd NA NA −3.7 ± 0.3 −3.6 ± 0.2 −3.2 ± 0.2 −3.4 ± 0.2
(µmol O2 m−2 s−1)
AQY NA NA 0.041 ± 0.003 0.035 ± 0.002 0.033 ± 0.004 0.034 ± 0.01 (µmol CO2 mmol−1)
N 7.70 ± 0.2 7.14 ± 0.3 8.23 ± 0.2 8.65 ± 0.2 7.71 ± 0.4 9.41 ± 0.4* (mg g−1)
Table 2. Parameters measured for Pinus banksiana (Young Jack Pine stand) at each field campaign (IFC) of the BOREAS program. Data for A, E,
gs and WUE are from field measurements, whereas the remaining data are from laboratory analyses. Values are means ± SE of all needles (all ages
combined) measured in the upper and lower canopy at each IFC (n = 24 to 40). An asterisk (*) indicates that one member of a pair of measurements for each IFC differs significantly (P < 0.05) from the other according to t-tests; NA = data not available.
IFC-1 IFC-2 IFC-3
Upper Lower Upper Lower Upper Lower canopy canopy canopy canopy canopy canopy
A 4.3 ± 0.4 3.0 ± 0.4* 5.2 ± 0.2 4.0 ± 0.2* 4.7 ± 0.3 2.7 ± 0.3* (µmol CO2 m−2 s−1)
E 0.9 ± 0.1 0.8 ± 0.2 1.2 ± 0.05 1.0 ± 0.05* 0.9 ± 0.07 0.9 ± 0.07 (mmol H2O m−2 s−1)
gs 63.3 ± 5.1 42.1 ± 5.0* 56.3 ± 3.0 41.5 ± 3.0* 41.2 ± 3.0 33.7 ± 3.0 (mmol H2O m−2 s−1)
WUE 4.6 ± 0.3 5.0 ± 0.3 4.6 ± 0.2 3.9 ± 0.2* 5.2 ± 0.3 3.5 ± 0.3* (A/E)
Amax NA NA 19.9 ± 1.3 18.3 ± 1.4 21.78 ± 1.6 17.8 ± 0.9* (µmol O2 m−2 s−1)
Rd NA NA −3.3 ± 0.3 −3.3 ± 0.7 −3.2 ± 0.2 −3.1 ± 0.2
(µmol O2 m−2 s−1)
AQY NA NA 0.030 ± 0.003 0.032 ± 0.002 0.034 ± 0.002 0.030 ±0.002 (µmol CO2 mmol−1)
mg g−1, respectively). Both of these values were higher than in the Old Black Spruce stand (8.2 mg g−1). Photosynthetic ca-pacity was also higher in the Young Jack Pine stand than in the Old Jack Pine stand (19.4 versus 17.9 µmol m−2 s−1, respec-tively).
Intraspecific variation in CO2 and H2O fluxes
Both species showed differences in photosynthetic charac-teristics that were related to needle age and the position of branches (needles) within the canopy. Photosynthetic capacity was higher in the upper canopy foliage in Picea mariana and young Pinus banksiana at IFC-3 but there was no significant difference in Amax associated with needle position in the can-opy at the old Pinus banksiana site (Figure 2A, Tables 1--3). Chlorophyll concentrations did not differ between canopy strata until IFC-3 when chlorophyll concentrations were higher in the lower foliage than in the upper foliage in OBS and OJP (Figure 2B). Nitrogen concentrations were higher during IFC-1 in the upper foliage of Pinus banksiana but not of Picea mariana (Figure 2C). Dark respiration was higher in the young jack pine stand than in the old jack pine stand (−3.2 versus −2.6 µmol m−2 s−1) but AQY did not differ between species or by location of foliage in the canopy (Tables 1--3).
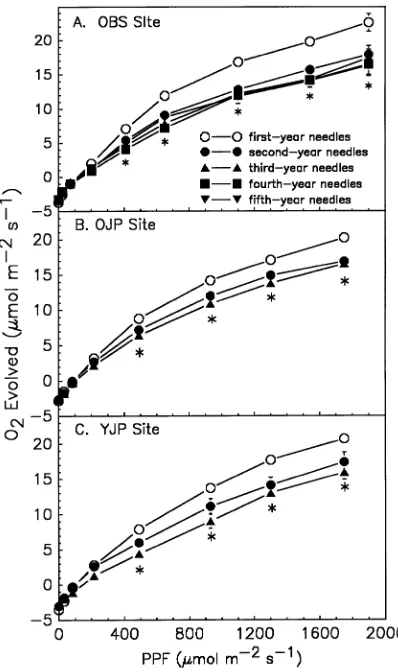
Current-year needles had a higher Amax and higher rates of oxygen evolution at irradiances down to approximately 500 µmol m−2 s−1 than older foliage; however, this effect of needle age was only significant in the lower canopy foliage. Neither dark respiration nor AQY was significantly affected by needle
age (Figure 3). Older needles of both species had similar dark respiration rates and AQY values. Assimilation rates measured in the field were only affected by needle age at the old Pinus banksiana site (Figure 4), and there was also a significant interaction between needle age and IFC at that site (Figure 4B). Assimilation rates were high in 3-year-old needles early in the season (IFC-1) before the new needles had emerged; however, by late season (IFC-3) as senescence approached, A was re-duced in the 3-year-old needles (Figure 4B). In general, values of E and gs did not differ across the age classes of needles sampled and no other needle age by time of year interactions were observed.
Tissue N concentrations did not account for much of the intraspecific variability observed in A (data not shown) or Amax (Figure 5). This was particularly true for Picea mariana where no statistically significant relationship was detected (Figure 5A); however, the relationship was more defined in Pinus banksiana, especially at the OJP site (Figure 5B).
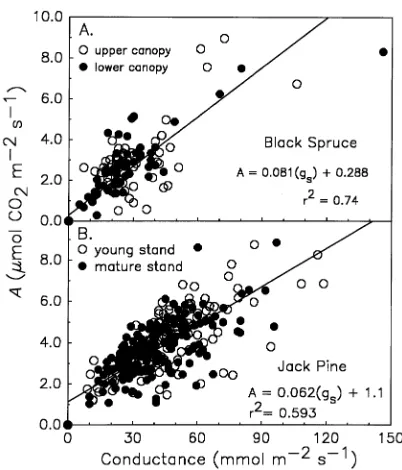
A close correlation was observed between assimilation rate and stomatal conductance in both species. This relationship was consistent among sites, canopy positions and needle age classes, although the slope of the response was slightly greater for Picea mariana than for Pinus banksiana (Figures 6A and 6B). The calculated stomatal limitation to photosynthesis (Amax−A/Amax) was 82 to 85% across season, canopy position and needle ages measured in Picea mariana and 76 to 85% in Pinus banksiana. There were no differences between species or between the two Pinus banksiana sites for this parameter.
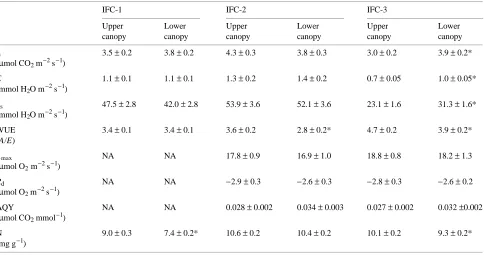
Table 3. Parameters measured for Pinus banksiana (Old Jack Pine stand) at each field campaign (IFC) of the BOREAS program. Data for A, E, gs
and WUE are from field measurements, whereas the remaining data are from laboratory analyses. Values are means ± SE of all needles (all ages combined) measured in the upper and lower canopy at each IFC (n = 24 to 40). An asterisk (*) indicates that one member of a pair of measurements for each IFC differs significantly (P < 0.05) from the other according to t-tests; NA = data not available.
IFC-1 IFC-2 IFC-3
Upper Lower Upper Lower Upper Lower canopy canopy canopy canopy canopy canopy
A 3.5 ± 0.2 3.8 ± 0.2 4.3 ± 0.3 3.8 ± 0.3 3.0 ± 0.2 3.9 ± 0.2* (µmol CO2 m−2 s−1)
E 1.1 ± 0.1 1.1 ± 0.1 1.3 ± 0.2 1.4 ± 0.2 0.7 ± 0.05 1.0 ± 0.05* (mmol H2O m−2 s−1)
gs 47.5 ± 2.8 42.0 ± 2.8 53.9 ± 3.6 52.1 ± 3.6 23.1 ± 1.6 31.3 ± 1.6* (mmol H2O m−2 s−1)
WUE 3.4 ± 0.1 3.4 ± 0.1 3.6 ± 0.2 2.8 ± 0.2* 4.7 ± 0.2 3.9 ± 0.2* (A/E)
Amax NA NA 17.8 ± 0.9 16.9 ± 1.0 18.8 ± 0.8 18.2 ± 1.3
(µmol O2 m−2 s−1)
Rd NA NA −2.9 ± 0.3 −2.6 ± 0.3 −2.8 ± 0.3 −2.6 ± 0.2
(µmol O2 m−2 s−1)
AQY NA NA 0.028 ± 0.002 0.034 ± 0.003 0.027 ± 0.002 0.032 ±0.002 (µmol CO2 mmol−1)
Discussion
Our gas exchange data are consistent with reported values for jack pine and black spruce (e.g., Ceulemans and Sangier 1991, Johnsen et al. 1996) and for similar studies conducted as part of BOREAS (e.g., Brooks et al. 1997). They provide an indi-cation of interspecific, seasonal, temporal (needle age) and positional variability in gas exchange rates and photosynthetic characteristics of these species.
Although Amax was similar in Picea mariana and Pinus banksiana, A was generally higher in Pinus banksiana. Higher values of A have been reported previously in Pinus species compared to Picea species (e.g., Ceulemans and Sangier 1991) and in these species in particular (Brooks et al. 1997). Foliar N concentrations were highest at the YJP site and lowest at the OBS site (cf. Dang et al. 1997a), and these differences were consistent with differences in A and Amax measured at these sites. Nitrogen concentrations have been correlated with net photosynthesis in a variety of species (e.g., Field and Mooney 1986, Evans 1989). Tan and Hogan (1995a, 1995b) also
dem-onstrated that nitrogen deficiency results in reduced net photo-synthesis, perhaps as a result of decreased biochemical and carboxylation capacity and reduced dry matter production.
Trees at the young Pinus banksiana site exhibited higher physiological activity in terms of gas exchange rates (both photosynthetic uptake and respiratory release) than trees of the older stand. Higher productivity was also observed at the Young Jack Pine site compared with the Old Jack Pine site (Sellers et al. 1995, Middleton et al. 1997); therefore, the increased respiration rate of the younger trees appears to be more than offset by increased photosynthetic activity. Yoder et al. (1994) found lower photosynthetic rates in 1-year-old foliage of old compared to young Pinus contorta Dougl. ex Loud. and P. ponderosa Dougl. ex Laws. and they attributed the reduction to a greater stomatal limitation to photosynthesis. They suggested that the reduced assimilation was a result of reduced hydraulic conductivity, as opposed to reduced photo-synthetic capacity in older trees. In our study, the stomatal limitation to photosynthesis did not vary between the young and old stands of Pinus banksiana. We cannot determine from
Figure 2. Oxygen evolution (Amax) (A), total chlorophyll concentra-tion (B) and tissue nitrogen concentraconcentra-tion (C) in Pinus banksiana and
Picea mariana measured during the summer of 1994. Each point is the mean (± SE) of approximately 30 measurements for the upper and lower canopy foliage, averaged across needle ages.
Figure 3. Response of oxygen evolution in the lower canopy foliage of
our data whether differences in water fluxes, Amax or foliar N concentrations are due to tree age itself or to possible differ-ences in water or N availability between the two sites. As data from the entire BOREAS project are compiled, it will be important to partition differences in gas fluxes between stand age and site quality as part of scaling efforts.
Variation in gas flux rates was observed during the season for both Pinus banksiana and Picea mariana. The low initial A in Picea mariana may have been associated with low soil temperatures. DeLucia (1987), Day et al. (1991) and others have demonstrated that, in some conifers, photosynthesis and stomatal conductance are regulated by root temperatures and subsequent stomatal opening. In contrast to the wet and frozen soil at the Picea mariana site during IFC-1, we observed that the soil at both Pinus banksiana sites had already thawed and bud break was initiated earlier at these sites than at the OBS site. Therefore, it was not surprising that net photosynthesis was higher at the jack pine sites than at the black spruce sites, especially during the early season. Higher atmospheric flux rates were also observed at the Pinus banksiana sites than at the Picea mariana site during IFC-1 (Sellers et al. 1995).
Figure 4. Carbon dioxide assimilation rates in Picea mariana (A) and
Pinus banksiana at the OJP site (B) and YJP site (C), measured at three times during the summer of 1994. Each column is the mean ± SE (vertical bars) of approximately 10 measurements. Different letters above a column within a panel indicate that the means are significantly different (P < 0.05).
Figure 5. Relationship between foliar nitrogen content and photosyn-thetic capacity (Amax) in Picea mariana (A) and two sites (OJP--dotted regression line and YJP--solid regression line) of Pinus banksiana (B) measured during the summer of 1994. Each point is the mean (± SE) of approximately eight measurements for each position in the canopy and needle age class measured. Coefficients of variation for linear regression analysis are shown within the plots.
Figure 6. The relationship between CO2 assimilation and stomatal
conductance in Picea mariana (A) and two sites (OJP and YJP) of
Stomatal conductance and E were lower at IFC-3 compared to IFC-2, perhaps because of cooler soils and lower leaf-to-air vapor pressure deficits (VPD). Dang et al. (1997b) have dem-onstrated a strong response of stomata to VPD in these species. In contrast to E and gs, A remained rather constant especially in the upper canopy foliage in IFC-3 compared to IFC-2. There was some evidence that the lower canopy foliage was respond-ing to shadrespond-ing at the end of the season, and this could have contributed to the reductions in A and Amax observed in the lower canopy and to the difference in WUE of the upper and lower canopy foliage observed at IFC-3. In the upper canopy, reduced E and gs were not accompanied by a concurrent reduction in A and this led to an apparent increase in WUE for the well-lit upper canopy needles.
Chen et al. (1997) found that LAI did not increase between IFC-2 and IFC-3 and so it is possible that increased shading may have occurred in the lower canopy as a result of the increased solar angle at that time of the year. Further pieces of evidence for some late-season shade acclimation are the in-crease in total chlorophyll observed in the lower canopy need-les and the observed trend (P < 0.10) of a reduction of the ratio of chlorophyll a to b at IFC-3. Also, the extent of the shade-re-sponse was consistent with the LAI of each site, because LAI was highest at OBS and lowest at OJP, where no shade re-sponses were observed.
Our field data represent maximum assimilation rates for the lower canopy foliage because measurements were made under conditions of saturating PPF. Brooks et al. (1997) found very low assimilation rates and conductance in lower canopy foli-age under shaded conditions. Similar to our findings, they also observed that, in response to supplemental lighting, A in-creased to rates close to those observed in upper canopy foli-age; however, they also found that conductance responded more slowly and did not reach the values found in the upper canopy. Therefore, the potential contribution that lower foliage may make at any given time to overall atmospheric fluxes of CO2 and H2O is similar to that of the upper canopy, but the extent to which this potential is realized will vary with light availability and probably other factors.
Subtle differences in gas fluxes were observed between needle age groups. Variation due to needle age was detected primarily as changes in Amax, rather than in actual field rates of A or E,so that the relative contribution to CO2 and H2O fluxes by each age class that we measured was similar. Among sites, the only differences in gas fluxes found in the field were at the OJP site. There was a steady increase in the photosynthetic contribution of first-year foliage as the season progressed and this was accompanied by a gradual decrease in the contribution of older foliage. However, the contribution to CO2 and H2O fluxes by the five newest needle age classes of Picea mariana and the 1- to 3-year-old foliage of Pinus banksiana, young site, was similar. There were more 4-year-old needles present at the YJP site than at the OJP site and Picea mariana retains needles for approximately 15 years. This greater needle longevity may have contributed to the reduced needle age effects at the YJP and OBS sites.
In addition to evaluating inter- and intraspecific variations in gas exchange characteristics of these species, our objective was to increase our understanding of the mechanisms by which environmental factors regulate gas exchange in these species. Irradiance appears to play a key role as do N concentrations and stomatal regulation. Although tissue N concentrations were related to interspecific and between-site variation in photosynthesis, short-term and intraspecific changes in photo-synthesis were not well correlated with tissue N concentration. This may be because N concentrations were rather constant within a given species and location or because other factors imposed stronger limitations on photosynthesis. Also, vari-ation in N concentrvari-ation on a dry weight basis, as our data are expressed, may not be as tightly coupled to photosynthesis as data expressed on a leaf area basis. Changes in the amount of starch, for example, could alter nitrogen concentration on a dry weight basis but not on an area basis.
In addition to light and N concentration, stomatal regulation may also exert a high degree of control over gas fluxes in these species. The calculated stomatal limitation to photosynthesis was high in both species, 83% in Picea mariana versus 79% in Pinus banksiana. Although these calculations probably rep-resent an overestimate of the stomatal limitation because our ambient rates of assimilation included stem respiration, which may have reduced our measured rates of net assimilation, they are indicative of the strong stomatal control over assimilation found in these species.
The response of A to gs also suggests the importance of water conservation in these species. Although Picea mariana grows in wetter habitats than Pinus banksiana, because the rooting depth of Picea mariana is shallow the species could be more susceptible to seasonal drought than the deeper-rooted Pinus banksiana. Sellers et al. (1995) found that evapotranspiration was quite low from all of the BOREAS study areas, especially the Picea mariana sites. However, although these sites are presumed to be ‘‘wet,’’ Sellers et al. (1995) found that the Picea mariana sites were effectively functioning as arid sites with respect to sensible versus latent heat loss and Bowen ratios. Our physiological data on stomatal activity and H2O flux rates are consistent with these observations.
photosynthetic activity in the spring and down-regulation of such activity in the fall will also aid in understanding seasonal changes in gas fluxes.
Acknowledgments
The authors thank the BOREAS program for partial funding of this research and the BOREAS program staff for providing important logistical support to the project. We also thank Mr. Stephen Chan, Ms. Andrea Duluca and Ms. Takisha Cannon for assistance in the field and laboratory with data collection and analysis.
References
Brooks, J.R., L.B. Flanagan, G.T. Varney and J.H. Ehleringer. 1997. Vertical gradients in photosynthetic gas exchange characteristics and refixation of respired CO2 within boreal forest canopies. Tree
Physiol. 17:1--12.
Ceulemans, R.J. and B. Sangier. 1991. Photosynthesis. In Physiology of Trees. Ed. A.S. Raghavendra. John Wiley and Sons, Inc., New York, pp 21--50.
Chappelle, E.W. and M.S. Kim. 1992. Ratio analysis of reflectance spectra (RARS): An algorithm for the remote estimation of the concentration of chlorophyll a, chlorophyll b and carotenoids in soybean leaves. Remote Sens. Environ. 39:239--247.
Chen, J.M., P.M. Rich, S.T. Gower, J.M. Norman and S. Plummer. 1997. Leaf area index of boreal forests: theory, techniques and measurements. J. Geophys. Res. In press.
Dang, Q.L., H.A. Margolis, M. Sy, M.R. Coyea, G.J. Collatz and C.L. Walthall. 1997a. Profiles of PAR, nitrogen and photosynthetic ca-pacity in the boreal forest: implications for scaling from leaf to canopy. J. Geophys. Res. In press.
Dang, Q.L., H.A. Margolis, M.R. Coyea, M. Sy and G.J. Collatz. 1997b. Regulation of branch-level gas exchange of boreal trees: role of water potential and vapor pressure difference. Tree Physiol. 17:521--535.
Day, T.A., S.A. Heckathorn and E.H. Delucia. 1991. Limitations to photosynthesis in Pinus taeda L. (loblolly pine) at low soil tempera-tures. Plant Physiol. 96:1246--1254.
DeLucia, E.H. 1987. The effects of freezing nights on photosynthesis, stomatal conductance, and internal CO2 concentration in seedlings
of Engelmann spruce (Picea engelmannii Parry). Plant Cell Envi-ron. 10:333--338.
Dix, R.L. and J.M.A. Swan. 1971. The role of disturbance and succes-sion in the upland forest at Candle Lake, Saskatchewan. Can. J. Bot. 49:657--676.
Elliot-Fiske, D.L. 1988. The boreal forest. In North American Terres-trial Vegetation. Eds. M.G. Barbour and W.D. Billings. Cambridge Univeristy Press, New York, pp 33--62.
Evans, J.R. 1989. Photosynthesis and nitrogen relationships in leaves. Oecologia. 78:9--19.
Field, C. and H.A. Mooney. 1986. The photosynthesis--nitrogen rela-tionship in wild plants. In One the Economy of Plant Form and Function. Ed. T.J. Givnish. Cambridge University Press, New York, pp 25--55.
Hansen, J., I. Fung, A. Lacis, D. Rind, S. Lebedeff, R. Ruedy and P. Stone. 1988. Global climate changes as forecast by Goddard Institute for Space Studies three-dimensional model. J. Geophys. Res. 93:9341--9364.
Harrington, J.B. 1987. Climatic change: a review of causes. Can. J. For. Res. 17:1313--1339.
Johnson, D., L. Kershaw, A. MacKinnon and J. Projar. 1995. Plants of the western boreal forest and aspen parkland. Lone Pine Publishing and Canadian Forest Service, Edmonton, AL, 392 p.
Johnsen, K.H., J.R. Seiler and J.E. Major. 1996. Growth, shoot phe-nology and physiology of diverse seed sources of black spruce: II. 23-year-old field trees. Tree Physiol. 16:375--380.
Larsen, J.A. 1980. The boreal ecosystem. Academic Press, New York, 500 p.
Lichtenthaler, K. 1987. Chlorophylls and carotenoids: Pigments of photosynthesis. Methods Enzymol. 148:350--352.
Middleton, E.M., J.H. Sullivan, B.D. Bovard, A.J. Deluca, S.S. Chan and T.A. Cannon. 1997. Seasonal variability in foliar characteristics and physiology for boreal forest species at the five Saskatchewan tower sites during the 1994 Boreal Ecosystem--Atmosphere Study (BOREAS). J. Geophys. Res. In press.
Mugasha, A.G. 1986. Within and between species competition and individual tree growth in young jack pine--aspen stands. M.Sc. Thesis. School of Forestry, Lakehead University, Thunder Bay, ON, 109 p.
Schlesinger, M.E. and J.F.B. Mitchell. 1987. Climate model calcula-tions of the equilibrium climatic responses to increased carbon dioxide. Rev. Geophys. 25:760--798.
Sellers, P.J., F. Hall, H. Margolis, B. Kelly, D. Baldocchi, G. den Hartog, J. Cihlar, M. Ryan, B. Goodison, P. Crill, K.J. Ranson, D. Lettenmaier and D.E. Wickland. 1995. The Boreal Ecosystem--At-mosphere Study (BOREAS): An overview and early results from the 1994 field year. Bull. Amer. Meteorol. Soc. 76:1549--1577. Sullivan, J.H. and A.H. Teramura. 1989. The effects of ultraviolet-B
radiation on loblolly pine. I. Growth, photosynthesis and pigment production in greenhouse-grown seedlings. Physiol. Plant. 77:202--207.
Tan, W. and G.D. Hogan. 1995a. Limitations to net photosynthesis as affected by nitrogen status in jack pine (Pinus banksiana Lamb.) seedlings. J. Exp. Bot. 46:407--413.
Tan, W. and G.D. Hogan. 1995b. Effects of nitrogen limitation on water relations of jack pine (Pinus banksiana Lamb.) seedlings. Plant Cell Environ. 18:757--764.
Tans, P.P., I.Y Fung and T. Takahashi. 1990. Observational constraints on the global atmospheric CO2 budget. Science 247:1431--1438.
von Caemmerer, S. and G.D. Farquhar. 1981. Some relationships between the biochemistry of photosynthesis and the gas exchange of leaves. Planta 153:376--387.
World Meteorological Organization (WMO). 1986. Report of the international conference on the assessment of the role of carbon dioxide and of other greenhouse gases. In Climatic Variations and Associated Impacts, Vilach, Austria. World Climate Programme Report No. 661. WMO, Geneva, Switzerland, 78 p.