Determination of mango physiological indices by
near-infrared spectrometry
Ze’ev Schmilovitch
a, Amos Mizrach
a,*, Aharon Hoffman
a, Haim Egozi
a,
Yoram Fuchs
baInstitute of Agricultural Engineering,A.R.O.,The Volcani Center,P.O. Box 6,Bet Dagan,50250, Israel bInstitute for Technology and Storage of Agricultural Products,A.R.O.,The Volcani Center,P.O. Box 6,Bet Dagan,
50250, Israel
Received 18 September 1999; accepted 2 April 2000
Abstract
The objectives of the study were to evaluate the use of near-infrared (NIR) spectrometry in measuring the physiological properties of mango fruit, cv. ‘Tommy Atkins’ and to establish relationships between the nondestructive NIR spectral measurements and the major physiological properties and quality indices of mango fruit. These include softening of the flesh, total soluble solids content and acidity. Intact mango fruit were measured by reflectance NIR in 1200 – 2400 nm range. NIR models were developed based on multi-linear regression (MLR), principal component analysis (PCA) and partial least square (PLS) regression with respect to the reflectance and its first derivative, the logarithms of the reflectance reciprocal and its second derivative. The above regression models, related the NIR spectra to storage period, firmness, sugar content and acidity. The best combination, based on the prediction results, was MLR models with respect to the second derivative logarithms of the reflectance reciprocal. Predictions with MLR models resulted standard errors of prediction (SEP) of 1.223, 0.161, 17.14 and 37.03, and coefficients of determination of 0.9276, 0.6085, 0.8226 and 0.9380 for TSS, acidity, firmness and storage period, respectively. It was concluded that by using the NIR spectrometry measurement system, in the appropriate spectral range, it is possible to nondestruc-tively assess the maturity factors of mango fruit. © 2000 Elsevier Science B.V. All rights reserved.
Keywords:Near-infrared; Spectrometry; Quality; Nondestructive; Firmness; Sugar; Acidity; Mango
www.elsevier.com/locate/postharvbio
1. Introduction
Mango (Mangifera indicaL.) is a tropical fruit for which there is heavy demand and which
fetches a good price in the world market. To ensure the supply of high-quality fruit, it is impor-tant to select fruit with the proper degree of maturation, which is, however, not defined cate-gorically in the literature. Various scientists have considered maturity from different perspectives (Peacock, 1984). There are no known external or visible changes in mango fruit that could be used * Corresponding author. Tel.:+972-3-9683451; fax:+
972-3-9602704.
E-mail address:[email protected] (A. Mizrach).
for exact determination of maturity; fruit maturity indicators such as color, size and shape provide only an approximate indication (Thangaraj and Irulappan, 1989). However, it is well known that when an immature mango is harvested, it will not ripen properly, if at all. Conversely, an overripe one will decay rapidly after harvest.
The physiology of the mango fruit has been described by various researchers (Fuchs et al., 1980; Brown et al., 1984; Yanko et al., 1984; Peacock et al., 1986; Medlicott et al., 1990). Parameter changes that have shown some useful-ness for determining maturity are softening of the flesh; decreased acidity; increased contents of sug-ars, soluble solids and total solids; and increased
carotenoid pigments (Lakshminarayana, 1980). Tissue firmness is known to be the factor most closely related to the stage of maturity in mango fruit, and it can be gauged manually by a trained person (Peacock et al., 1986), but this method is subjective, has poor repeatability and is limited to advanced stages of maturity. Sugar content and acidity are the properties most likely to match the consumer’s perception of maturity, but they cur-rently require a destructive measurement.
The development of a reliable, nondestructive method for the quality evaluation of mangoes, before harvest and at the packing site, is critical to the success of the mango industry. Few such methods are known from the literature. Mizrach
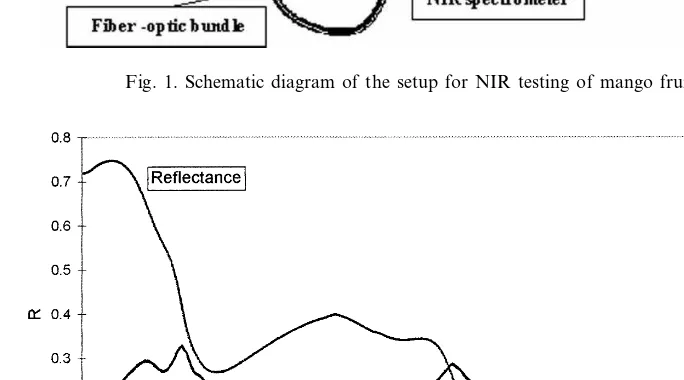
Fig. 1. Schematic diagram of the setup for NIR testing of mango fruit.
Table 1
The results for calibration models of MLR, PCA, and PLS regression methods for the original spectraR, first derivativeD1R,
log (1/R) and its second derivativeD2log (1/R), means values of SEC and the coefficients of determination,r2
Parameter Regression method Statistical parameter Spectrum
R log (1/R) D1R D2log (1/R)
TSS MLR No. of factors 5 4 3 4
SEC 1.49 1.81 1.39 1.24
r2 0.9163 0.8717 0.9003 0.9334
PCA No. of factors 4 4 4 6
SEC 1.65 1.99 1.75 1.63
r2 0.8873 0.8345 0.8776 0.8992
No. of factors 4 4 5 6
PLS
SEC 1.61 1.81 1.34 1.08
r2 0.8935 0.8659 0.9349 0.9501
No. of factors 6
Acidity MLR 9 5 4
SEC 0.15 0.12 0.12 0.11
r2 0.7002 0.8025 0.7905 0.7975
PCA No. of factors 6 6 4 6
SEC 0.16 0.17 0.15 0.15
r2 0.6355 0.608 0.6304 0.6451
PLS No. of factors 6 6 6 6
SEC 0.15 0.15 0.12 0.11
r2 0.6701 0.6693 0.7944 0.8248
No. of factors 4
Firmness MLR 6 6 5
SEC 16.64 18.42 16.24 12.96
r2 0.83041 0.8204 0.8582 0.8799
No. of factors 5 2
PCA 5 5
SEC 17.78 20.64 18.12 20.13
r2 0.817 0.7279 0.8121 0.7695
No. of factors 6 5
PLS 5 6
SEC 16.68 17.92 15.77 14.76
r2 0.8523 0.8165 0.8554 0.887
No. of factors 5
Storage period MLR 7 5 4
SEC 39.02 32.74 27.82 33.71
r2 0.9148 0.9469 0.9485 0.9152
PCA No. of factors 4 6 3 6
SEC 49.16 49.15 41.83 36.62
r2 0.8486 0.8632 0.8907 0.9265
PLS No. of factors 4 6 5 6
SEC 45.62 39.93 30.2 29.09
r2 0.8707 0.9111 0.9485 0.9265
et al. (1996) patented a quality-determining device based on the use of ultrasonic waves excited on the peel and in the flesh of a whole fruit by means of ultrasonic probes in contact with the peel. This nondestructive method was used for the nonde-structive measurement of ultrasonic wave attenua-tion in mango fruit in the time domain (Mizrach et al., 1997) and in the frequency domain
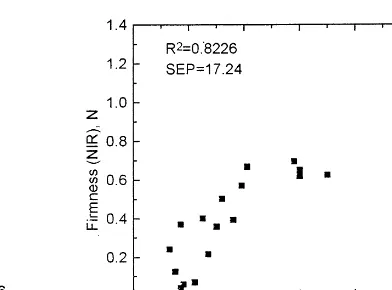
Fig. 3. Calibration of MLR by the NIR system versus
labora-tory measurements of TSS content of mango fruit. Fig. 4. Predictions of MLR by the NIR system versus labora-tory measurements of firmness of mango fruit.
Near-infrared (NIR) technology is a nonde-structive method for analyzing the ingredients of organic products, and it is being successfully im-plemented throughout the food industry. NIR systems are applied both in laboratories and in on-line production processes (Williams and Nor-ris, 1987). Analysis of NIR absorption spectra provides quantitative determinations of ingredi-ents such as sugar in dry and aqueous mixtures (Giangiacomo et al., 1981, 1986), water in corn (Finney and Norris, 1978), soluble solids in mel-ons (Dull et al., 1992), soluble solids, sugar, sor-bitol content and chlorophyll contents in peaches and nectarines (Slaughter, 1995), and acidity, sol-uble solids content and firmness in apples (Lammertyn et al., 1998). The method has been implemented for dry matter determination of onions (Birth et al., 1985) and for maturity deter-mination of fresh dates (Schmilovitch et al., 1992, 1997, 1999). Saputra et al. (1995) investigated the diffuse reflectance of NIR from cut mango fruit (cv. ‘Gedong’) for classification according to su-crose and malic acid content. Guthrie and Walsh
Fig. 5. Predictions of MLR by the NIR system versus labora-tory measurements of TSS content of mango fruit.
(1997) used NIR models to assess dry matter in mango fruit (cv. ‘Kensington’).
The objectives of the present study were to evaluate NIR analysis of intact mango fruit and to establish relationships between the NIR mea-surements and the major physiological quality indices which relate to the maturity of the fruit.
Table 2
The results for prediction errors of MLR, and PLS regression methods, andr2, the coefficients of determination for the spectrum
ofD2log (1/R), based on about 33% of the data set, for TSS, acidity, firmness and storage period parameters
TSS
Parameter Acidity Firmness Storage period
PLS MLR
PLS MLR
Method MLR PLS MLR PLS
0.161 0.22 17.14 23.18 37.03 40.69
SEP 1.223 1.445
0.6085 0.3927 0.8226
2. Materials and methods
2.1. Instrumentation
The experimental arrangement for testing mango fruit included an NIR spectrophotometer (Quantum 1200, manufactured by LTI, Rockville, MD, USA), a single directional fiber-optic bundle, detector and a dark compartment (Fig. 1). The light source of this instrument is a 12-V/75-W tungsten halogen lamp (Osram 5662). The fiber-optic bundle connected into the PbS detector en-able an exposed surface, 40 mm in diameter, to be observed. The detector assembly includes a flex-ible rubber pad which fitted tightly against the mango surface and prevented scattered radiation from reaching the detectors. The dark
compart-ment shielded the detector assembly and the mea-sured fruit from ambient radiation. The incident beam carried via the fiber-optic bundle fell per-pendicularly onto the fruit sample and reflected radiation was collected by the PbS sensor plates of the detector, placed on each side of the emitter and viewing the irradiated area from directions 90° apart. The Quantum 1200 acquired 1288 data points in each scan, which enabled the spectrum to be positioned to an accuracy of approximately 0.3 of the sampling interval. A concave laser hologram grating was used for the wavelength range, 1200 – 2400 nm, in 1 nm monochromatic resolution. The complete configurations were cali-brated against a white ceramic background disc. The signals were accumulated and processed in a microcomputer system. Data were analyzed with SpectraMetrix software (Spectra-Metrix V1.8 soft-ware, 1989, L.T. Industries, Rockville, MD).
2.2. Experimental
Eighty mango fruit (Mangifera indica L., cv’ ‘Tommy Atkins’) were taken from a packing house, 5 h after they had been harvested from a single orchard during a summer harvest season. The fruit had been cooled and sized by weight, and all were found to be in size group ‘B’ (351 – 550 g) according to OECD standards (OECD, 1993). The fruit were stored in an air-conditioned laboratory at 20°C and about 85% humidity, for 0 – 318 h. In order to evaluate the changes in the mangoes during storage, ten fruits were taken in each of eight time intervals, during a total storage time of 318 h. Each batch of ten fruits was subjected to NIR spectrophotometry, and imme-diately to penetration firmness tests and physio-logical (physio – chemical) tests. The ranges of the tested parameters are presented below.
2.3. NIR measurements
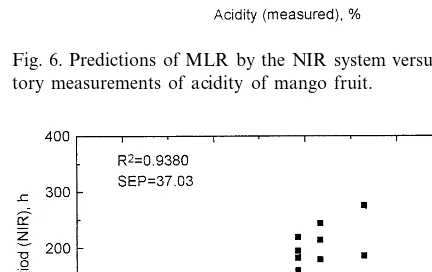
The NIR spectrometry system was arranged in reflectance mode for receiving NIR signals from the peel and flesh of the fruit. The sampled fruit was positioned so that the NIR detector assembly sampled a region at one marked site, on the circumference of the largest cross-section perpen-Fig. 6. Predictions of MLR by the NIR system versus
labora-tory measurements of acidity of mango fruit.
dicular to the stem – blossom axis. Each fruit was scanned 30 times in the sampled region and the readings were automatically averaged to one spec-trum signal.
2.4. Determination of physiological parameters
During the ripening process the mango fruit becomes softer. There is an increase in the soluble sugars content (usually expressed as total soluble solids, TSS, as most of the solids are sugars) and there is a concurrent reduction in titratable acidity (which can be expressed as the percentage of citric acid in the flesh).
Firmness was first measured with a Chatillon durometer (John Chatillon & Sons, NY) with a 6.35-mm-diameter, 60° conical probe. The instru-ment measures the force required for the mechan-ical probe to penetrate 5.5 mm into the tissue of unpeeled fruit at a speed of 3 mm s−1. The firmness was measured with a standard procedure, on the two opposite wider sides, at the center of the fruit. The measured forces were averaged and expressed in Newton.
Tissue samples of 15 – 20 g were then cut from each fruit separately, from the marked area close to the region in which the NIR readings had been taken, and were macerated with a commercial juice extractor, filtered and centrifuged (10 000× gfor 10 min). The supernatant juice was used for the determination of TSS and titratable acidity. TSS was determined with an Atago PR-1 digital refractometer and expressed as percentage TSS in the juice. Titratable acidity was determined by titrating the supernatant juice with 0.1 N NaOH and the data were expressed as the percentage of citric acid in the juice. The ranges of the measured parameters were 24 – 384 h, 0.18 – 1.3 N, 7 – 21%, and 0.15 – 0.82% for storage period, firmness, sugar content and acidity, respectively.
2.5. NIR analysis
About 66% of the sampled fruit were randomly selected and used for calibrating the NIR models, and the remainders were used for evaluating the model prediction error. The SpectraMetrix soft-ware was used for processing the data and NIR
models were developed for the calibration part of the sample data set. Processed spectral data such as the first derivative, log (1/R) and its second derivative were analyzed for principle component analysis (PCA), partial least square (PLS) and multi-linear (MLR) regressions (Martens and Nase, 1987). Typical spectra ofRandD2log (1/R) are presented in Fig. 2.
The NIR spectrum values obtained for each fruit were analyzed by means of SpectraMetrix and LightCal Plus software packages (LightCal Plus software, L.T. Industries, Rockville, MD) using MLR, PCA and PLS regressions. Models were formulated which related the NIR spectra to storage period, firmness, sugar content and acidity in each tested fruit. The error associated with the results of such a model is defined by the standard error of calibration (SEC):
SEC=
'
S(Y. −Y) 2N−2
where Y=the actual value of sample; Y. =the calculated value of sample; and N=number of samples. The SEC for each parameter was ex-pressed in the same units.
3. Results and discussion
3.1. Statistical calibration analysis
PCA and PLS methods are based on the regres-sion of the full spectra while MLR is based on discrete parts of the spectra. PCA in contrary to MLR and PLS does not take into account the wet-lab data (Martens and Nase, 1987). Hence, in general, MLR and PCA should result more ro-bust models while MLR should be the simplest one, and may lead to simple future application using several wavelengths only.
and PLS, for the original spectrum R, its first derivative D1R, and log (1/R) and its second derivativeD2log (1/R), are presented in Table 1. In general, the PLS method seems to produce the best calibration results using D2log (1/R) for firmness, sugar content and acidity and D1R for storage period. An example to the calibration results of TSS content by the NIR system versus laboratory measurements is represented in Fig. 3 (MLR model, in conjunction with the following figures). Although PCA models seem to produce a reasonable SEC, a non-monotonic relationship of SEC to the number of factors (undesired behav-ior) prevents confident use of these models for prediction purposes.
The coefficients of variance for firmness, TSS and acidity were 0.68, 0.30 and 0.37, respectively. Average intercorrelations among firmness – TSS, TSS – acidity, and firmness – acidity per storage period were 0.41, 0.28 and 0.35, respectively. Rel-atively high coefficients of variance and low inter-correlations indicate that prediction by the NIR method is applicable.
3.2. Statistical prediction analysis
Based on the above, MLR and PLS regression models were applied to the prediction data set for
D2log (1/R). The standard error of prediction (SEP) was calculated by means of the same for-mula as the SEC. The SEP represents the sensitiv-ity of prediction. The results of these predictions are presented in Table 2. Comparison between MLR and PLS results indicates that the MLR method is preferable.
MLR prediction results for storage period, firmness, sugar content and acidity are presented in scatter plots, in Figs. 4 – 6 and Fig. 7, respec-tively. In all figures, the ordinate and abscissa axes represent the measured and the fitted values of the appropriate parameters, respectively. The correlation between the measured and predicted values of the parameters is high for TSS and storage period, relatively high for firmness and moderate for acidity. Due to the randomized data split process for calibration and prediction sets, some graphs show discontinuous (e.g. the firmness between 0.7 and 0.9 N in Fig. 4 and the TSS
between 9 and 13% in Fig. 5). However, the lake of data observed in the prediction results (Figs. 4 and 5) do not appear in the calibration results (Fig. 3), implicated that the presented models are valid. The low acidity of the fruit might have caused the relative insensitivity for NIR prediction.
4. Conclusions
This study has established a technique, based on NIR spectroscopy of the fruit, for estimating the physical parameters of mangoes in postharvest storage. By means of multivariate calibration techniques (MLR, PLS and PCA) relationships were established between reflectance spectra and quality parameters. For storage period, firmness, sugar content and acidity, the PLS method seemed to produce the best calibration results. However, the combination of D2log (1/R) with MLR was found to provide the best prediction of the physical properties of the mango. The nonde-structive NIR measurements provided good esti-mates of the maturity indices of the mango fruit, especially the TSS content. The predicted values were highly correlated with destructively mea-sured values for TSS and storage period, and were relatively high for firmness. The low acid content in the fruit might have caused the relative insensi-tivity for NIR prediction. Further work is re-quired to optimize and implement this technique.
Acknowledgements
The authors gratefully acknowledge the techni-cal assistance of Asia Weksler and Ilana Rot, of the Institute for Technology and Storage of Agri-cultural Products. Contribution from the Agricul-tural Research Organization, the Volcani Center, Bet Dagan, Israel. No. 727/98 series.
References
Brown, B.I., Peacock, B.C., Wong, L.S., 1984. Physiological, chemical and quality changes in mangoes during posthar-vest ripening. Proceedings of the 1st Australian Mango Research Workshop. Cairns, Queensland. p. 279. Dull, G.G., Leffler, R.G., Birth, G.S., Smitte, D.A., 1992.
Instrument for nondestructive measurement of soluble solids in honeydew melons. Trans. ASAE 35, 735 – 737. Finney, E.E., Norris, K.H., 1978. Determination of moisture
in corn kernels by near-infrared transmittance measure-ments. Trans. ASAE 21, 282 – 284.
Fuchs, Y., Pasis, E., Zauberman, G., 1980. Changes in amy-lase activity, starch and sugars contents in mango pulp. Scientia Hortic. 13, 155 – 157.
Giangiacomo, R., Dull, G.G., 1986. NIR spectrophotometric determination of individual sugars in aqueous mixtures. J. Food Sci. 51, 679 – 683.
Giangiacomo, R., Magee, J.B., Birth, G.S., Dull, G.G., 1981. Predicting concentrations of individual sugars in dry mix-tures by near-infrared reflectance spectroscopy. J. Food Sci. 46, 531 – 534.
Guthrie, J., Walsh, K., 1997. Non-invasive assessment of pineapple and mango fruit quality using near-infrared spectroscopy. Aust. J. Exp. Agr. 37, 253 – 263.
Lakshminarayana, S., 1980. Mango. In: Magy, S., Shaw, P.E. (Eds.), Tropical and Subtropical Fruits: Compositions, Properties and Uses. Avi Publishing, Westport, CT. Lammertyn, J., Nicolai, B., Ooms, K., Smedt, V.,
De-Baerdemaker, J., 1998. Non-destructive measurement of acidity, soluble solids, and firmness of Jonagold apples using NIR-spectroscopy. Trans. ASAE 41, 1089 – 1094. Martens, H., Nase, T., 1987. Multivariate calibration by data
compression. In: Williams, P.C., Norris, K.H. (Eds.), Near Infrared Technology in the Agricultural and Food Indus-tries. American Association of Cereal Chemists. American Association of Cereal Chemists, St. Paul, MN.
Medlicott, A.P., N’Diaya, M., Sigrist, J.M., 1990. Harvest maturity and concentration and exposure time to acetylene influence initiation of ripening in mangos. J. Am. Soc. Hort. Sci. 115, 426 – 428.
Mizrach, A., et al., 1996. Method for non-destructive determi-nation of quality parameters in fresh produce. United States Patent, No. 5, 589, 209.
Mizrach, A., Flitsanov, U., Fuchs, Y., 1997. An ultrasonic nondestructive method for measuring maturity of mango fruit. Trans. ASAE 40, 1107 – 1111.
Mizrach, A., Flitsanov, U., Schmilovitch, Z., Fuchs, Y., 1999. Determination of mango physiological indices by
mechani-cal wave analysis. Postharv. Biol. Technol. 16, 179 – 186.
OECD Standards, 1993. International Standardization of Fruit and Vegetables – Mangos. Organization for Eco-nomic Co-operation and Development. Paris, France: OECD Publications.
Peacock, B.C., 1984. Postharvest handling of mangos. Pro-ceedings of the 1st Australian Mango Research Workshop. Cairns, Queensland. p. 295.
Peacock, B.C., Murray, C., Kosiyachinda, S., Kosittrakul, M., Tansiriyakul, S., 1986. Influence of harvest maturity of mangoes on storage potential and ripe fruit quality. AS-EAN Food J. 2, 99 – 101.
Saputra, D., Budiastra I.W., Purwadaria H.K., 1995. Classifi-cation of mango by near infrared diffuse reflectance. Pro-ceedings of the Food Processing Automation Conf. IV, Am. Soc. Agr. Eng., 197 – 203.
Schmilovitch, Z., Bernstein, Z., Austerweill, M., Zaltzman, A., Dull, G.G., 1992. Fresh date sorting by NIRS. In: Murry, I., Cow, I.A. (Eds.), Making Light Work: Advances in Near Infrared Spectroscopy. Ian Michael Publications, UK, pp. 425 – 433.
Schmilovitch, Z., Hoffman, A., Egozi, H., Ben Zvi, R., Bern-stein, Z., Alchanatis, V., 1999. Maturity determination of fresh dates by near infra-red spectrometry. J. Sci. Food Agric. 79, 86 – 90.
Schmilovitch, Z., Hoffman, A., Egozi, H., Ben Zvi, R., Bern-stein, Z., Alchanatis, V., 1997. System and method for maturity determination of pre-harvested fresh dates by near infra-red spectrometry. In: Sensors for Nondestructive Testing. Proc., Int. Conf., Feb. 1997 NRAES-97. Orlando. FL, USA. pp. 111 – 121.
Slaughter, D.C., 1995. Non-destructive determination of inter-nal quality in peaches and nectarines. Trans. ASAE 38, 617 – 623.
Spectra-Metrix V1.80 software, 1989. LT Industries, Inc. Rockville, MD, USA.
Thangaraj, T., Irulappan, I., 1989. Studies on the maturity standards for mango fruit. South Indian Hort. 37, 341 – 343.
Williams, P.C. Norris, K.H., 1987. Near Infrared Technology in the Agricultural and Food Industries. American Associ-ation of Cereal Chemists, Inc., St. Paul, MN, USA. pp. 169 – 180, 201 – 208.
Yanko, U., Zauberman, G., Fuchs, Y., Zehavi, H., 1984. Criteria for the determination of harvest date of mango fruit (in Hebrew). Alon Ha’notea 11, 1 – 3.