Corresponding author: [email protected]
Sensitivity of total protein creatinine ratio
in urine for diagnosis diabetic nephropathy
Fatrinawati, Windarwati, Osman Sianipar*
Department of Clinical Pathology and Laboratory Medicine, Faculty of Medicine Universitas Gadjah Mada/Dr Sardjito General Hospital, Yogyakarta, Indonesia
ABSTRACT
Diabetic nephropathy is one of diabetic complications characterized by proteinuria and impaired renal function. Conirmation of diagnosis based either on urine value of albumin excretion rate (AER) 30-300 mg/24 hours or albumin creatinine ratio (ACR) 30-300 mg/g or total protein creatinine ratio (TPCR) 150-500 mg/g. It is reported that TPCR measurement is more acceptable since it is convenient, fast and does not require special preparation. The aim of this study was to investigate the accuracy of TPCR for diagnosis of diabetic nephropathy among patients with type 2 diabetes (type 2 DM). A diagnostic test study was conducted which involved 86 patients with type 2 DM where urine TPCR value equal or more than 150mg/g was independently and blindly compared with AER as a refference standard to diagnose diabetic nephopathy. The inclusion criteria were patients with type 2 DM who suspected suffer from diabetic nephropathy (suffer from DM more than 4 years) and agree to participate in this study. Those whom were suffer from at least on of the following diseases urinary tract infection, congestive heart failure, liver dysfunction, pregnancy, multiple myeloma, microangiopathy hemolytic anemia (MAHA) and incomplete data were excluded from the study. Contingency (2x2) table analysis was used to calculate sensitivity, speciicity, positive predictive value (PPV), negative predictive value (NPV), likelihood ratio for positive test result/LR(+), likelihood ratio for negative test result/ LR(-), and accuracy. The average of TPCR among diabetic nephropathy patient was 248.07 mg/g. It was signiicantly higher than compared to those non diabetic nephropathy patient (103.52 mg/g). It was found 75 true positive, 9 true negative, and 2 false positive. The result showed that TPCR had a sensitivity, speciicity, PPV, and NPV of 97.4%, 100%, 100%, and 81,8% respectively to diagnose diabetic nephropathy.The TPCR with value equal or more than 150 mg/g in the morning sample urine can be used to diagnose diabetic nephropathy.
ABSTRAK
Nefropati diabetik merupakan salah satu komplikasi diabetes yang ditandai dengan adanya
proteinuria dan gangguan fungsi ginjal. Konirmasi diagnosis didasarkan pada laju ekskresi
infeksi saluran kencing, gagal jantung kongesti, disfungsi hati, hamil, myeloma multipel,
microangyopathy anemia hemolitik (MAHA) dan data yang tidak lengkap tidak termasuk dalam kriteria eksklusi. Analisis tabel kontingensi (2x2) digunakan untuk menghitung
sensitiitas, spesiisitas, nilai prediktif positif (NPP), nilai prediktif negatif (NPN), rasio kemungkinan positif (RK+), rasio kemungkinan negatif (RK-), dan akurasi. Rerata TPCR
di antara pasien nefropati diabetik sebesar 248,07 mg/g dan lebih tinggi secara bermakna dibanding pasien yang tidak menderita nefropati diabetik (103,52 mg/g), serta ditemukan 75 positif benar, 9 negatif benar, dan 2 positif palsu. Hasil pemeriksaan menunjukkan
bahwa TPCR memiliki sensitiitas 97,4%, spesiisitas 100%, NPP 100%, dan NPN 81,8%
untuk diagnosis nefropati diagnostik. TPCR dengan nilai sama atau lebih dari 150 mg/g pada sampel urin pagi dapat digunakan untuk diagnosis nefropati diabetik.
Keywords: diabetic nephropathy - total protein creatinine ratio – sensitivity - albumin excretion rate - diagnostic test study
INTRODUCTION
Diabetes mellitus (DM) is a group of metabolic diseases characterized by hyperglycemia due to defects in insulin secretion, insulin action, or both. Diabetes mellitus is a global health problem since its incidence is rising consistently for all age-groups worldwide.1,2 In 2014, WHO
estimated that 422 million adults aged over 18 years in the world were living with DM. The prevalence of DM in South East Asia region increased from 17 million (4.1%) in 1980 to 96 million (8.6%) in 2014.1 Globally, the
prevalence of DM was estimated to be 2.8% in 2000 and 4.4% in 2030. The total number of people with DM worldwide is projected to rise from 171 million in 2000 to 366 million in 2030.2
Diabetic nephropathy is a common complication in patients with DM. It is the leading cause of chronic kidney disease in patients starting renal replacement therapy and associated with increased cardiovascular mortality.3 The prevalence of diabetic
nephro-pathy is approximately 20 to 30% in type 2 DM during their lifetime.4 Progression of
nephropathy was strongly associated with higher subsequent medical care costs in
hypertensive patients with DM. Patients with normoalbuminuria who progressed to microalbuminuria experienced an annualized change in baseline costs that was USD 396
higher signiicantly than those who maintained
normal albuminuria (USD 902 versus USD 506). In microalbuminuria group, progression
was associated signiicantly with USD 747
difference in annualized change in outpatient costs compared with no progression (USD 1,056 versus USD 309). Its costs were 37%
signiicantly higher following progression
from normoalbuminuria to microalbuminuria (USD 10,188 vs. USD 7,424).5
Limited information on laboratory test to detect microalbuminuria might lead to an impact on delay in diagnosis of diabetic nephropathy. Microalbuminuria screening in patients with DM is required to detect the diabetic nephropathy as early as possible and to avoid end stage renal disease (ESRD).6
Common tests considered for chronic kidney disease (CKD) include urine albumin testing and creatinine-derived estimates of
glomerular iltration rate (GFR). The tests can
tests are performed for the purposes of screening, diagnosis and monitoring response to treatment.
The CKD might be occured without increasing albuminuria in patients with type
2 DM. Therefore, both GFR and albuminuria
testing are important tests in screening, diagnosis and monitoring of the patients. Albuminuria testing may be conducted by measurement of the albumin excretion rate (AER) or the albumin-creatinine ratio (ACR).7however, random\\nurine samples can
be used.\\nMeasurement of urinary albumin
can be inluenced by a number of factors\\
nincluding: - urinary tract infection,\\n- high dietary protein intake,\\n- congestive heart failure,\\n- acute febrile illness,\\n- menstruation or vaginal discharge,\\n- water loading, and\\n- drugs (NSAIDS, ACEi Another albuminuria testing is total protein-creatinine ratio (TPCR) of random or spot urine sample.8-10 The measurement
of TPCR on random (‘spot’) urine samples well correlates with 24-h total protein and albumin excretion. It is reported that TPCR is more sensitive than ACR to predict clinically relevant proteinuria. It has sensitivity and
speciicity of 94% and 88% respectively at
the threshold of 100 mg/mmol.9 The
protein-creatinine ratio on a random urine sample provides evidence to “rule out” the presence
of signiicant proteinuria as deined by a
24-h urine excretion measurement.10 The
advantages of this examination using spot urine samples, making it more practical and shorter examination time. The examination
is inluenced by several factors such as
infections, high-protein diet, pregnancy and physical activity, hepatic dysfunction and congestive heart failure.11
In Indonesia, especially in the Yogyakarta Special Region, the use of TPCR for the diagnosis of diabetic nephropathy
in patients with type 2 DM has not been routinely performed. Therefore, this study was conducted to evaluate the diagnostic performance of TPCR to detect the present of microalbuminuria in patients with type 2 DM.
MATERIALS AND METHODS
Subjects
The subjects selected with the inclusion criteria were patients with type 2 DM suspected diabetic nephropathy (DM over 4 years), and agreed to participate in this study. The subject who suffer either from urinary tract infection, or congestive heart failure, or hepatic dysfunction, or multiple myeloma, or microangiopathy hemolytic anemia (MAHA), or pregnancy, or incomplete data were excluded from the study.
Procedure
Laboratory tests were carried out for 2 days in Clinical Laboratory of Dr. Sardjito General Hospital, Yogyakarta. In the 1st day,
samples were taken for fasting blood glucose, 2 hours post prandial blood glucose, HbA1c,
and spot urine. Fasting blood glucose tests,
2 hours post prandial blood glucose and HbA1c were measured from 2 mL of venous blood sample and the tests were conducted in the same day of sampling. Subjects on the 1st day was also asked to collect 5 mL urine
sample for urine albumin and creatinine measurements. Urine samples were then transferred into eppendorf tubes using a standardized micropipette, then labeled and
kept at -20°C, pooled up to suficient number
of samples were accomplished. Subjects were also given written and oral instruction for 24 hours urine collection (when collection began,
irst urination was discarded then second and
On the 2nd day, 24 hours urine samples
were collected. The collected 24-hour urine
samples were homogenized by lipping the
bottles as much as 5 times, after which the urine volume was recorded. Most homogeneous urine samples were transferred into eppendorf tubes using a standardized micropipette, then labeled and stored at -20°C, pooled until urine albumin tests performed after certain number
of samples were collected. Fasting and 2
hours post prandial blood glucose level were measured according to hexokinase method. Hemoglobin A1c (HbA1c) was measured with chromatography method. Both urine albumin and total protein were measured using an immunoturbidimetric method. Urine creatinine was measured using Jaffe method.
Albumin excretion rate is urinary albumin excretion within 24 hours and measured using immunoturbidimetric method. The AER is the refference standard to assess microalbuminuria. In this study, diabetic
nephropathy was deined by AER value of ≥30
mg/24 hours. The TPCR manually calculated by dividing the total value of urine protein and urine creatinine, the results expressed in mg/g. In this study diagnosis diabetic nephropathy was established if TPCR value equal or more than 150 mg/g.8
Data analysis
Independent t-tests was used to test difference in mean age, fasting blood glucose, 2 hours post prandial blood glucose when data distribution was normal and the Mann-Whitney test if data distribution was not normal. Chi-Square test was applied to test the
difference in proportions. The signiicance of
the result set when p value was less than 0.05
with a conidence interval of 95%. Data were
analyzed using 2 X 2 table and the results were
expressed in sensitivity (Sn), speciicity (Sp),
accuracy, positive predictive value (PPV),
negative predictive value (NPV), likelihood ratio positive and negative, and accuracy.
Ethical consideration
The protocol of the study was approved by the Medical and Health Research Ethics
Committee, Faculty of Medicine, Universitas
Gadjah Mada, Yogyakarta.
RESULTS
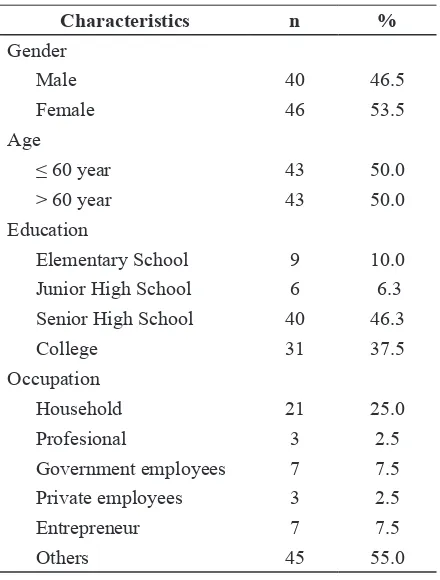
This study involved 86 patients with type 2 DM that consisted of 40males (46.5%) and 46 females (53.5%). Average age was 60.5 years, and there were 43 subject that less than 60 years old. Characteristics of the subjects completely could be seen in TABLE 1.
TABLE 1. Characteristics of subjects
Characteristics n %
Gender
Male 40 46.5
Female 46 53.5
Age
≤ 60 year 43 50.0
> 60 year 43 50.0
Education
Elementary School 9 10.0
Junior High School 6 6.3
Senior High School 40 46.3
College 31 37.5
Occupation
Household 21 25.0
Profesional 3 2.5
Government employees 7 7.5
Private employees 3 2.5
Entrepreneur 7 7.5
Others 45 55.0
Group of diabetic nephrophaty was not
signiicantly different from non diabetic
dyslipidemia status, stroke, duration of DM, fasting blood glucose level, 2 hours post-prandial blood glucose level, mean of creatinine serum level as well as HbA1c level. Mean of TPCR level in diabetic nephropathy
group was 248.07 mg/g. It was signiicantly
higher than non diabetic nephropathy group namely 103.52 mg/g. In addition, mean of AER level in diabetic nephropath y group was
205.37 mg/g which also signiicantly higher
than that in diabetic nephropathy group, 24.59 mg/g (TABLE 2).
TABLE 2. Comparison of variables among diabetic nephropathy and non diabetic nephropathy
Variable DN (n=77) Non DN (n=9) p
Body Mass Index (mean ± SD) 24.86 ± 3.37 25.24 ± 2.81 0.790
Hypertension [n (%)]
Yes 45 (58.4) 3 (33.3)
1.000
No 32(41.6) 6 (66.7)
Heart disease [n (%)]
Yes 26 (33.8) 3 (33.3)
0.384
No 51 (66.2) 6 (66.7)
Dislipidemia [n (%)]
Yes 50 (64.9) 5 (55.6)
0.659
No 27 (35.1) 4 (44.4)
Stroke [n (%)]
Yes 7 (9.1) 2 (22.2)
0.133
No 70 (90.9) 7 (77.8)
Duration of DM (mean±SD years) 9.95 ± 7.56 6.0 ± 2.68 0.168
Blood Pressure (mean±SD mmHg)
Systole 126.12 ± 11.67 125.00 ± 10.49 0.824
Diastole 77.69 ± 7.17 80.00 ± 5.48 0.450
Fasting Blood Glucose (mean±SD mg/dL) 156.46 ± 59.46 139.83 ± 17.95 0.501 Blood Glucose 2HPP (mean±SD mg/dL) 232.19 ± 85.65 195.17 ± 52.09 0.306
Serum creatinine (mean±SD) 1.10 ± 0.23 0.87± 0.15 0.630
HbA1c (mean±SD %) 7.97 ± 2.21 7.67 ± 0.68 0.891
TPCR (mean± SD mg/g) 248.07 ± 136.29 103.52 ± 35.07 0.002
AER (mean± SD mg/24 hours) 205.37 ± 134.32 24.59 ± 3.05 0.000
Note: DN = diabetic nephropathy; Non DN = non diabetic nephropathy
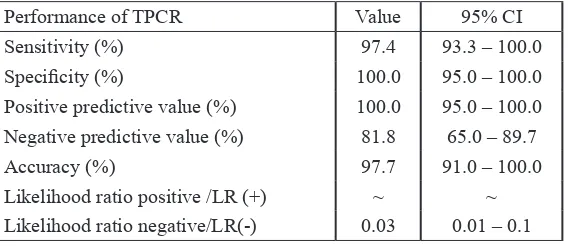
Less, equal or more than 150 mg/g comparison TPCR versus AER to detect diabetic nephropathy gave 75 true positive result and 9 true negative result. This comparison gave rise to two false positive
result. Sensitivity and speciicity of TPCR
TABLE 3. Analysis of performance diagnosis TPCR with gold standard AER
Performance of TPCR Value 95% CI
Sensitivity (%) 97.4 93.3 – 100.0
Speciicity (%) 100.0 95.0 – 100.0
Positive predictive value (%) 100.0 95.0 – 100.0 Negative predictive value (%) 81.8 65.0 – 89.7
Accuracy (%) 97.7 91.0 – 100.0
Likelihood ratio positive /LR (+) ~ ~ Likelihood ratio negative/LR(-) 0.03 0.01 – 0.1
DISCUSSION
Asymptomatic proteinuria is a sign of the beginning of diabetic nephropathy, occurs intermittently for several years and
inally settled with massive proteinuria. In
the beginning stages, mild proteinuria of
diabetic nephropathy is dificult to distinguish
with proteinuria due to membranous glomerulonephritis because of other reasons. Proteinuria is an indicator of diabetic nephropathy, but other causes must be ruled out such as congestive heart failure, pyelonephritis including physiological state and orthostatic.10
The TPCR is a quotient between urinary protein and urinary creatinine in units of mg/g creatinine. This ratio is developed in order to reduce the problem of variability volume
and urine concentration, and it relects renal
excretory function and creatinine levels are relatively stable, although the number of urine excreted low or high.12
Sensitivity TPCR to diagnose diabetic nephropathy is 97.4%. It means that this test has ability to detect 97.4% out of patient suffer from diabetic nephropathy. The test is able to detect all of non diabetic nephropathy
since it has speciity of 100%. The PPV of
100% means that the probability of a person truely suffer from diabetic nephropathy is 100% when TPCR level is equal or more than 150 mg/g. The NPV is 81.8% means that the probability of a person realy not suffer from
diabetic nephropathy is 81.1% whenever value of TPCR is less than 150 mg/g. The
study gives result where the speciicity is
higher than sensitivity so that this TPCR test is better use to rule in diabetic nephropathy among patients with type 2 DM. It is also supported the result of likelihood ratio since both likelihood ratio for test positive and negative are far from value of one. It will give rise to biger changes between pre and post-test probality.
The cut-off in this study was based on a recommendation of AACE/ACE 2015 which states the value of microalbuminuria set using TPCR value in the range of 150-500 mg/g. It was also based on research by Hashemapour
et al.,11 using a cut-off of 150 mg/g.8,11
Hashemapour et al.,11 report that TPCR had
sensitivity of 94.5% and a speciicity of
78.2%. Another study conducted in Japan by Yamamoto et al.,13 which involved 1,033
outpatients to detect microalbuminuria with TPCR using 150 mg/g as the cut-off. They reported that TPCR has sensitivity of 94.4 %
and speciicity of 86.1% to diagnose diabetic
nephropathy.13 The difference with this study
was that they recruited the larger number of subject and conducted in a population of patients with cardiovascular risk factors.
Atkins et al.14 conducted a research to
investigate sensitivity and speciicity of TPCR
10,596 subjects recruited and the average age was more than 40 years old. The result of the study showed that TPCR had sensitivity
and speciicity of 91.7% and 95.3% at a
cut-off of 0.20 mg/mg. The study differed from our study because they used more sample size, different cut-off and used timed urine samples.14 Yadav et al.,15 conducted a similar
research in Nephal that involved 144 subjects where TPCR test was compared with AER as reference standard. They found that TPCR test
had sensitivity and speciicity of 96.6% and
74.4% at a cut-off of 150 mg/g.15
Bukhari et al.,14 conducted a similar
research in Faisalabad which involved 134
patients with type 2 DM whose age more than 40 years old. They reported that TPCR with a cut-off of 150 mg/g had a sensitivity of 95.2%
and a speciicity of 76.5% as compared with
urine protein 24 hours to diagnose diabetic nephropathy. This research was different from our study since they recruited bigger number of subject so that the bias can be minimized. The TPCR examination had shown be more practical, time-saving and more convenient for patients.16 In addition to the parameters
proteinuria, there are some markers that can be used to rule out the diagnosis of diabetic nephropathy include: cystatin C, urine transferrin and proteomics. Serum cystatin C is a marker of renal function better than
serum creatinine concentration and signiicant
predictor of the development of end-stage
renal failure compared with GFR. Cystatin C is iltered almost completely reabsorbed in
the proximal tubule, with almost no tubular secretion of cystatin-C. Thus, increase cystatin-C in urine, indicates renal tubular damage rather than just damage to the glomerulus. In addition, cystatin-C urine will increase with the high degree of albuminuria and achieve a higher level macroalbuminuria in patients with DM.17
CONCLUSIONS
Laboratory examination of TPCR at level of equal or more than 150 mg/g, has
sensitivity, speciicity, positive predictive
value, negative predictive value, and accuracy of 97.4%, 1000.%, 100.0%, 81.8%, and 97.7%, respectively to diagnose diabetic nephropathy in patients with type 2 DM. Therefore, it could be used as an alternative whenever laboratory examination of AER unlikely to be done.
ACKNOWLEDGEMENTS
We would like to thank all patients who participated in this study.
REFFERENCES
1. World Health Organization. Global report on diabetes. Geneva: World Health Organiztion, 2016.
2. Wild S, Roglic G, Green A, Sicree R, King H. Global prevalence of diabetes: estimates for the year 2000 and projections for 2030. Diabetes Care 2004; 27(5):1047-53. http:// dx.doi.org/10.2337/diacare.27.5.1047
3. Gross JL, de Azevedo MJ, Silveiro SP, Canani LH, Caramori ML, Zelmanovitz T. Diabetic nephropathy: diagnosis, prevention, and treatment. Diabetes Care 2005; 28(1):164-76. http://dx.doi.org/10.2337/diacare.28.1.164 4. Tuttle K. The evaluation of diabetic
nephropathy. Adv Stud Med 2005; 5(1A):20-7.
5. Nichols GA, Vupputuri S, Lau H. Medical care costs associated with progression of diabetic nephropathy. Diabetes Care 2011; 34(11):2374-8. http://dx.doi.org/10.2337/ dc11-0475
Hawaii J Med Public Health 2012; 71(7):186-92.
7. Chadban S, Howell M, Twigg S, Thomas M, Jerums G, Cass A, et al. The CARl guideline. Assessment of kidney function in type 2 diabetes. Nephrology 2010; 15(Suppl 1):146-61. http://dx.doi.org/10.1111/j.1440-1797.2010.01239.x
8. Handelsman Y, Bloomgarden ZT, Grunberger G, Umpierrez G, Zimmerman RS, Bailey TS, et al. American Association of Clinical Endocrinologists and American College of Endocrinology--Clinical practice guidelines for developing a diabetes mellitus comprehensive care plan--2015--executive summary. Endocr Pract 2015; 21(4):413-37. http://dx.doi.org/10.4158/EP15672.GL
9. Methven S, MacGregor MS, Traynor JP, O’Reilly DS, Deighan CJ. Assessing proteinuria in chronic kidney disease: protein-creatinine ratio versus albumin-protein-creatinine ratio. Nephrol Dial Transplalnt 2010; 25(9):2991-6. http://dx.doi.org/10.1093/ ndt/ gfq140
10. Price CP, Newall RG, Boyd JC. Use of protein: creatinine ratio measurements on random urine samples for prediction of signiicant proteinuria: a systematic review. Clin Chem 2005; 51(9):1577-86. http:// dx.doi.org/10.1373/clinchem.2005.049742 11. Hashemipour S, Charkhchian M, Javadi A,
Afaghi A, Hajiaghamohamadi AA, Bastani A, et al. Urinary total protein as the predictor of albuminuria in diabetic patients. Int J Endocrinol Metab 2012; 10(3):523-6. http:// dx.doi.org/10.5812/ijem.4236
12. Montero N, Soler MJ, Pascual MJ, Barrios C, Márquez E, Rodríguez E, et al. Correlation between the protein/creatinine ratio in spot urine and 24-hour urine protein. Nefrologia 2012; 32(4):494-501. http://dx.doi. org/10.3265/Nefrologia.pre2012.Apr.11300 13. Yamamoto K, Yamamoto H, Yoshida K, Niwa
K, Nishi Y, Mizuno A, et al. The total urine protein-to-creatinine ratio can predict the presence of microalbuminuria. PLoS One 2014; 9(3):e91067. http://dx.doi.org/10.1371/ journal.pone.0091067
14. Atkins RC, Briganti EM, Zimmet PZ, Chadban SJ. Association between albuminuria and proteinuria in the general population: the AusDiab study. Nephrol Dial Transplant 2003; 18(10):2170-4. http://dx.doi.org/10.1093/ndt/ gfg314
15. Yadav BK, Adhikari S, Gyawali P, Shrestha R, Poudel B, Khanal M. Use of protein: creatinine ratio in a random spot urine sample for predicting signiicant proteinuria in diabetes patient. Nepal Med Coll J 2010; 12(2):100-5.
16. Bukhari H, Shaukat A, Mahes A. Diabetic nephropathy; protein to creatinine ratio as a cost effective diagnostic. Prof Med J 2016; 23:302-6. http://dx.doi.org/10.17957/TPMJ/ 16.3184