Journal of Indonesian Economy and Business Volume 30, Number 3, 2015, 273– 287
THE MIDDLE-INCOME TRAP:
IS THERE A WAY OUT FOR ASIAN COUNTRIES?
Raisal Fahrozi Lubis Faculty of Economics and Business
University of Brawijaya (raisallubis@gmail.com)
Putu Mahardika Adi Saputra Faculty of Economics and Business
University of Brawijaya (putu@ub.ac.id)
ABSTRACT
This study aims at investigating the phenomena of the middle-income trap found in developing Asian countries, such as China, India, Indonesia, Malaysia, the Philippines, and Thailand. The effects of some of the determinant variables of per capita income, such as government expenditure, investment expenditure, high technology exports, factors of human capital (enrollment rates in secondary and tertiary education), and the dependency ratio are analyzed by using a factor analysis and regression analysis. The factor analysis is used to reduce the variable of the publics’ enrollment rate in secondary and tertiary education into the variable of the human capital factor. The findings of the study reveal that some variables, namely government expenditure, investment expenditure, high technology exports, and the factors of human capital, have positive effects in increasing the per capita income of a country. The variable of the dependency ratio, on the other hand, has a negative effect on a country’s per capita income.
Keywords: Asian, middle-income trap, panel analysis, and slowdown.
INTRODUCTION
When developing countries in Asia are labeled as middle-income countries, they need to keep their economies growing in order to gain the status of high-income countries. According to Agenor et al. (2012), there are currently only 13 countries that can transform themselves into high-income countries: Equatorial Guinea, Greece, Hong Kong SAR (China), Ireland, Israel, Japan, Mauritius, Portugal, Puerto Rico, the Republic of Korea (also known as South Korea), Singapore, Spain, and Taiwan. These are the 13 countries, out of 101, which were labeled as middle-income countries after World War II. Furthermore, there are some previous studies comparing East Asian countries, which have successfully changed themselves into high-income countries, with Latin American countries which have been assigned the status of
middle-income countries. Gill and Kharas (2007) described the middle-income trap as a condition in which a country fails to change itself into a high-income country.
Journal of Indonesian Economy and Business September 274
the transition from diversification to specializa-tion in producspecializa-tion, the transispecializa-tion from physical accumulation of factors to productivity-led growth, and the transition from a centralized economic management to a decentralized one.
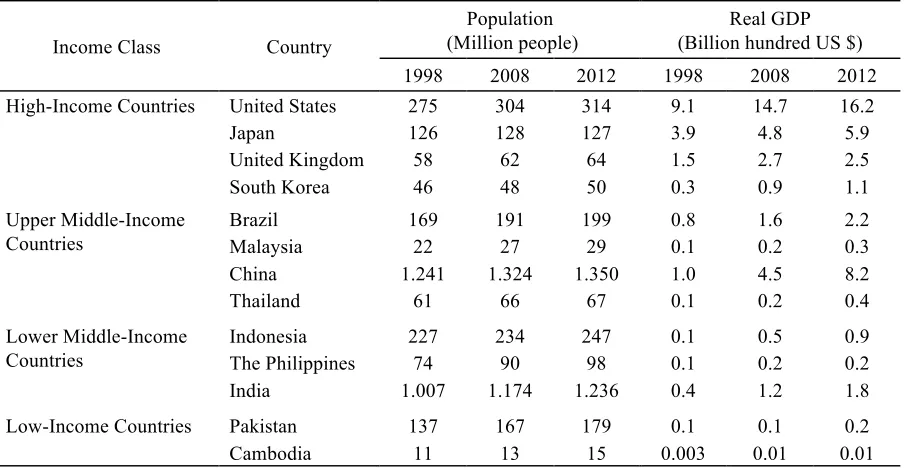
Developed countries, such as Japan, South Korea, the UK, and the USA are countries with a high real Gross Domestic Product (GDP) and a relatively small population (except the USA and Japan). They, therefore, became high-income countries. On the other hand, most developing countries have large populations (except Cam-bodia) with smaller real GDP, so that they are categorized as middle-income countries based on their per capita GDP.
However, a large population does not always lead to problems in reaching high-income nation status. Some high-income countries with large populations like the USA and Japan have become high-income countries since they had some supporting factors, such as policies to in-crease innovation through R&D, suitable human capital, capital accumulation, and understanding opportunities in new places (Jitsuchon, 2012). Therefore, the fast growth of economies in the last few years has helped some developing countries to increase their per capita income.
China, India, Brazil, and Indonesia were able to raise their real GDP by as much as developed countries have. With large populations and posi-tive growth in the recent few decades, these countries are predicted to be able to change the position of the current developed countries which form the G7 and become the new leaders of the world economy in 2030 (Pricewater-houseCoopers, 2013).
The populations in developed countries have high productivity levels. The developed coun-tries, moreover, have high R&D expenditure, and high human capital qualities. Accordingly, the developed countries have the industrial structure for the high-skill intensive products which have high productivity and high competi-tive ability (Tho, 2013). For example, the gap between the real GDP of the USA and the GDPs of developing countries is still large. Although the USA is a country with the third largest population in the world, it still has a high real GDP. The real GDP of developing countries, furthermore, is still low compared with that of Japan (except for China which was having some success in taking Japan’s position as the second largest economy in the world in 2010). In fact, the population of Japan is smaller than that of India, Indonesia, Brazil, or Pakistan. Even
Table 1. Comparison of Real GDP and Population in High-Income Countries, Middle-Income Countries, and Low-Income Countries (1998, 2008, and 2012).
Income Class Country
Population (Million people)
Real GDP (Billion hundred US $)
1998 2008 2012 1998 2008 2012
High-Income Countries United States 275 304 314 9.1 14.7 16.2
Japan 126 128 127 3.9 4.8 5.9
United Kingdom 58 62 64 1.5 2.7 2.5
South Korea 46 48 50 0.3 0.9 1.1
Upper Middle-Income Countries
Brazil 169 191 199 0.8 1.6 2.2
Malaysia 22 27 29 0.1 0.2 0.3
China 1.241 1.324 1.350 1.0 4.5 8.2
Thailand 61 66 67 0.1 0.2 0.4
Lower Middle-Income Countries
Indonesia 227 234 247 0.1 0.5 0.9
The Philippines 74 90 98 0.1 0.2 0.2
India 1.007 1.174 1.236 0.4 1.2 1.8
Low-Income Countries Pakistan 137 167 179 0.1 0.1 0.2
Cambodia 11 13 15 0.003 0.01 0.01
2015 Lubis and Saputra 275
though South Korea and the UK have relatively small populations, they have higher real GDPs than Indonesia, Thailand, Pakistan, and the Philippines.
Most developing countries have a large labor force, a demographic bonus, and low wage structures, compared to the developed countries. Those factors should be taken into account as benefits for attracting Foreign Direct Investment (FDI) and other types of investment in develop-ing countries. However, Agenor et al. (2012) stated that developing countries would face ris-ing wages in the long term. If the developris-ing countries fail to change their economic struc-tures, the competitive ability of commodities allocated to a certain production activity would decrease, so the middle-income trap would occur. The middle-income trap would then slow the growth in productivity and output, and inter-national competitive ability would decrease as well. Thus, their economies would be trapped in the middle-income bracket, and will not be able to transition into high-income economies.
To solve the problem concerning employees’ wages, production activities making products with low value-added should be changed into production activities producing products with high value-added. Since most developed coun-tries have relatively small populations, and are oriented toward the production of capital inten-sive and skill inteninten-sive products, as well as fo-cusing on the service field, the developed coun-tries have a high competitive ability and high productivity levels so that they can increase their employees’ wages. Regarding that condition, developing countries should improve the quality of their human capital and technology in order to compete with the other countries and escape from the wage trap which is getting higher (Carnovale, 2012).
A suitable policy for improving human capital should be an important part of a coun-try’s development strategy. Economic theories have demonstrated that growth in an economy is gained from the relationship between a new invention and the human capital resources, so some countries which want to maintain a fast growing economy should improve the quality of
their education and training systems to master the available technology. Therefore, the invest-ment in human capital is considered an impor-tant item in developing a country’s economy (Becker 1975; Jones & Romer 2009; Lin 2012). Jankowska et al. (2012) stated that South Korea had been successful in improving its citizens’ enrollment in education, particularly secondary and tertiary education, so that South Korea now has a large number of skilled workers. In con-trast, developing countries in Asia generally have low human capital.
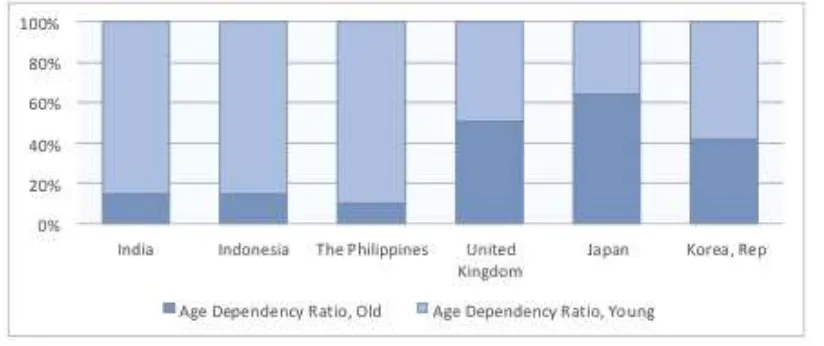
According to Egawa (2013), a factor that can trigger the middle-income trap is a country’s demographics, such as its fertility rate and its dependency ratio. In line with that statement, Aiyar et al. (2013) stated that the dependency ratio significantly influences the slowdown in growth. If the birth rate is high and the mortality rate is low, the dependency ratio will be high and the numbers for those in their productive ages will decrease. Such a decrease has the potential to decrease savings, so it leads to decreased national income as well. The depend-ency ratio in some developed and developing countries is varied. Some developed countries like the Philippines, India, and Indonesia gener-ally have a dependency ratio above 50%. Some developed countries also have a high depend-ency ratio. For example, Japan and the UK are developed countries with high dependency ratios. However, there is a difference between the dependency ratio of developing countries and that of the developed countries. Generally, the developed countries have a dependency ratio in the non-productive ages, while the developing countries have it in the productive ages.
Journal of Indonesian Economy and Business September 276
total of its GDP. Regarding these conditions, both countries are vulnerable because the bu-reaucratic systems in certain developing Asian countries are not good enough.
The World Bank (2010) explained that mid-dle-income countries need large investments in order to improve their productivity, so they can escape from their growth slowdown. South Korea and Japan once faced that condition when they were middle-income countries. China, India, and Indonesia have already been going the right way by increasing their investment to as much as 25% of their GDP in the last few years. The developing countries like Indonesia, the Philippines, and India, however have a problem with their infrastructure. In fact, investment in infrastructure is an important factor to protect the momentum of economic growth for the long term.
To help the developed countries in increas-ing their productivity and competitive abilities for exported products, they diversified their poli-cies and improved the quality of their exported products, such as high technology products. According to Carnovale (2012), the dependency towards labor-based manufacturing exports and the lack of innovative development through R&D can be factors in preventing escape from the middle-income trap. Some developing coun-tries must focus on developing their induscoun-tries which have comparative strengths in the high-value-added sectors. These sectors are gained by funding R&D and having patent rights, stan-dardized technical management, and brand development (Xiaohe, 2012). However, some developing countries, such as the Philippines and Indonesia, have not focused on their decreasing R&D expenditure.
This study analyzes the middle-income trap with some variables, such as government expen-diture, investment expenditure and high technol-ogy export products, human capital, and the dependency ratio. The findings of this study reveal that government expenditure, investment expenditure, high technology export products, and human capital variables give positive influ-ences towards the per capita income of a coun-try, but the dependency ratio variable does not.
LITERATURE REVIEW
The Determinants of Per Capita Income Todaro and Smith (2009) explain that a framework of coordination failures can be used to explain the middle-income trap. Besides, such failures can cause a slowdown in growth, and trap an economy in disequilibrium because of the lack of investment, so that the middle-income trap occurs. Furthermore, Aiyar et al. (2013) analyzed some variables determining growth’s slowdown. Institutions, the demogra-phy, the macroeconomic environment and the economic structure of policies, wars and civil conflicts, and countries being located in the tropics all have significant influence, while the variable of the infrastructure does not have a significant influence.
2015
Table 2. Comparison of Real GDP, Population, and per capita GDP between Developed Countries and Developing Countries (2012)
GDP per capita
Source: World Bank Data (2014)
Jou
Table 3. Comparison of Age Dependency Ratio. Human Capital. Unemployment Rate. and Research and Development Expenditure in Developed Countries and Developing Countries (1970. 1990. and 2010).
Research & Development Source: World Bank Data(2014)
1990 Human Capital (Enrollment rate in Tertiary
2015 Lubis and Saputra 279
Furthermore, Egawa (2013) stated that edu-cation, health, the working age population, and the share of exports of high technology manu-facturing goods to the total exports are variables which bring positive effects to the per capita GDP growth rate. On the other hand, income levels, inequality, health, and political decisions in line with development are variables giving negative effects to per capita GDP growth rates. Those three previous studies can be a guideline to describing the influence of the variables determining the per capita income in middle-income countries.
A study conducted by Tho (2013) suggested that developing countries increase their activities in R&D, human capital resources, international competitiveness, and dynamic comparative advantage, as well as create high quality institu-tions, in order to avoid the middle-income trap. Felipe (2012), moreover, described a country, which successfully becomes a high-income country, as a country which is able to diversify, have comparative advantages, and produce non-standard products for export, so it is able to develop its competitiveness. Agenor et al. (2012) also mentioned some actions to prevent the middle-income trap, which included building feasible infrastructure, improving the protection of patents, and reforming the labor market. These three studies can be a guideline for creat-ing the right policies to escape from the middle-income trap.
Government Expenditure
Keynes stated that government expenditure influenced economic growth (Loizides and Vamvoukas, 2004). Since government expendi-ture is autonomous and exogenous, it can be identified as a policy tool for economic growth, and for the fluctuations in output over the long term. In addition, Keynes explained that cutting government expenditure or reducing the fiscal deficit directly causes a decrease in aggregate demand. This decrease in aggregate demand, with the multiplier negative effects, can cause a decrease in economic growth and an increase in the number of unemployed (Branson, 1979; Levacic & Rebmann, 1991; Sudarsono, 2010). In
short, the effect of a decrease in government expenditure is that growth slows and this leads countries into the middle-income trap.
Investment Expenditure
Besides government expenditure, another main aspect in Keynes theory used in determin-ing total output levels is investment expenditure (Mankiw & Scarth, 2007). Keynes described that the higher the investment expenditure is, the higher business output is. Macroeconomics has two important roles in developing an economy. First, it influences aggregate demand by trig-gering total output and job vacancies. Macro-economics, in addition, is an important compo-nent in economic growth. Investment expendi-ture contributes in developing an economy because it can increase capital stock and help the economy to produce goods and services (Kuncoro, 2005). Accordingly, the role of investment expenditure is essential in improving the productivity of a country’s economy.
High Technology Export Products
In order to give more value to export activi-ties, high technology products should be spe-cialized since they have high retail values. Based on Davis (1982) and Mani (2001), high technol-ogy export products are manufactured products whose high R&D value and result compared with their delivery cost. Schumpterian explains that the level of productivity varies during eco-nomic activities, since there is usually a differ-ence in the technology used (Saputra, 2014). The participation of entrepreneurs is needed, in order to create product innovations and new markets. Based on the perspective of Post-Keynesian economics, giving specialization to some segments in international markets can bring good prospects for economic growth because of the high elasticity of expenditure, as well as the intensity from the quality and tech-nology products (Shrloec, 2005).
Factor of Human Capital and Dependency Ratio
prob-Journal of Indonesian Economy and Business September 280
lems. A growth in population numbers can impede the growth of the economy if it is not managed well (Campbell & Stanley, 1986). Solow’s model also explains that countries with a high population growth will have low per cap-ita incomes. Those countries, furthermore, have low capital stock per settled worker and a low income level per worker. Therefore, it is impor-tant to manage the growth of the population in order to improve its welfare (Mankiw & Scarth, 2007).
Since the human capital factor is related to the abilities of the human resources in the more technical and efficient production activities, the human capital factor becomes one of the impor-tant factors in the economy. That statement is supported by Solow’s economic growth concept, which emphasized the roles of knowledge and human resources’ capital investment to trigger labor productivity. If the human resources are better, the efficiency and productivity will in-crease.
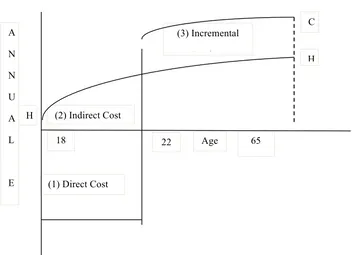
In Figure 2, the curve of Campbell and Stanley (1986) describes the relationship between education levels and the income that is earned. Area 1 (Direct Cost) is the cost incurred because of work delays, so it is negative. Next, Area 2 (Indirect Cost) is the opportunity cost of workers with an advanced education level
com-pared with the ones with an intermediate level of education. The last area is Area 3 (Incremental Earnings) which is the income earned by some-one with an advanced level of education com-pared with the one who has an intermediate edu-cation. In short, those who are highly educated have a greater income than those who do not continue their education.
Meanwhile, the dependency ratio is the comparison between non-productive ages (below 15 years old and above 64 years old) and pro-ductive ages (15-64 years old). High dependency ratios can impede the growth of an economy because the number of non-productive people, who are dependent, is higher than the number of productive people. Demographic factors show-ing high fertility levels and high dependency ratios can cause the middle-income trap, which often happens in developing countries. Accord-ing to Egawa (2013), a change in the demo-graphic structure can influence the growth of an economy. Meanwhile, Mill (2009) suggested that poverty, as an effect of a high dependency ratio, can be solved by changing the population’s demography through education. Those who are highly educated tend to have a smaller family because they have concerns for their careers and welfare.
Source: World Bank Data (2014)
Figure 1. Comparison of the Age Dependency Ratio. Old Age Dependency Ratio. Young in Developed
2015 Lubis and Saputra 281
Source: Campbell and Stanley (1986)
Figure 2. Campbell and Stanley Curve (Incremental Earningson High Income Labor)
METHODOLOGY
This study used a quantitative approach analyzing the influence of variables determining the per capita income. Table 4 summarizes some key variables influencing the per capita GDP.
The data for this study were secondary data obtained from relevant sources such as the World Bank, Penn’s World Table number 8, and UNESCO’s Institute of Statistics. This paper covers some of the Asian countries that have reached the middle-income status. The countries are China, India, Indonesia, Malaysia, the Phil-ippines, and Thailand. The data covers the
period from 1997 until 2011 (15 years) and were analyzed using a panel data quantitative analysis. There were two stages in analyzing the data statistically. The first stage was to execute a factor analysis technique on the variable secon-dary and tertiary education enrollment rates (in order to form a specific factor for the human capital variable). Secondly, the data were regressed with a panel model. The model of panel regression used can be formulated as fol-lows:
GDPPit = ß0 + ß1 GOVit + ß2 INVit + ß3 FHCit +
ß4DPRit+ ß5 HTXit + eit (1)
Table 4. Model Variables
Variables Description
GGDP GDP per capita 2005 constant price GOV Government expenditure share of GDP INV Investment expenditure share of GDP
FHC Factor of Human Capital. a factor formed by the enrollment rate in tertiary and secondary education
DPR Comparison between non-productive ages (below 15 years old and above 64 years old) and productive ages (15-64 years old)
HTEX Manufacture of export products which are included in the list of high technology products by SITC Revision OECD
18 22 Age 65
(3) Incremental
Earnings
(2) Indirect Cost
(1) Direct Cost H
H C A
N
N
U
A
L
E
Journal of Indonesian Economy and Business September 282
GDPPit is the GDP per capita of country i in period t; GOVit is the government share of GDP of country i in period t; INVit is the investment share of GDP of country i in period t; FHCit is factor of human capital of country i in period t; DPRit is the dependency ratio variable of coun-try i in period t; HTXit is the high technology exportvariable of country i in period t; βo is the
constant; βn is the regression coefficient; eit is the disturber coefficient.
According to the introduction and literature review, those variables can be incorporated to build the model since they have been used in many previous studies concerning the middle-income trap. Eichengreen et al. (2013) argued that 85% of economic growth’s slowdown can be explained by a slowdown in the rate of the productivity growth factor, including invest-ment’s share of GDP and the governinvest-ment’s share of GDP. Therefore, investment’s share of GDP and the government’s share of GDP can give a positive effect to the per capita GDP. The hu-man capital factor is also one of the important variables that can influence economic growth and give a positive influence to per capita GDP, whereas the demographic factors give a negative influence to per capita GDP. In addition, Egawa (2014) believed that high technology exports positively influence per capita GDP.
FINDINGS
The empirical model was executed in two stages. The first stage described the model, which was used to analyze the human capital variable using a factor analysis technique, and the second stage explained the panel model
which was employed to analyze the determinant variables of per capita income.
The First Stage (Factor Analysis)
As mentioned above, some variables deter-mining the per capita income have some factors. For example, the human capital factor is formed by the Secondary Education Enrollment Rate (SEER) and Tertiary Education Enrollment Rate (TEER). The analysis result of the human capital factor can be seen in Table 5, in which Bartlett’s test of sphericity analysis on the factor of human capital with each Chi-Square being 50.03 (df 1), which is produced by each significant value of 0.000 (lower than 0.05), and shows that the cor-relation matrix is not an identity matrix. Kaiser-Meyer-Olkin`s MSA value from the analysis result of the human capital factor is 0.5, which is bigger than and equal to 0.5. Next, anti-image matrices explain whether or not the individual variables analyzed are worth analyzing further. The result, in fact, declares that all variables are worth analyzing further because they have val-ues larger than or equal to 0.5 (Field, 2009).
Based on Table 5, the result of the commu-nalities shows that the variables from the factor of human capital have a strong relationship with the factors that are produced, since each variable has a value greater than 0.5. Then, the analysis result of the total variance explained test shows that there is only one factor produced (factor 1), and it is also found that the value for the eigen-value is bigger than 1. Moreover, factor 1 men-tions varieties which are 71.474% and 82.997%. Since the values of the varieties and the eigen-value are high, factor 1 or the human capital factor can be a representative for a variety of variables.
Table 5. Factor of Human Capital Analysis Result
Test stages Factor of Human Capital Test Analysis Result
Kaiser-Meyer-Olkin of Measure Sampling Adequacy 0.500
Bartlett`s Test of Sphercity 0.000 (α = 0.05)
Anti Image Correlation 0.500 (SEER)1 ; 0.500 (TEER)2
Communalities (Extraction) 0.830 (SEER) ; 0.830 (TEER)
Total Initial Eigenvalues (Component 1) 82.997 % of Variance Initial Eigenvalues (Component 1) 82.997
Component Matrix 0.911 (SEER) ; 0.911 (TEER)
Notes: 1SEER is Secondary Education Enrollment Rate
2
2015 Lubis and Saputra 283
Table 5, in addition, shows that a component matrix of each variable has a high value that is bigger than 0.5. Therefore, each variable has a correlation with the factor produced. In short, it can be concluded that factor 1 can be formed as the factor of human capital by the SEER variable and the TEER variable.
The Second Stage (Panel Model)
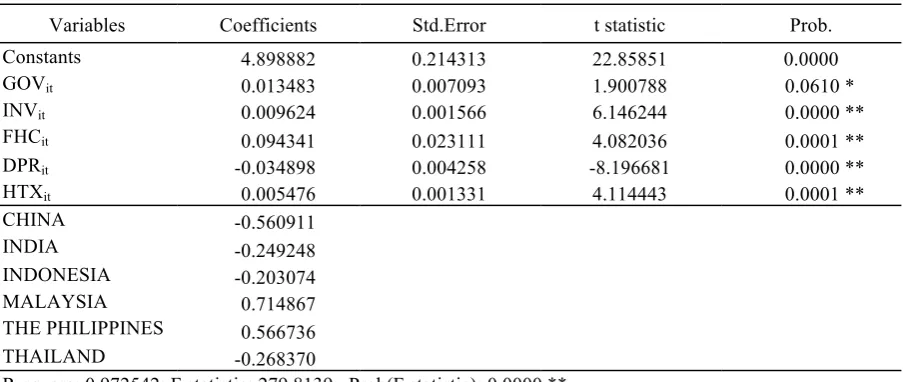
After conducting these steps to test the model with the panel data, the fixed effect model is recommended as the best model to use in this study. This study, therefore, focuses on the analysis of the result of the panel data regression by using the fixed effect method mentioned in Table 6. From the result of the analysis, the value of R2 is found to be as great as 0.97. The value of R2 concludes that the independent vari-able is very good at explaining its dependent variable. In addition, based on the significance test done simultaneously, statistic F value is as large as 279.813. It is bigger than the table F value of 2.32 and with a p-value of 0.000 or smaller than α (5%). Thus, the test rejects the null hypothesis and the independent variable (GOV, INV, FHC, DPR, and HTX) simultane-ously influencing its dependent variable (GDPP).
Table 6 shows the analysis result of the par-tial significance test and concludes that the test rejects the null hypothesis. The analysis result of GOVit or the variable of government expenditure
has a t statistic value of 1.90079 (bigger than the t table value = 1.6629). Therefore, GOV posi-tively and significantly influences the per capita GDP variable of a country during a certain period, to a maximum value of 0.013483. This is in line with Keynes theory stating that national income will increase when the government’s expenditure increases. The government’s expen-diture is a policy tool for economic growth and output fluctuations for the long term. The Keynesian model also states that cutting the government’s expenditure or reducing the fiscal deficit has a direct effect by decreasing aggre-gate demand (Branson, 1979; Levacic & Rebmann, 1991; Sudarsono, 2010). Accordingly, government expenditure has effects on produc-tivity and purchasing power. Based on Vanden-berg & Zhuang (2011), the correct macroeco-nomic policies, such as increasing workers’ wages, stabilizing taxes as well as improving public services and social insurance, can in-crease consumption as aggregate demand and productivity rise.
Table 6. Panel Regression Analysis Result of income per capita with Fixed Effect Model
Variables Coefficients Std.Error t statistic Prob.
Constants 4.898882 0.214313 22.85851 0.0000
GOVit 0.013483 0.007093 1.900788 0.0610 *
INVit 0.009624 0.001566 6.146244 0.0000 **
FHCit 0.094341 0.023111 4.082036 0.0001 **
DPRit -0.034898 0.004258 -8.196681 0.0000 **
HTXit 0.005476 0.001331 4.114443 0.0001 **
CHINA -0.560911
INDIA -0.249248
INDONESIA -0.203074
MALAYSIA 0.714867
THE PHILIPPINES 0.566736
THAILAND -0.268370
R-square: 0.972542; F statistic: 279.8139; Prob(F statistic): 0.0000 **
Journal of Indonesian Economy and Business September 284
The INVit variable, or investment
expendi-ture variable, has a t statistical value of 6.146244 (bigger than the t table value = 1.9886), so in-vestment expenditure has significant positive effects, as great as 0.009624 on the per capita GDP of a country during a certain period. That condition is in line with Keynes’ theory describ-ing investment expenditure as an important component in increasing total output. Based on Keynes, business output will increase if the expenditure level also increases. Greater busi-ness outputs can trigger productivity to increase its activity. The Republic of Korea and Japan have experienced this condition when they were in their period of transition from middle-income countries to high-income countries. The two countries were able to maintain their investment levels above 31% (World Bank, 2010).
The HTXit variable, or the high technology
export variable, also has a t statistical value of 2.636002 (bigger than the t table value = 1.9886), accordingly high technology exports bring positive and significant effects to the per capita GDP of a country during a certain period, by as much as 0.096580. A concept proposed by Schumpterian and Keynes explains that produc-tivity levels can be varied, because innovation and the use of technology can create new market segments so that a strong competitive ability can occur in the market (Mani, 2001; Saputra, 2014). In addition, Jankowska et al. (2012) stated that a diversification policy and an increase in product quality, as in high technology products, have helped countries in East Asia to improve their productivity.
The FHCit variable, or the human capital
factor variable, has a t statistical value of 4.390829 (greater than the t table value = 1.9886). The human capital factor significantly and positively affects the per capita GDP of a country during a certain period, by as much as 0.077028. A previous theory by Solow con-cerning economy growth showed that qualified resources are able to improve the efficiency and productivity of workers. Every country should have a policy to develop its human capital, and Singapore is one of the countries that has been successful in developing its human capital
resources, as a strategy of its national economic policy. Singapore, moreover, is the one country out of the 13 countries able to maintain a high-growth rate economy (more than 7%) for 25 years since the end of World War II (Osman-Gani, 2004; Lin, 2012).
The last variable, the DPRit variable, or the
dependency ratio variable, obtained a t statistical value of 13.47092 (larger than the t table value = 1.9886) so that there is a negative and significant effect from the dependency ratio on the per cap-ita GDP of a country during a certain period, by as much as 0.047632. In line with Mill’s theory, a person with a higher education tends to have a smaller family because they are more concerned with their career. In order to decrease the dependency ratio, reducing fertility levels through education can be one of the ways. The high urbanization levels of developing countries are the primary cause of unemployment, so the dependency ratio is kept high. Low skills pos-sessed by workers also make that condition occur. Therefore, investment in human resources can be used as a policy to solve the demographic problems in developing countries in Asia (Vandenberg & Zhuang, 2011).
Considering the analysis results that have been mentioned above, they prove that this study is in line with the theories used. Six countries, namely China, India, Indonesia, Malaysia, the Philippines, and Thailand, should focus on the variables determining their per capita income in order to escape from the middle-income trap. Government expenditure of its GDP in devel-oping Asian countries is still low. The World Bank (2010) notes some high-income countries have high governmental expenditure, such as the USA (17%), Japan (20%), and the Republic of Korea (15%). Unlike those countries, some Asian developing countries have low govern-ment expenditure. For instance, Indonesia’s expenditure is only 9% and the Philippines’ expenditure is 10%.
expen-2015 Lubis and Saputra 285
diture in the last few years. For example, China`s investment expenditure is 48%, India’s is 36%, and Indonesia’s is 32%. These numbers are as large as the ones by Japan and South Korea when they were in their middle-income stage. However, the production figures for high technology products in some developing Asian countries still tends to be low. Table 3 shows that the low R&D expenditure by these devel-oping countries is an indicator showing how lit-tle they have focused on improvements in their use of technology and innovation for their pro-duction methods.
In some Asian developing countries, the enrollment rate in tertiary education is still low. The factor of human capital has a role in improving workers’ skills so that the workers have high productivity. High-income countries are countries which succeeded in improving their human capital through public participation in tertiary education. These high-income coun-tries include the USA, Japan, and South Korea. Last but not least, the dependency ratio can be a factor in preventing the middle-income trap for a country. Based on Table 3, the dependency ratio of Asia’s developing countries is not signifi-cantly different from the dependency ratio of developed countries, excepting the Philippines which has a high dependency ratio. Meanwhile, South Korea is a high-income country having a low dependency ratio.
CONCLUSION
Some key variables, such as government expenditure, investment expenditure, high tech-nology exports, and the factors of human capital, have positive and significant effects on per cap-ita income. In contrast, the variable of demogra-phy has negative effects on per capita income.
The results of the analysis conducted for Asia’s developing countries reveals that the variable of expenditure has tended to increase in the last few years, as have investment levels. That condition had also been experienced by some developed countries (the USA, Japan, the UK, and South Korea) before they changed from developing to developed countries. However, the governments’ expenditure by Asia’s developing
countries is categorized as being consistently low. In addition, as Table 3 shows, the export of high technology products by developing Asian countries has tended to increase over the last few years. These developing countries should be more focused on improving their methods of innovation by increasing their R&D expenditure, in order to make them equal to the developed countries that generally are successful in im-proving their high quality products, as a result of their R&D spending.
Generally human capital factors in Asia’s developing countries have been improving. Yet, they still need further improvement so that the developing countries can equal the developed countries. Human resources investment also needs to be conducted in order to gain qualified and skilled workers. In general, the dependency ratio variable of developing countries in Asia has reached similar levels to that found in the devel-oped countries. However, low human resources and high levels of unemployment should be a concern to developing countries so that their demographic characteristics can give positive effects to the economies of the developing countries.
The factors giving positive effects must gen-erate high growth once the middle-income level is reached. Therefore, middle-income countries require new sources of growth to maintain sus-tainable increases in their per capita income. During the initial phase of low-income levels, low-income countries can compete in the inter-national markets by producing labor-intensive and low-cost products. Once these countries reach the middle-income level, productivity technology catch-ups are eventually exhausted. Unemployment and wages begin to rise. Conse-quently, they will lose their competitiveness in the world’s markets, then other low-income countries become engaged in phases of rapid growth.
Journal of Indonesian Economy and Business September 286
Singapore, and Taiwan have succeeded in advancing their industrialization. These coun-tries enabled high-tech induscoun-tries to accelerate their economic growth and they aimed their growth strategies at high value added economies. That idea is in line with Rostow’s (1959) con-cept about the leading sectors in European countries during the period when their econo-mies matured. Moreover, regarding that idea, a study related to the key sectors in either middle-income countries or countries categorized as being in the middle-income trap is worth con-ducting so that those countries can find the economic development model that is suitable for them use in their period of transition to becom-ing high-income countries.
REFERENCES
Asian Development Bank, 2011. Asia 2050: Realizing the Asian Century. Manila, Philippines: Asian Development Bank Agenor, C., and Jelenic, 2012. Avoiding
Middle-Income Growth Trap. World Bank Eco-nomic Premise. Avaliable at: http://siteresources.worldbank.org/EXT PREMNET/ Resources/EP98.pdf accessed February 3, 2014.
Aiyar, D., W. Puy and Zhang, 2013. Growth Slowdown and the Middle-Income Trap. Working Paper, Asia and Pacific Depart-ment. Washington DC: IMF.
Becker, G. S., 1975. Human Capital: A Theoriti-cal and EmpiriTheoriti-cal Analysis, with Special Reference to Education. New York, United States of America: Columbia University Press for NBER.
Branson, H, 1979. Macroeconomic Theory and Policy. New York /London: Harper and Row Publisher.
Campbell, R. Mc.Connel and L. B., Stanley, 1986. Contemporary Labor Economics. New York, USA: McGraw-Hill Book Com-pany.
Carnovale, M., 2012. Developing Countries and Middle-Income Trap: Predetermined to Fall?, Thesis, Leonard N. Stern School of Business. New York: New York University. Davis, L., 1982. Technology Intensity of U.S
Output and Trade. US Department of
Commerce, International Trade Administra-tion.
Egawa, A., 2013. Will Income Inequality Cause a Middle-Income Trap in Asia? Working Paper. Brussels: Bruegel.
Eichengreen, P., and Shin, 2013. Growth Slow-down Redux: New Evidence on the Middle-Income Trap. NBER Working Paper Series No. 18673, National Bureau of Economic Research, USA.
Felipe, J., 2012. Tracking the Middle-Income Trap: What is it, Who is in it, and Why? Part 2, ADB Economics Working Paper Series No: 307. Manila: Asian Development Bank.
Field, A., 2009. Discovering Statistics Using SPSS: Third Edition. London, United King-dom: Sage Publications.
Gill, I., and H. Kharas, 2007. An East Asian Renaissance: Ideas for Economic Growth. Washington DC, USA: World Bank.
Jankowska, N., and Perea, 2012. The Middle-Income Trap: Comparing Asian and Latin American Experience, Policy Insight No 96, OECD Development Centre. Paris: OECD. Jitsuchon, S., 2012. “Thailand in A
Middle-income Trap”. Thailand Development Research Institute Quarterly Review, 27 (2), 13-20.
Jones, C.I., and P.M. Romer. 2009. “The New Kaldor Facts: Ideas, Institutions, Popula-tions, and Human Capital.” NBER Working Paper Series 15094.
Kharas, H., and H. Kohli, 2011. “What Is the Middle-Income Trap, Why do Countries Fall into It, and How can it be Avoided?”. Global Journal of Emerging Market Economies, 3(3), 281-289.
Kuncoro, M., 2005. Ekonomi Pembangunan : Teori, Masalah, dan Kebijakan. Yogya-karta, Indonesia: Unit Penerbit dan Perceta-kan PN.
Levacic, R., and A. Rebmann, 1991. Macroeco-nomics. An Introduction to Keynesian-Neoclassical Controversies. 2nd ed. Lon-don, United Kingdom: Macmillan.
2015 Lubis and Saputra 287 Loizides and Vamvoukas, 2004. “Government
Expenditure and Economic Growth : Evi-dence from Trivariate Causality Testing”. Journal of Applied Economics, 8 (1), 125-152.
Mankiw, N. G., and W. M. Scarth, 2007. Macroeconomic. 3rd ed. New York: Worth Publishers.
Mani, S., 2001. Exports of High Technology Product in Developing Countries, Discus-sion Paper Series No 2001, Institute for New Technologies, The Netherland: The United Nation University.
Mill, J. S., 2009. The Collected Works of John Stuart Mill, Volume II – The Principles of Political Economy with Some of Their Applications to Social Philosophy (Books I-II), Edition of John M. Robson, Introduction by V.W Bladen.The Online Library of
Liberty. Available at:
http://www.econ.uba.ar/www/institutos/eco nomia/ceplad/hpe_
bibliografia_digital/john%20mill%20vol1.p df accessed 4 March 2016.
OECD, 2013. The People`s Republic of China, Avoiding The Middle-Income Trap: Policies for Sustained and Inclusive Growth, OECD. Available at: http://www.oecd.org/china /China-Brochure-eng-September2013.pdf accessed February 5, 2014.
OECD, 2014. Economic Outlook for Southeast Asia, China, and India 2014 Beyond the Middle Income Trap, OECD Development Centre Pocket Edition. Available at: http:// www.oecd.org/site/seao/Pocket%20Edition %20SAEO2014.pdf accessed March 4, 2014.
Osman-Gani, A. M., 2014. “Human Capital Development in Singapore: An Analysis of National Policy Perspective”. Advances in Developing Human Resources, 6 (3), 276-287.
PricewaterhouseCoopers, 2013. World in 2050, the BRICs and beyond: prospects,
chal-lenges, and opportunities, PwC UK Macro-economics Teams. Available at: http:
//www.pwc.com/gx/en/world- 2050/assets/pwc-world-in-2050-report-january-2013.pdf accessed March 4, 2014. Rostow, W. W., 1959. “The Stages of Economic
Growth”. The Economic History Review (New Series), 12 (1), 1-16.
Saputra, P. M. A., 2014. “Technical Efficiency and Export Performance: Evidence for Self-Selection Hypothesis from Indonesian Manufacturing Sector-Level Data”. Inter-national Journal of Economic Policy in Emerging Economies, 7 (4), 383-398. Srholec, M., 2005. High-tech exports from
developing countries: A symptom of tech-nology spurts or statistical illusion? TIK Working Papers on Innovation Studies Centre for Technology, Innovation and Culture (TIK). Oslo: University of Oslo. Sudarsono, H., 2010. “The Relationship between
Economic Growth and Government Spend-ing: A Case Study of OIC Countries”. Jur-nal Ekonomi Pembangunan, 11 (2), 149-159.
Tho, T. V., 2013. The Middle-Income Trap: Is-sues for Association of South East Asian Nation, ADBI Working Paper No 421, Asian Development Bank Institute. Tokyo: Asian Development Bank.
Todaro, M. P., and S. C. Smith, 2009. Economic Development. 10th ed. Boston, USA: Pear-son Addison Wesley.Vandenberg and Zhuang, 2011. How can China avoid the Middle-Income Trap, Asian Development Bank Working Paper. Available at: http://www.apeaweb.org/ confer /bus 11/papers/Vandenberg-Zhang.pdf accessed February 3, 2014