Copyright © The Author(s). All Rights Reserved. Published by American Research Institute for Policy Development DOI: 10.15640/jmm.v4n1a3 URL: https://doi.org/10.15640/jmm.v4n1a3
Determining Key Factors in Consumer E valuation of an Airport
Xiao Wang1, Mengnan Hong2 & Paul D. Berger3
Abstract
In this paper we perform a factor analysis on eleven variables involving attributes and usage of services at the San Francisco Airport (SFO), in order to determine, from among these variables, the underlying structure of the factors that are primary in leading a customer of SFO to his/her overall rating of SFO. We then perform a stepwise logistic regression analysis using these factors as independent variables, and an overall evaluation of SFO as the dependent variable, to find out how these factors affect the overall evaluation of SFO.
Key words: Factor analysis, Stepwise logistic regression, San Francisco airport (SFO), Use of technology at SFO, Survey data
Introduction
We use data collected at the San Francisco International Airport (SFO). A questionnaire was designed by SFO staff and was filled out by flyers from a random sample of flights. All airport terminals at SFO, and all boarding areas within these terminals, were utilized. Data were collected in mid-2013. First, we conducted an exploratory factor analysis using several variables as described below. The objective was to discover the underlying structure among these several variables. Then, using the factors derived from the factor analysis as independent variables, we performed a stepwise logistic regression with a binary dependent variable of the overall evaluation of SFO as "good/ outstanding" vs. "average or below," where an ordinal satisfaction-scale, described in more detail later in the paper, is divided into these two categories.
Literature Review
There have been a variety of studies that have examined satisfaction, loyalty, and overall evaluations of airports by consumers of (flyers at) specific airports. Mattazo et al. (2012), studied customer satisfaction at the Augusto Severo airport in Brazil. They determined that key variables affecting consumer attitudes toward the airport were confidence in the safety of the premises, waiting time for a taxi, availability and quality of seats in the airport, as well as prices of the food at terminal restaurants.
Suki (2014) considered passenger satisfaction with airline service at the major airport in Malaysia. His key finding was that customer service is a major determinant of the content of word-of-mouth and recommendations. A study at the Jordan airport by Al Refaie et al. (2014) considered the impact of aspects of flight performance and ticket pricing. They found that satisfaction was related to the reservation process, ticketing process, and perceived value. They also found that loyalty was driven most by service recovery, price and perceived value.
Chang (2013) examined factors affecting airport access mode-choice by elders at Taiwan Airport. His key finding was that the elderly strongly prefer to be driven to the airport by family members as opposed to taking a taxi, relative to the general population.
Baker (2013) examined not just one airport, but focused on several airports, while comparing different airlines. He found that the low-cost airlines received significantly better ratings on service quality than the legacy airlines. Harvey (1987) conducted the first study at the San Francisco Airport (SFO). He focused on choice of 3 airports in the San Francisco Bay area including SFO. He also distinguished between business travelers and non-business travelers. His main findings were that ground access time and frequency of direct flights to destinations were the key factors in airport choice. Hess and Polak (2005) also studied the different airports in the San Francisco area, including SFO, and found results similar to Harvey's. Ishii et al. (2009) did a subsequent study of 4 airports in the San Francisco Bay area, and found, for the most part, similar results to the previous two studies. A study by Wang et al. (2015) also considered the San Francisco Airport and studied the variables that drive satisfaction, both positively and negatively. The most influential variables were found to be three "negative" variables - driving down satisfaction: airport food rated unacceptable, airport shopping rated unacceptable, and level of information on monitors and screens rated as unacceptable. The most positive variable was directional signs in the airport being rated at outstanding.
The study in this paper considers only SFO, and was not concerned with choice modeling among airports. Indeed, our study considered very different variables than the all the other SFO studies cited. In addition, none of the other studies cited used exploratory factor analysis to home in on the underlying structure of important factors in determining consumer/flyer attitudes toward the specific SFO airport. There have also been examinations of other subjects at airports, such as employee satisfaction and aircraft scheduling. We do not consider these studies as relevant to our current study. There were some additional studies of various actions in airports outside of North America that either had very different goals as this paper, or did not indicate the importance of variables other than what was reported in the above cited papers.
Method
There were about 70 questions in the questionnaire and over 3500 people who filled out the questionnaire. E ach question can be viewed as a different variable; in this type of situation, it is not uncommon to factor analyze the questions (first) to produce a smaller set of "factors" that well represent the set of initial variables, and, if chosen to be so, these "factors" will be orthogonal to each other (Hair et al., 2010). This orthogonality may be very useful in subsequent analyses, such as regression analysis, discriminant analysis, and others; the interpretations of the results are aided by the lack of multicolinearity among the factors, representing the independent variables. We use eleven questions from the questionnaire in our exploratory factor analysis. We describe them below. Subsequently, we define and discuss our dependent variable.
Variables
The eleven variables used as input to the exploratory factor analysis are listed and defined in Table 1. The table uses the numbers in the questionnaire in order of appearance in the questionnaire; later, we shorten the notation. After presenting the table, we describe each variable's scale.
TABLE 1: Independent Variables
Q9F_OVE RALL.CLE ANLINE SS (How do you rate the overall cleanliness at SFO?) Q10_SAFE (How safe do you feel at SFO?)
Q11A_USE .WE B
Q11B_USE .SFO.MOBILE .APP
Q11C_USE .OTHER.AIRPORT-RE LATE D.APPS (Have you ever used XYZ?)
Q11D_USE .SFO.SOCIAL.ME DIA.CHANNE LS Q11E _USE .SFO.FRE E .WIFI
Q13_RATE .GE T.TO (Rate your experience getting to SFO today) Q14A_FIND (Rate the ease of finding your way around SFO)
The scale for Q9F_OVE RALL.CLE ANLINE SS was:
The scale for Q14A_FIND, and Q14B_SE CURITY was: 1= Unacceptable, consistency of scale direction. As a result, "1" stands for "no" and "2" stands for "yes" in these six questions:
As can be noted, the scales of answers in the 2 types of variables are not the same. The range of the first type is from 1 to 5 and the second is from 1 to 2. We standardize all the variables, using a "Z transformation" - thus, each variable has a mean of 0 and a standard deviation of 1. In this way, the importance of a variable won’t be over- or under-evaluated due to its magnitude.
The target variable, "Y," is the response to the question: How does the SFO A irport rate as a whole? The scale for this variable was:
1= Unacceptable 2= Below Average 3= Average 4= Good 5= Outstanding
6= Have never used or visited 0= Blank
After viewing 0 and 6 as missing values, we considered the five-point scale 1-5, and regrouped the variable into two categories. Those customers who rate SFO as Good or Outstanding (i.e., a rating of 4 or 5) are in the group, 1. Those who rate SFO as Average, Below Average or Unacceptable (i.e., a rating of 1-3) in the group, 0.
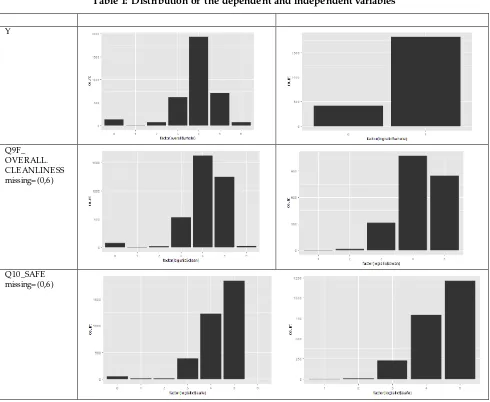
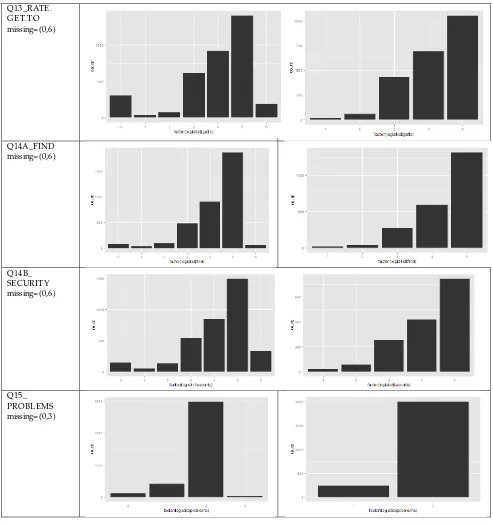
In Table 1, we see the distribution of each variable involved in the stepwise logistic regression model. The left side displays the original data and the right side displays the recoded data.
Table 1: Distribution of the dependent and independent variables
Y
Q9F_ OVE RALL. CLEANLINE SS missing= (0,6)
Q11A_USE .WE B missing= (0,3)
Q11B_USE . SFO. MOBILE . APP missing= (0,3)
Q11C_USE .OTHE R AIRPORT- RE LATED. APP missing= (0,3)
Q11D_USE . SFO. SOCIAL. ME DIA. CHANNE LS missing= (0,3)
Q13_RATE . GE T.TO missing= (0,6)
Q14A_FIND missing= (0,6)
Q14B_ SE CURITY missing= (0,6)
Q15_ PROBLEMS missing= (0,3)
E xtracting the Factors
We can see from Table 2 that the overall MSA is about 0.72, which suggests that the inter-correlations among the variables satisfy the requirements for conducting factor analysis. In addition, seen in Table 2, the measure of sampling adequacy for each variable is higher than 0.6, which also satisfies the requirement to keep the variable. The variables have now been given shorter labels/names.
Table 2: Overall MSA and Kaiser's measure of sampling adequacy
Kaiser's Measure of Sampling Adequacy: Overall MSA = 0.72296845
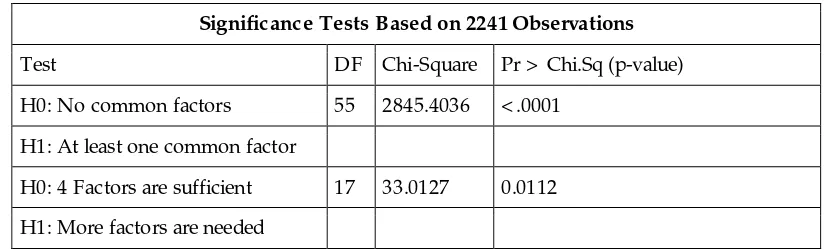
When the number of variables is between 20 and 50, factors that have eigenvalue greater than 1 (the "K aiser Criterion") are generally considered "legitimate factors." Since we have only 11 variables, we will not adopt directly the K aiser Criterion, but, rather, use significance testing to see how many factors should be sufficient for these variables. We set the significance level at 5%. From Table 3, we can see that 4 factors are not sufficient. (We started at 4 factors arbitrarily. Had 4 factors been sufficient, we would have then tested whether 3 factors were significant, and continued the process until we found the dividing line between how many were and were not sufficient?) The p-value = .0112 < .05, indicating that we reject H0 and conclude that more factors are needed.
Table 3: Significance testing for 4 factors
From Table 4, we can see that 5 factors are sufficient. We accept H0 with a p-value = .7745 > > .05, and as a result, we select having 5 factors as our mandate.
Table 4: Significance testing for 5 factors
In Table 5, we see the rotated factor pattern.
Table 5: Rotated Factor Pattern with 5 factors Significance Tests Based on 2241 Observations
Test DF Chi-Square Pr > Chi.Sq (p-value)
H0: No common factors 55 2845.4036 < .0001
H1: At least one common factor
H0: 4 Factors are sufficient 17 33.0127 0.0112
H1: More factors are needed
Significance Tests Based on 2241 Observations
Test DF Chi-Square Pr > Chi.Sq (p-value)
H0: No common factors 55 2845.4036 < .0001
HA: At least one common factor
H0: 5 Factors are sufficient 10 6.4681 0.7745
In Table 5, within factor 3, the variable safe has a comparatively high loading of 0.7 and other variables all have loadings lower than 0.4; it is the only factor satisfying these two conditions. The proportion of factor 3 explained by other variables are, thus, relatively small, and factor 3 is mostly explained by variable safe. To compare the variables purely from their meanings, safe also seems independent from the other variables (and, indeed, the factors are orthogonal and safe does not load highly on any other factor.) So, for simplicity and clarity, we exclude the variable safe
from the factor exploration and consider it as a factor by itself. Then, we ran a factor analysis with the remaining variables and four factors. The output is presented in Table 6.
Table 6: Rotated Factor Pattern with 4 factors
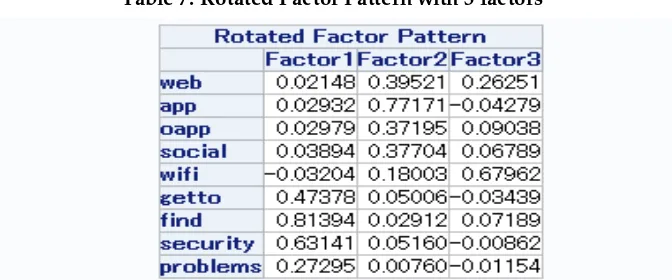
In Table 6, we can see that in factor 3, the variable clean has a comparatively high loading of 0.63 and other variables all have loadings lower than 0.4. (Factor 4 also satisfies the basic conditions; however, since the factors enter in general order of importance, we chose factor 3 over factor 4 for this next step.) For similar reasons as those stated above, we now exclude the variable clean from the factor exploration and consider it as a factor by itself. Then, we ran a factor analysis with the remaining variables and 3 factors. The output is presented in Table 7.
Table 7: Rotated Factor Pattern with 3 factors
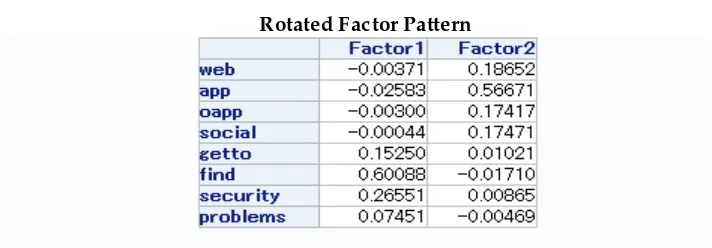
Table 8: Rotated Factor Pattern with 2 factors
Rotated Factor Pattern
In Table 8, we name factor 1 as convenience since find and security have the highest loadings and no other variable has a loading above .2. (We decided that the ability to easily find your way around the airport, and to have a good/better experience navigating the security screening, can reasonably be called "convenience." We, of course, recognize that the naming of factors is somewhat arbitrary, and understand that another group of analysts might choose a different name for factor 1.) We name factor 2 social media since app has by far the highest loading, and next group of higher loadings include web, oapp (other apps), and social, and the remaining variables have loadings that are virtually zero (lower than .02;) the same caveat about naming a factor holds for factor 2 also.
The above applied exploratory factor analysis aimed at determining the underlying structure among the original 11 variables. We used principal component factor analysis with orthogonal factors and varimax rotation. From the Table 9, we can see that the model is statistically significant and the MSA of every variable meets the requirement (> .5).
Table 9: Overall MSA and Kaiser's measure of sampling adequacy
In Table 10, we present the standardized scoring coefficients corresponding to the loadings in Table 8
Table 10: Standardized scoring coefficients
From Table 10, we have:
Convenience (Factor1) =
-.026*web - .021*app -.019*oapp - .010*social + .345*getto+ .433*find+ .406*security + .235*problems Social Media (Factor2) =
Logistic Regression
In order to have an even distribution of the two values (0 and 1), and to achieve a large sample, we randomly sampled, with replacement, 3,000 observations from each group, to form a new dataset of 6000 data points. The original data, after dropping the missing values (6's and 0's) have about 2650 1's and about 700 0's. In Table 11, initial output from the logistic regression, indicates that we have 3,000 observations for each value in the target variable.
Table 11: Initial classification table from logistic regression
Classification Tablea,b
We ran a stepwise logistic regression with the five factors extracted from the previous section as independent variables. The stepwise algorithm went through 3 steps and stopped after the third step, thus including three factors. Table 12 begins the output for the aforementioned 3rd step.
Table 12: Step 3 model summary for stepwise logistic regression
Model Summary
Step -2 Log likelihood Cox & Snell R Square Nagelkerke R Square
3 6138.268a .305 .406
a. E stimation terminated at iteration number 5 because parameter estimates changed by less than .001.
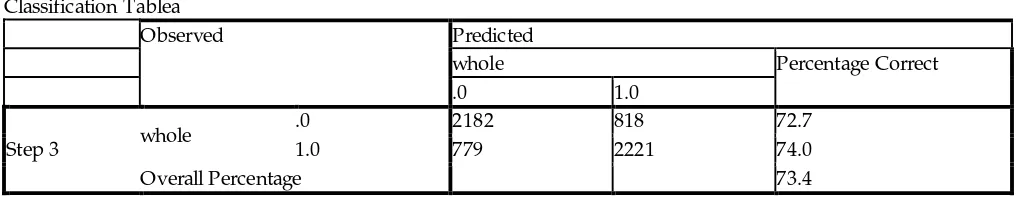
Table 13 displays the classification table for this 3rd (and final) step. The model classifies 72.7% of the 0 group and 74.0% of the 1 group correctly. The overall classification rate is 73.4%. If we were to use hypothesis testing to test whether 73.4% is higher than 50% (the percent we can guarantee to get correct without a model at all - just by "guessing" - sometimes referred to as the Cmax criterion), we would find a p-value close to zero, a clear indication that the regression model is, with virtually no doubt, able to predict better than without the model.
Table 13: Classification table for 3rd and last step of stepwise logistic regression
Classification Tablea
The three factors selected from the algorithm are convenience, safety and clean. The excluded variables, social media
and wifi have p-values of 0.799 and 0.203, respectively, were they to enter the model at a step 4; of course, they did not enter, since neither p-value is below .05.
Remembering that Y = 1 represents an overall rating of SFO of either good or outstanding, the step 3 regression equation is:
As in any logistic regression, the coefficients stand for the change in the Ln of the odds ratio per unit change of each factor, which is structured from standardized variables. As noted earlier, the Ln of the odds ratio pertains to a customer giving SFO a "superior" rating.
The Ln of the odds ratio of a customer having a superior rating of SFO increases by 0.950 when the standardized variable, clean, increases by 1 with the other factors/"variables” held constant. The Ln of the odds ratio of a customer having a superior rating of SFO increases by .406 when the standardized variable, safety, increases by 1 with the other factors/"variables” held constant. The Ln of the odds ratio of a customer having a superior rating of SFO increases by 0.455 when the standardized variable, convenience, increases by 1 with the other factors/"variables" held constant.
Clean appears to have the greatest impact per unit on overall rating of the SFO airport. While all coefficients
are positive, the coefficient of clean is more than double each of the other two coefficients. Table 14 displays the Step 3 results, including the statistics of the "Variables not in the E quation."
Table 14: Statistics of step 3 of the stepwise logistic regression
Variables in the Equation the "social media." at SFO (defined as use of the web, use of the SFO mobile app, use of other airport-related apps, and use of social media channels.) The first three criteria are apparently more important than the latter two, and per unit increase, cleanliness is indicated to have the largest impact on customers' overall evaluation of the airport.
If SFO needs to prioritize its expenditures, it should, in theory, first concentrate on the cleanliness of the airport, then the "convenience" for the customers; the latter, as noted above, includes getting to the airport, finding one's way around in the airport, more easily navigating the security process, and not having problems at the airport.
A feeling of safety is "statistically" the next most important factor. H owever, we can tell from common
sense that safety is an issue with zero tolerance, and likely is the true most important variable/factor of all; fortunately, the data indicate that the vast majority of responders rated the safety as outstanding, or at least, good. In reality, safety
It should be no surprise that the issue of technology should be increasingly prominent - essentially, the variable,
social media, stands for use of technology. These days, technology is increasingly important in most endeavors in life.
References
Al-Rafaie, Abbas, Bata, Nour, E teiwi, and Issam Jalham (2014), "E xamining Factors That Affect Passengers' Overall Satisfaction and Loyalty: E vidence from Jordan Airport," Jordan Journal of Mechanical and Industrial E ngineering, 8(2), p. 94-101.
Baker, David (2013), "Service quality and Customer Satisfaction in the Airline Industry: A Comparison between Legacy Airlines and Low-Cost Airlines," A merican Journal of Tourism Research, 2(1), p. 67-77.
Chang, Yu-Chun (2013), "Factors Affecting Airport Access Mode-choice for E lderly Air Passengers," Transportation
Research Part E : L ogistics and Transportation Review, 57, p.105-112.
Clancy, Kevin, Paul D. Berger, and Peter Krieg (2013), “Problems with Derived Importance Measures in Brand Strategy and Customer Satisfaction Studies,” Indian Journal of Mark eting, 43(1), p.5-13.
Hair, Joseph, William Black, Barry Babin, & Ralph Anderson (2010), “Multivariate Data A nalysis,” 7th edition, Upper Saddle River, NJ, Pearson Prentice-Hall.
Harvey, Greig (1987), "Airport Choice in a Multiple Airport Region," Transportation Research Part A : General, 21(6), p. 439-449.
Hess, Stephane, and John W. Polak (2005), " Mixed Logit Modeling Of Airport Choice In Multi-Airport Regions,"
Journal of A ir Transport Management, 11(2), p. 59-68.
Ishii, Jun, Sunyoung, Jun, and Kurt Van Dender (2009), "Air Travel Choices In Multi-Airport Markets," Journal of
Urban E conomics,65(2), p. 216-227
Mattozo, Teofilo C., Silva, Gutembergue S., Costa, Jose A., and Fernandes-Neto, Andre P. (2012), "Logistic Regression Applied to Airport Customer Satisfaction Using Hierarchical Quality Model," Intelligent Data E ngineering and
A utomated L earning - IDE A L 2012, Volume 74-35, p. 558-567.
Suki, Norazah, M. (2014), "Passenger Satisfaction with Airline Service Quality in Malaysia: A Structural Equation Modeling Approach," Research in Transportation Business and Management, 10(1), p. 26-32.