CHAPTER III
METHODOLOGY
This chapter discusses things related to the way this study is conducted. Research design, data collection methods which consist of population, sample and setting, research instruments, procedure of collecting the data, and data analysis and interpretation are explained in this chapter.
3.1 Research Design
The central issue of the research was to know the correlation between Emotional Intelligence and students‟ English speaking ability. This study applied the descriptive method with an ex-post facto design. Gay,L.R (1987) states that a descriptive method is a method of research that involves collecting the data in order to test hypothesis or to answer questions concerning the status of the subject of the study. Moreover, an ex-post facto design was used because it was suitable to investigate attributive variables which mean a kind of characteristics that should be possessed by the participants of study before a researcher began her study (Ary, et.al, 2010, p.331). In this study, the attributive variable was students‟ Emotional Intelligence, so that the variable could not be manipulated since it has been occurred in nature.
3.1.1 The Nature of Correlational Research
Correlational research is one of the descriptive research types which describe the existing condition (Brown, 1990). Thus, it describes what exists at the moment such as conditions, practices, processes, structures etc. It also means that correlational approach investigates the relationship between unmanipulated variables and does not use random assignment. Random assignments of participants and the manipulation of variables are absent in correlational research because the events of interest have already occurred or naturally occurring (Gay, 1987). Furthermore, random assignment is not used since there are no control conditions in this study. Students‟ emotional intelligence and their English speaking ability are something that cannot be manipulated. The level of emotional intelligence that the students possess is the condition of their recent capacity to utilize and understand emotion in the self and others. Moreover, the level of emotional intelligence is also the product of some connected factors, such as gender, age, life experience, environment, and educational background (Goleman, 2001; Tridhohanto, 2009 in Purnama, 2010). Therefore, the level of students‟ emotional intelligence cannot be manipulated since it is naturally occurring and the researcher did not give the students any treatment before.
Furthermore, variables to be correlated should be selected on the basis of some rationale (Gay, 1987). Gay further adds that the relationship to be investigated should be a logical one, suggested by theory or derived from experience. There are some rational reasons of choosing Emotional Intelligence and speaking skill as the variables in this study. Truthfully, this study is so much inspired by many previous studies on the role of EI in human life. In addition, it is also based on the researcher‟s experience who feels the effect of emotions in English language learning especially in speaking skill. Language anxiety sometimes hinders the researcher to speak English and there is always pressure of performing oral English presentation which results negative effects like awkward feeling, „blank‟ state, persistence worries, trembling, sweating, high heart rate and
dizziness. Therefore, it is believed that there is something that connects EI with speaking ability.
Theoretically, Salovey &Mayer (1990,p. 188) state that emotionally intelligent people will be able to deal with stress, predict consequences, communicate feelings, solve relationship problems, motivate themselves and even inspire others. According to Schutte, Schuettpelz & Malouffi (2001), people with higher emotional intelligence will perform better on cognitive tasks and they will be able to deal with frustration or helpless that may result from encountering very difficult task. In addition, prior studies have demonstrated that emotional intelligence has something to do with the success of foreign language learning (Pisghadam, 2009; Zarezadeh, 2013). Therefore, it can be assumed that emotional intelligence can help students to reduce their negative emotions that hinder them to speak English at class.
3.2 The Population, Setting and Sample of Research
3.2.1 Population and Setting
Population in this research was all fourth semester students in one of Private Universities located in Cimahi, Bandung. All students were majoring in English education study program. Moreover, the total population in this study was 156 students. The population was taken because of its accessibility and the research site was basically chosen because it was open to researcher who wanted to conduct the research there. Since the researcher was one of the teaching staffs there, the permission to do the research in this University was obtained.
3.2.2 Sampling and Sample
intelligence and students‟ English speaking ability without any intervention of other moderator variables such as English learning experience and so forth. The research sample was selected based on some criteria. The criteria of choosing the research sample were as follow:
1. English Learning Experience.
Students should have the same length of time in studying English with the assumption that the longer students study English, the better their English language proficiency will be. In relation to speaking qualification, students who have been learning English for 13 years are assumed to have better speaking performance than those who have just learnt English for 5 years. Therefore, students who have been learning English for 13 years are highly not compatible to students who have been learning English for 10 years. In this study, all of samples were students who have been learning English for 10 years and 6 months. 2. Length of Living in English Speaking Country.
Students should have the experience of staying in English speaking country. If not, all chosen students should never have any experience of living in English speaking country.
3. English Achievements.
Students should have any achievements in English study. If not, all chosen students should never get any achievements in English study. 4. English Teaching Background.
Students should have any experience of teaching English. If not, the chosen ones should never have any English teaching background. 5. Studying English in Courses
In addition, of 156 students study in this private university only 45 chosen students in this study were found to have the same background in studying English (See appendix. 10). Those 45 students have been learning English for ten years and six months in formal education. Moreover, they never take English courses before, never get any English achievements, never teach English before and never stay in English speaking country. Thereupon, the 45 students were assumed to have the same capacity and ability to speak English language. Furthermore, for a correlational study, 45 students were an acceptable sample size (Gay, 1987).
3.3 Research Instruments
Before applying two main research instruments, the sample had been selected based on some criteria. To know this aspect, a paper sheet had spread to 156 fourth semester students in order to gain their information about their length of English learning experience, their educational background, their experience in teaching English and their achievement in English subject. Then, two main instruments were used in this study. The following were the instruments which had been used to gain the data:
3.3.1 Questionnaire
This study used mixed model of Emotional intelligence as the basis of theory to measure students‟ emotional intelligence. Researchers in the mixed model tradition have typically used questionnaires to assess emotional intelligence (Schutte, et.al, 1998). The approach is based on the assumption that people have sufficient insight into their own emotions and real-life functioning for self-report to be valid (Zeidner, et.al, 2009, p.26).
Viswesvaran, 2007). Given the brevity of the questionnaire, it is quick and simple to administer and score within one class session and it takes less time to administer than the MSCEIT (see Chapter 2 Section 2.2.3.1) (Gardner, 2008). The second one relates to administration costs (Van Rooy & Viswesvaran, 2007). The use of self-report EI test is generally inexpensive and requires few resources for administration.
The questionnaire used in this study was Emotional Intelligence Scale which was originally constructed in Indonesian language by Daryono (2011). Therefore, it was not necessary to translate it to Indonesian language. This questionnaire had been tested its reliability and validity and had been confirmed as reliable and valid instrument. Further, the EI scale was in the form of a five-point likert scale ranging from „very seldom or not true of me‟ (1) to „very often true of me or very true of me‟ (5). The likert scale was chosen for some reasons. The likert scale is the most universal method for survey data collection which is easily understood (LaMarca, 2011). The responses were easily quantifiable and subjective to computation of some mathematical analysis (Bertram, 2007). It was also efficient to be used in terms of the researcher‟s time, effort and cost.
The instrument covers five dimensions of Emotional intelligence such as, self-awareness, self-control, self-motivation, recognizing emotion in others (empathy), and social skill.
Table.3.3 Five Dimensions of Emotional Intelligence
No Dimensions Indicators Items
1. Self-Awareness Recognizing one‟s emotions and their effects.
1,2,3,4,5
Knowing the influence of emotions towards the actions
6,7,8
Being aware of the effect of emotion to the action
9,10
2. Self-Control Being tolerance to the frustration 11, 12
Being able to handle anger effectively 13,14,15,16,17
Having positive feelings in the self and others
18,19
Being able to handle stress 20, 21
Being able to build social relationship 22, 23, 24
Accepting oneself 25, 26
Being able to handle negative emotion e.g regret
29, 30
3. Self-Motivation Being total to reach the goal of learning 31, 32, 33
Being optimist 34, 35, 36
Being responsible 37, 38
4. Recognizing emotions in others (Empathy)
Being tolerant to others‟ opinions 39, 40
Being sensitive to others‟ emotions 41, 42, 43, 44, 45
Willing to listen others‟ opinions 46, 47, 48
5. Social skill (Handling relationship) Having good understanding about the importance of social relationship with others
49, 50,51
Being able to solve the social conflict 52, 53, 54
Having good communication ability 55,56
Being friendly and easily in socializing Regarding an Emotional Intelligence Scale employed in this study, several clear instructions were given in both oral and written way before asking the participants to fill in the questionnaire.
3.3.1.1 Validity and Reliability of Emotional Intelligence Questionnaire
An EI questionnaire used in this study should be valid and reliable. It is because a research must employ a valid and reliable instrument (Sugiyono, 2013, p.169). By using the valid and reliable instruments in collecting data, it is highly expected that the result of the study will be valid and reliable too.
The instrument which is based on the appropriate theory written on the literature review can be stated as a valid instrument (Sugiyono, 2013). This instrument has been constructed based on five dimensions of Emotional Intelligence in Goleman. Goleman (1996) states that there are five dimensions of Emotional Intelligence; self-awareness, self-control, self-motivation, recognizing emotions in others (empathy), and social skill. Therefore, this instrument is constructively valid.
Moreover, to test the construct validity, the judgments from experts had already employed in this study. The judgment was done by three experts and had already reviewed by the supervisors from Educational Psychology and Guidance Program (Daryono, 2011, p.104). Three experts were three master students majoring in the same program as the supervisors come from.
Furthermore, the reliability refers to the extent to which measurements are consistent. According to Green (2005), valid instrument is always reliable but a reliable instrument may not always be valid. Based on this assumption, Emotional Intelligence scale is considered to be reliable. Additionally, this questionnaire had been tested its validity and reliability statistically. Besides, three experts had been asked by Daryono to review and judge all items on this questionnaire.
3.3.2 Speaking test
Speaking test was used to know students‟ English speaking ability. Speaking test was important to be conducted as an attempt to know the students‟ ability to comprehend the meaning in a variety of tasks. Therefore, the students received a single score reflecting their performance (Douglas in Hughes, 2002, p. 83).
understood. The type of speaking test was speech and students were asked to deliver an English speech in front of the class. The reason of choosing this speaking test type was because this research intended to see whether students‟ emotional state has any connection with their speaking performance. The main topic was given to students and they should be able to perform it in front of the class. To measure the students‟ speaking ability, the researcher used analytic scoring rubric.
3.3.2.1 Validity and Reliability of Speaking Test
Speaking test implemented in this research should be valid and reliable. A valid test is measured what is intended to measure accurately (Hughes, 1990,p.76 as cited in Sak,2008,p.14). Thus, the assessment becomes valid when the test assesses what it claims to assess and tests what has been taught.
3.4 Procedure of Collecting Data
The procedures of data collection including the administration and scoring procedures are presented as follows:
The data were collected in two sections. The first section was spreading the Emotional Intelligence scale. In order to re-determine the validity of the instruments used, the researcher asked the supervisor to check whether the statements of the questionnaire were really designed in accordance to the research questions. Furthermore, in order to motivate students to join to this research, the objective of the study had been explained to them both in oral and written way. In avoiding the misunderstanding, all the instructions were given in Bahasa Indonesia. It took 20-25 minutes or more to complete, although there was no formal time limit. The samples were asked to answer all questionnaire items carefully.
The second section was administering English speaking test. The researcher collaborated with the English speaking lecturer had prepared the students to face the speaking test. Students were told to deliver an English speech
with “Education in Indonesia” as the main theme. They had a week to prepare all
the things and they were allowed to bring their speech outline. Furthermore, students only had 5 to 10 minutes to deliver their English speech. In the research, Two qualified relevant lecturers had helped the researcher to assess the students‟ speaking performance (see Appendix.8 for the assessors‟ profile). It was for avoiding the subjectivity of the researcher to gain the data.
3.5 Scoring Procedures
from 1 to 5. Therefore, the measure yielded the global score ranging from 66 to 330. It means that the highest score was 330 while the lowest score was 66.
On the other hand, students‟ speaking performance was assessed based on speaking scoring rubric with the score ranging from 6 to 30. Hence, the lowest score was 6 while the highest score was 30. Furthermore, the students‟ performances were recorded and assessed later by the examiners. This method has some advantages and disadvantage. The disadvantage of the taped test is that it is less personal, the examinee is talking to a video and not to a person (Cartier, 1980 in Fulcher, 1993). Moreover, the taped test is inflexible. It means that if something goes wrong during the recording , it is virtually impossible to adjust for it.
However, taped speaking test has some advantages. Cartier (1980, as quoted in Fulcher, 1993, p. 76) states that taped test is very practical when it comes to test a large number of students. It is also more objective since each student receives identical stimuli (ibid.p.76). The scoring can be performed at the most convenient or economical time and location.
3.6 Data Analysis and Interpretation
3.6.1 The Data Analysis
3.6.1.1 Analyzing Students’ Emotional Intelligence and their English Speaking Ability
This study described the present condition of students‟ emotional intelligence level and their English speaking ability. The taken data such as students‟ emotional intelligence and their speaking ability will be presented and described in detail in chapter IV. In order to present the data in the first part, the researcher analyzed the questionnaire of emotional intelligence and students‟ English speaking ability by using the appropriate formula.
The questionnaire of Emotional Intelligence comprised 66 brief items and employed a 5 points likert scale. It rendered a total EQ score, consisting of five aspects of emotional intelligence, namely (1) self-awareness (2) Self-control or managing emotions in the self, (3) self-motivation, (4) managing others‟ emotions (empathy), and (5) social skills or handling social relationship. To get the total EQ score, all the scores (factors 1 to 5) had to be added. The maximum score was 330 and the minimum score was 66. Furthermore, each dimension had to be scored and classified as high, average and below average (Daryono, 2011). The formula used to categorize the level of emotional intelligence was as follow.
1. The high level : If X > HM + SD (1.25)
2. The average level : If HM + SD (0.25) < X < HM + SD(1.25) 3. The low level : If X < HM+SD(0.25)
(Daryono, 2011,p.112). HM stands for hypothetical mean or ideal mean. HM was obtained by multiplying the total valid item to three. In addition, standard deviation was done by dividing the range (the difference between the highest score and the lowest score) with six (please see appendix.3).
Therefore, after calculating the data, the categorization of emotional intelligence was as follow.
Table.3.4 Categorization of Emotional Intelligence
Above 253 High
209 – 253 Average
Below 209 Low
Meanwhile, every single dimensions of emotional intelligence was also categorized by using the above formula. Table.3.5 below explains the categorization of self-awareness as the first dimension in emotional intelligence.
Table.3.5 The Categorization of Self-Awareness
Total Score (SA) Interpretation
Above 38.32 High
31.66 – 38.32 Average
Below 31.66 Low
Furthermore, the second dimension of emotional intelligence had been classified as follow.
Table.3.6 The Categorization of Self-Control
Total Score (SC) Interpretation
Above 76.6 High
63.32 – 76.6 Average
Below 63.32 Low
Total Score (SM) Interpretation
Above 30,66 High
25,33 – 30,66 Average
Below 25,33 Low
Then, the fourth and fifth dimensions in Emotional intelligence are empathy and social skill which had already been calculated their categorization. The following table presents them.
Table.3.8 The Categorization of Empathy
Total Score (Empathy) Interpretation
Above 38,32 High
31,66 – 38,32 Average
Below 31,66 Low
Table.3.9 The Categorization of Social Skill
Total Score (EQ) Interpretation
Above 69 High
57 – 69 Average
Below 57 Low
assignment (Nakamura & Valens, 2001 as cited in Rahman, 2010). Besides, using rubrics in speaking will reduce grading time. Teacher does not need to think repeatedly to give the score towards the students‟ speaking ability (Kitao & Kitao, 1996).
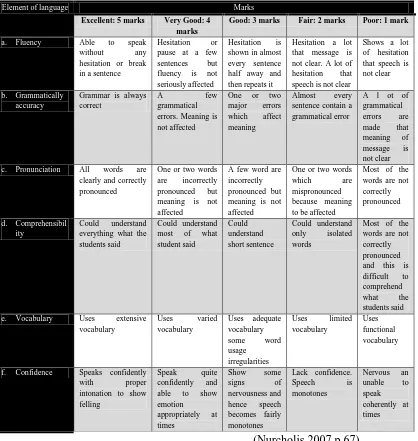
Table 3.9 presents the criteria of scoring students‟ speaking performance. Table.3.9 Speaking Scoring Rubric
Element of language Marks
Excellent: 5 marks Very Good: 4 marks e. Vocabulary Uses extensive
vocabulary
Moreover, the result of the test was analyzed by using descriptive statistics because the data cannot be used for generalizing results beyond the context and research participants. This study used this following formula :
∑
Where:
Average score y (speaking ability)
∑ The sum of y score
N = The number of students
Based on students‟ average score on speaking test, their speaking performance would be categorized into five classifications of speaking performance, namely:
Table.3.10 Classification of Students’ Speaking Performance
Mean Classification
1 – 1.9 Poor
2 – 2.9 Fair
3 – 3.9 Good
4 – 4.9 Very Good
5 Excellent
3.6.1.2 Analyzing the Existence of Relationship between Emotional
Intelligence and English Speaking Ability
Furthermore, to be more specific, this study also tried to find out the relationship between five dimensions in emotional intelligence and six elements in speaking test (fluency, grammatical accuracy, comprehensibility, pronunciation, vocabulary, and confidence). It is interesting to know which one of five dimensions in emotional intelligence has the highest relationship with each six elements in speaking ability.
To determine which correlation formula would be used, the distribution data were tested its normality. The researcher used the “Statistical Package for Social Sciences” (SPSS for windows) version 20 to test the normality of data.
Table.3.11 Tests of Normality
One-Sample Kolmogorov-Smirnov Test
emotional_intellige
nce
speaking_ability
N 45 45
Normal Parametersa,b Mean 224,9778 224,2444
Std. Deviation 14,18785 17,46705
Most Extreme Differences
Absolute ,108 ,095
Positive ,108 ,095
Negative -,095 -,071
Kolmogorov-Smirnov Z ,721 ,637
Asymp. Sig. (2-tailed) ,676 ,812
a. Test distribution is Normal.
b. Calculated from data.
3.6.1.3 Analyzing which dimensions of Emotional Intelligence can mostly
Predict English Speaking Ability
To know which dimension of Emotional Intelligence can mostly predict the students success in English speaking, multiple regression analysis with stepwise method was also employed through SPSS statistic software as well. Multiple stepwise regression analysis was applied when the researcher wanted to determine which of all the independent variables best predicts performance on the dependent variable (Hatch & Lazaraton, 1990 p.480).
Moreover, independent variables used to predict dependent variable in this study were five dimensions of emotional intelligence. They are self-awareness, self-control, self-motivation, empathy, and social skill. Dependent variable was students‟ English speaking ability.
3.7 The Data Interpretation
The data can be interpreted after the value of the observed r is consulted to the value of the critical r table). In other words, the result of correlation coefficient between X and Y is consulted to Pearson Product Moment table on the level of significant 5%. If the observed r is higher than the critical r at the significant level of 5 %, it means that there is positive correlation between two variables. A coefficient near + 1.00 has a high size and a positive direction (Gay, 1987, p.193). It represents a high degree of relationship and can be interpreted that a person with a high score on Emotional Intelligence test is likely to have a high score on speaking test and vice versa.
Furthermore, Gay (1987) gives more explanation in interpreting the data as the following criteria:
a.If the coefficient is near +1.00, the variables are positively related b.If the coefficient is near .00, the variables are not related
c.If the coefficient is near -1.00 the variables are inversely related. Colton as cited in Yusuf (2003) explains that the strengths of two variables can be interpreted quantitatively into four interpretations:
1.If r value = 0.00 – 0.25 means there is no relationship / the relationship is weak.
2.If r value = 0.26 – 0.50 means the relationship is moderate 3.If r value = 0,51 – 0.75 means the relationship is high
4.If r value = 0.76 – 1.00 means the relationship is so high and almost perfect.
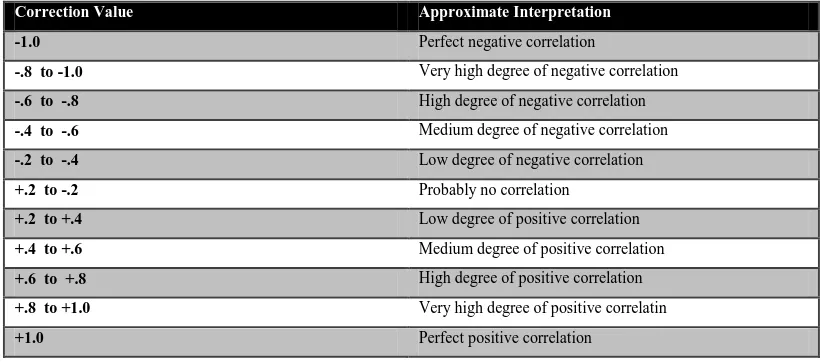
In addition, Emra (1998) as cited in Darmawan (2009) explains a detail interpretation of correlation coefficient in the following table:
Table. 3.12 The Interpretation of Correlation Coefficient
Correction Value Approximate Interpretation
-1.0 Perfect negative correlation
-.8 to -1.0 Very high degree of negative correlation
-.6 to -.8 High degree of negative correlation
-.4 to -.6 Medium degree of negative correlation
-.2 to -.4 Low degree of negative correlation
+.2 to -.2 Probably no correlation
+.2 to +.4 Low degree of positive correlation
+.4 to +.6 Medium degree of positive correlation
+.6 to +.8 High degree of positive correlation
+.8 to +1.0 Very high degree of positive correlatin
+1.0 Perfect positive correlation
1. If the observed r is bigger than the critical r at the significant level of 5 %, H0 is rejected and Hi is accepted. Thus, there is positive correlation between variable X and Y.
2. If the observed r is lower than the critical r at the significant level of 5 %, H0 is rejected and Hi is accepted. Hence, there is no correlation between these two variables.
3.8 Concluding Remark