THE RELATIONSHIP BETWEEN ENVIRONMENTAL PERFORMANCE AND FINANCIAL PERFORMANCE
AMONGST INDONESIAN COMPANIES
SUSI
University of Lampung
ABSTRACT
This study examined the relationship between environmental performance and financial performance amongst Indonesian companies. The environmental performance is measured by corporate environmental ratings provided by Bapedal through a program, called PROPER, while the financial performance is measured by return on assets (ROA). Five control variables are also included in this analysis, namely: total assets, industry sector, ISO 14001 certification, stock exchange listing, and percentage of export. The sample were taken from 252 companies in the PROPER list, 266 in National Database of ISO 14001 certification, and 1000 Major Non-financial Indonesian Companies by CISI Raya Utama, resulted in 87 usable companies. A regression analysis was used to test the relationship between environmental performance and financial performance. The study revealed while financial performance is not significantly associated with environmental performance, company size, stock exchange listing and ISO 14001 are significantly associated with environmental performance. This finding also indicates that the government environmental rating is highly consistent with international environmental certification.
Keywords: environmental performance, financial performance, return on assets, ISO 14001 certification.
INTRODUCTION
The question of whether or not environmental performance is associated with financial performance has been a long-standing debate among the researchers as well as business society. Is going green good for profits? Do reputable companies concern about their environmental reputation and performance? Some may argue that going green costs more as design and systems should be changed to the more environmentally friendly. However, others believe that the capital market and product/service market do appreciate green companies and green products/services, and therefore environmental performance should have positive effects on financial performance.
Previous studies on relationship between the two have been conflicting. Some studies showed significant positive relationship, while others found it insignificant. So far, there has not been a study showing significant negative relationship between the environmental performance and financial performance.
Most of these studies come from developed economies such as USA and Europe, where environmental awareness is considered high. However, there have been few studies on environmental performance within developing countries. This may due to the lack of established measures on environmental performance, and/or the low accuracy and reliability of the measurement itself.
evaluation results in the form of environmental ratings through mass media. The five colour-code rating is used to describe each company from best to worst: gold, green, blue, red and black.
This study is aimed to discover the relationship between corporate environmental performance and financial performance in Indonesia. The 2000 government rating (PROPER) was used to measure the environmental performance as the dependent variable and ROI was chosen as independent variable. Some control variables are also included, namely: total assets, industry sector, ISO 14001 certification, stock exchange listing, and percentage of export were used as control variables of the environmental performance.
LITERATURE REVIEW AND HYPOTHESIS DEVELOPMENT
The earliest study on the relationship between environmental or social performance and financial or economic performance was probably the one by Ullmann (1985). He presented a descriptive analysis of prior social-responsibility studies that, in aggregate, report mixed empirical results of pair-wise associations between environmental performance and economic performance and between environmental performance and environmental disclosure, and between environmental disclosure and economic performance.
The most recent study on this issue was done by Al-Tuwaijri et al. (2004). The authors integrated the three variables and found out that “good” environmental performance is significantly associated with “good” economic performance, and also with more extensive quantifiable environmental disclosures of specific pollution measures and occurrences.
In between the two studies, a number of studies have also been conducted to answer the question of whether or not environmental performance and/or environmental disclosures is related to financial performance. The results have been mixed on the question whether the two variables are associated. Among those whose findings showing positive relationship are studies by Bragdon et al. (1972), Spicer (1978), Narver (1971), and Porter et al. (1995). Later researchers found the relationship between environmental performance and financial performance is insignificant (Rockness et al., 1986; and Freedman et al., 1992). A negative relationship between environmental performance and financial performance is probably consistent with traditional economic thought that depicts this relation as a trade-off between firm’s profitability and acting on its social responsibility (Friedman, 1992). However, so far studies on negative relationship between environmental performance and financial performance have not been found.
Most empirical studies on this issue come from developed countries, where environmental awareness among the stakeholders is considered high and the environmental performance measurement has been established for more than a decade. Companies are believed to be left behind if they can not compete with others within societal constraint characterized by ever-increasing environmental accountability.
On the other hand, there is very limited number of studies on environmental performance in developing countries. Even in more developed Asian countries, such as Hong Kong and Singapore, reports on environmental performance are still very little as compared to that of the USA or Europe (Ho et al., 2001). A study in Singapore suggested some other reasons such as lack of government pressures and lack of perceived benefits as well as perception that organization does not have any environmental impact (Perry et al., 1998). Another study in Malaysia mentioned some factors such as: high environmental costs and lack of stakeholders’ appreciation (Thompson et al., 2004). Some other possible explanations are the low level of environmental awareness among the stakeholders and inexistence of environmental performance measures. Even if they exist, other issues on the accuracy and reliability of the measures may arise.
variables for the financial performance. However, a study by Freedman et al. (1992) used environmental performance as dependent variable and financial performance as independent variables.
In relation to environmental performance, there are also a number of studies relating this to other factors such as environmental disclosures (Ingram et al., 1980), environmental reputation (Hughes, 2001 and Toms, 2002), and environmental management (Schaltegger, 2002).
Measuring Environmental Performance
There are a number of different ways to measure environmental performance used in the literature. The most common measure is the one issued by US-EPA (Environmental Protection Agency) that measures the level of pollution compliance to environmental regulation (Verma et al, 2001). Salama et.al (2004) and Toms (2002) employed corporate reputation index of Britain’s MAC published in Management Today as a proxy to measure corporate environmental performance. Yet, other researchers used different measures. For example, Ingram et al. (1980) and Freedman et al. (1992) used the pollution index by Council on Economic Priorities in the USA, Hughes et al. (2001) used environmental disclosure, and Gupta et al. (2000) used environmental rating provided by a reputable environmental NGO. Schaltegger et al. (2001), on the other hand, suggested that research and business practice should focus more on eco-efficiency as the measure of environmental performance. Eco-efficiency is a ratio of value added and environmental impact added (Scaltegger at al. 2000).
Whatever measure is used to proxy environmental performance, a researcher should be assured that it is valid. According to Verma et al. (2001) measures of corporate environmental performance need to be objective, accurate and reliable in order to meet the objectives of the stakeholders interested in this information. Another important issue for a researcher is the availability of the measures, this is particularly essential for those conducting the study of emerging markets, because such measures often are not available.
The measurement of corporate environmental performance in Indonesia has been initiated in 1995, when the government of Indonesia, through its Bapedal (Badan Pengendalian Dampak Lingkungan), introduced a program, called PROPER. In this evaluation each company’s operating facility is assessed and measured in their compliance to environmental standards. The results are given in five-colour-code ratings; from best to worst: gold, green, blue, red and black (Wheeler, 1996). The first result was announced to the public through the mass media in 1996 (Bapedal, 1996). However, the program was postponed following the economic crisis in 1997 and just restarted in 2000 with the result announced in 2003. There were only 87 companies evaluated in the first evaluation in 1995 (announced in 1997), increased up to 252 in 2003. The Bapedal is planning to increase the number of companies to 500 in 2004 evaluation.
It is widely known that Indonesia is among the countries that lack transparency, monitoring and governance, especially those activities of programs conducted by the government agencies. Not surprisingly, the corporate environmental rating (PROPER) issued by the government has brought about the questions of independence and reliability. Voices from environmental NGOs and companies being rated black (the worst performer) by PROPER created suspicion on the evaluation conducted (Media Indonesia, November 5 ,2002; and Republika, 28 December 2004). It would be beneficial to compare this government rating with an international standard of environmental certification, ISO 14001 to find out whether or not they are consistent with each other.
Measuring Financial Performance
(TSR) and total business return (TBR), (3) Value Measures (economic value added (EVA), market value added (MVA), cash value added (CVA) and shareholder value (SHV).
Previous studies on environmental performance or reporting have used different measures of financial or economic performance. For example, Bragdon and Marlin (1972) used accounting based measures (earning per share and return on equity), while Spicer (1978) used both accounting-based and market-based measures (profitability and the price-earning ratio). In this study, however, it is not possible to use market-based financial performance measures as our data consists of listed and unlisted companies.
Freedman et al (1992) argue that the financial performance of a firm is ultimately reflected in corporate profits. Rate of return on equity and rate of return on assets are the two commonly used measures of long-term profitability. In order to examine the impact of environmental performance on financial performance, this study used return on assets (ROA).
Despite some weakness of accounting ratios such as ROI being influenced by the selection of accounting methods, this ratio provides information which enables researchers to conduct analysis on the association between environmental performance and financial performance. One advantage of using ROI as compared to Net Profit is that Net profit measures profitability in absolute term and neglects the firm size.
Relationship between Environmental Performance and Financial Performance As mentioned above, there has been a number of research conducted on the relationship between environmental performance and financial performance, using different measures of dependent, independent and control variables. The shift between environmental performance and financial performance as the dependent and independent variables is also acceptable as long as it is supported with reasonable arguments.
The Control variables commonly used in the previous studies are including: firm size, industry sector, firm risk, degree of internationalisation (proxied by level of export or international expatriate), and ownership (Elsayed et al., 2004; Al-Tuwaijri et al., 2004; Adams et al., 1998.
In this study, however, the dependent variable is the environmental ratings provided by Bapedal in PROPER program, and the independent variable is firm return on assets (ROA). A series of control variables included in this study are: total assets, industry sector, percentage of export, ISO 14001 certification and stock exchange listing. These variables are used in order to control for the potential influences of financial performance on environmental performance. The use of first three variables are consistent with previous literature, while the use of stock exchange listing is based on the argument that listed companies are concerned more about their environmental reputation. In addition, ISO 14001 certification was used to test whether or not the government environmental rating is consistent with the international standard of environmental certification.
Hypothesis
Based on the literature section above, the hypothesis posed in this study is: Ho : There is no association between environmental performance and financial
performance amongst Indonesian companies
The alternative hypothesis would be that there is association between environmental performance and financial performance of Indonesian companies. The sign of this association will determine whether this association is negative or positive.
RESEARCH METHODOLOGY
Dependent, Independent, and Control Variables
of environmental performance to financial performance these variables are also included in the analysis: total assets, industry sector, stock exchange listing, ISO 14001 certification, and percentage of export. The rationale of using those control variables is as explained in the previous section. Dummy variables are used for the values of industry sector (1-7) and Stock Exchange Listing (0 if unlisted, and 1 if listed). The other variables used the real values from the data sources.
Population and Sample
The population of this study were taken from these sources:
a. 252 company facilities in PROPER rating issued by Bapedal in 2003 (based on 2000 evaluation).
b. 1000 Major Non-Financial Companies in Indonesia year 2000 by CISI Raya Utama, Jakarta.
c. 266 companies listed in ISO 14001 National Database (as of year 2000) from the official website of Kementerian Lingkungan Hidup Indonesia.
Each data source consists of listed and unlisted companies.
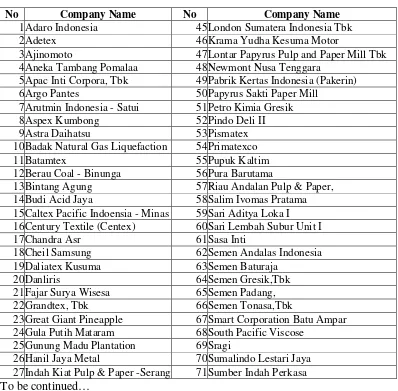
After matching those data sources into a common list, 87 companies were obtained as usable data as shown in Table 1. This consists of 23 listed companies and 64 unlisted companies.
Table 1. List of usable companies
No Company Name No Company Name
1Adaro Indonesia 45London Sumatera Indonesia Tbk
2Adetex 46Krama Yudha Kesuma Motor
3Ajinomoto 47Lontar Papyrus Pulp and Paper Mill Tbk 4Aneka Tambang Pomalaa 48Newmont Nusa Tenggara
5Apac Inti Corpora, Tbk 49Pabrik Kertas Indonesia (Pakerin)
6Argo Pantes 50Papyrus Sakti Paper Mill
7Arutmin Indonesia - Satui 51Petro Kimia Gresik
8Aspex Kumbong 52Pindo Deli II
9Astra Daihatsu 53Pismatex
10Badak Natural Gas Liquefaction 54Primatexco
11Batamtex 55Pupuk Kaltim
12Berau Coal - Binunga 56Pura Barutama
13Bintang Agung 57Riau Andalan Pulp & Paper,
14Budi Acid Jaya 58Salim Ivomas Pratama
15Caltex Pacific Indoensia - Minas 59Sari Aditya Loka I 16Century Textile (Centex) 60Sari Lembah Subur Unit I
17Chandra Asr 61Sasa Inti
18Cheil Samsung 62Semen Andalas Indonesia
19Daliatex Kusuma 63Semen Baturaja
20Danliris 64Semen Gresik,Tbk
21Fajar Surya Wisesa 65Semen Padang,
22Grandtex, Tbk 66Semen Tonasa,Tbk
23Great Giant Pineapple 67Smart Corporation Batu Ampar 24Gula Putih Mataram 68South Pacific Viscose
25Gunung Madu Plantation 69Sragi
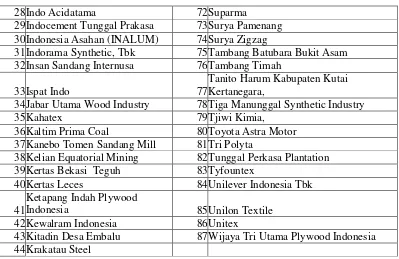
Table 1 (Continue)
28Indo Acidatama 72Suparma
29Indocement Tunggal Prakasa 73Surya Pamenang 30Indonesia Asahan (INALUM) 74Surya Zigzag
31Indorama Synthetic, Tbk 75Tambang Batubara Bukit Asam 32Insan Sandang Internusa 76Tambang Timah
33Ispat Indo 77
Tanito Harum Kabupaten Kutai Kertanegara,
34Jabar Utama Wood Industry 78Tiga Manunggal Synthetic Industry
35Kahatex 79Tjiwi Kimia,
36Kaltim Prima Coal 80Toyota Astra Motor 37Kanebo Tomen Sandang Mill 81Tri Polyta
38Kelian Equatorial Mining 82Tunggal Perkasa Plantation 39Kertas Bekasi Teguh 83Tyfountex
40Kertas Leces 84Unilever Indonesia Tbk
41
Ketapang Indah Plywood
Indonesia 85Unilon Textile
42Kewalram Indonesia 86Unitex
43Kitadin Desa Embalu 87Wijaya Tri Utama Plywood Indonesia
44Krakatau Steel
Data Analysis
Data analysis in this study was initially done by calculating the values of each variable as mentioned above and put them in the analysis cells. The next step was to determine the model, which is
Y = b0 + bi Xi + e
With Y = environmental performance/rating b0 = constant variable
X1 = ROA X2 = total assets X3 = industry sector X4 = stock exchange listing X5 = percentage of export e = standard errors
The model was then tested using regression analysis, following a series of test to fulfil its classic assumptions. These are including tests of: autocorrelation, multicollinearity, and heteroscedacity. The regression analysis is used to perform: normality test, goodness of fit test, F test and t test.
RESULTS AND ANALYSIS
Having the tests that the three classic assumptions of regression analysis were fulfilled, the regression analysis resulted the following findings:
Table 2. Model Summary
Model Summaryb
.515a .265 .209 .708 1.935
Model 1
R R Square
Adjusted R Square
Std. Error of the Estimate
Durbin-Watson
Predictors: (Constant), percentage of export, Total Assets, SX Listing, Return on Assets, ISO14001, industry sector
a.
The Goodness of Fit test showed the value of adjusted R2 = 0.21 which means that the value of the dependent variable can be explained by 21% of the independent variables. This value can be considered sufficient because environmental performance is influenced by many factors besides financial performance and other factors mentioned in this study as the control variables.
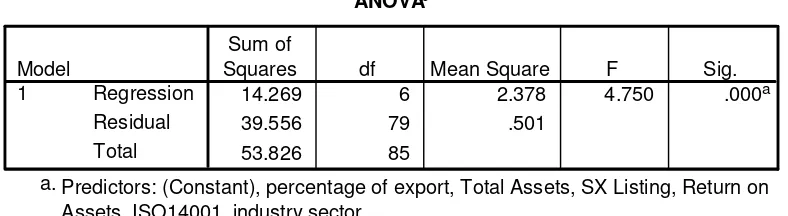
The F test, as shown in Table 3, indicates that simultaneously the independent variable and the control variables altogether are very significantly associated with the dependent variable.
Predictors: (Constant), percentage of export, Total Assets, SX Listing, Return on Assets, ISO14001, industry sector
a.
Dependent Variable: Environmnetal Rating b.
Table 4 indicates the significance of the relationship between the dependent variable and each of independent and control variables.
Table 4. Coefficients
Coefficientsa
1.719 .271 6.332 .000
.025 .178 .014 .140 .889 .955 1.047
3.239E-05 .000 .198 1.999 .049 .950 1.053
.075 .051 .166 1.487 .141 .742 1.347
.595 .179 .328 3.316 .001 .951 1.052
.457 .174 .262 2.619 .011 .930 1.076
.001 .003 .047 .430 .668 .765 1.307
(Constant) assets is not significantly associated with environmental performance. However, some control variables namely: company size (measured by total assets), ISO 14001, and stock exchange listing are significantly associated with environmental performance. Neither the percentage of export nor industry sector is shown to have significant effect on the environmental performance.
exporters do not get incentive for being “greener”, this could also explain why the level of export does not have significant effect on environmental performance.
The influence of company size to environmental is quite predictable as it is argued that big companies can afford to invest in more environmentally friendly technology and management. Likewise, the stock exchange listing is predicted to have significant effect on corporate environmental performance, because listed companies would be concerned more about their environmental reputation as compared to unlisted companies. It is interesting to see, that despite considerably massive scepticisms over the government rating, due to low monitoring and governance in Indonesia, there is a high consistency between this rating and ISO 14001. Although some people may argue that environmental rating measure environmental outputs (e.g. pollution), while ISO 14001 measures environmental management systems, it makes sense to say that good environmental management systems should result in good environmental performance.
CONCLUSION, LIMITATION AND FUTURE RESEARCH DIRECTION
Based on the description in the previous sections, it can be concluded that environmental performance is not significantly associated with financial performance in Indonesia. However, it is significantly associated with company size, stock exchange listing and ISO 14001, which also indicates the consistency between the government rating and international standards of environmental management certification.
One limitation is noted in this study. As the data consisted of listed and unlisted companies, this may raise a question regarding the accuracy of that of unlisted companies. However, there is one advantage of using unlisted companies as it covers both types of companies and therefore reduce bias of selecting the data.
Future research can be addressed to discover what types of reporting strategies (i.e. voluntary disclosures, income smoothing, etc.) used by Indonesian companies to avoid political cost and maintain legitimacy of their activities in relation to environmental issues. This is relevant with the increasingly environmental awareness amongst the stakeholders in Indonesia that would eventually bring about political pressures to the companies.
REFERENCES
Al-Tuwaijri, Sulaeman A., Theodore E. Christensen, K.E. Hughes II. 2004. “The relations among environmental disclosure, environmental performance, and economic performance: a simultaneous equation approach”. Accounting, Organizations and Society 29:447-471.
Bragdon, John C. and J Marlin. 1972. Is pollution profitable? Risk Management, 19, 9– 18.
Elsayed, Khaled and David Paton. 2004. “The impact of environmental performance on firm performance: static and dynamic panel data evidence”. Structural Change and Economic Dynamics. xxx.
Freedman, Martin and Bikki Jaggi. 1992. “An investigation of the long-run relationship between pollution performance and economic performance: the case of pulp and paper firms”. Critical Perspectives on Accounting: 3, 315-336.
Friedman, Milton. 1962. “Capitalism and freedom”. Chicago: The University of Chicago Press, Phoenix Books.
Hassel, Lars, Henrik Nilson and Siv Nyquist. 2005. “The value relevance of Environmental Performance”. European Accounting Review. 14,1, 41-61.
Hughes, Susan B., Allison Anderson, and Sarah Golde. 2001. “Corporate environmental disclosure: are they useful in determining environmental performance”. Journal of Accounting and Public Policy: 20, 217-240.
Judge, William Q., and Detelin Elenkov. 2004. “Organizational capacity for change and environmental performance: an empirical assessment of Bulgarian firms”. Journal of Business Research. xx.
Kennelly, James J and Eric E Lewis. 2000. “ Degree of internationalization and corporate environmental performance: Is there a link?” International Journal of Management ( Sep), 19, 3: 478-490.
Narver, John. 1971. Rational management responses to external effects, Academy of Management Journal (March): 99–115.
Norusis, Marija J. 1997. SPSS. “SPSS Guide to Data Analysis”. Prentice Hall. New Jersey Perry, Marti and Teng Tse Sheng. 1999. “An overview of trends related to environmental reporting in Singapore”, Environmental Management and Health 10 (5) : 310.
Porter, Michael E. and Claas van der Linde. (1995). “Green and competitive: Ending the stalemate”. Harvard Business Review 73(5): 120–134.
Pradhono and Yulius Jogi Christiawan. 2004. “Pengaruh economic value added, residual income, earnings dan arus kas operasi terhadap return yang diterima oleh pemegang saham”. Jurnal Akuntansi dan Keuangan 6,2
Rockness, Joanne., Paul Schlachter and Rockness, H. (1986). “Hazardous waste disposal, corporate disclosure and financial performance in the chemical industry”, Advances in Public Interest Accounting 1 : 167–191.
Salama Aly. 2004. “A note on the impact of environmental performance on financial performance”. Structural Change and Economic Dynamics.xxx.
Schaltegger, Stefan. and Terje Synnestvedt. (20012). “The link between ‘green’ economic success: environmental management as the crucial trigger between environmental and economic performance”, Journal of Environmental Management 65: 339-346.
Schaltegger, Stefan. and Roger Burritt. 2000. “Contemporary Environmental Accounting. Issues, Concepts and Practice”, Greenleaf Publishing, Sheffield, UK.
Spicer, Barry. 1978. “Investors, corporate social performance and information disclosure: an empirical study”, The Accounting Review 53: 94–111.
Thompson, Paul and Zarina Zakaria. 2004. “ Corporate Social Responsibility Reporting in Malaysia: Progress and Prospects”, The Journal of Corporate Citizenship (Spring): 125-137.
Toms, J.S. 2002. “Firm resources, quality signals and the determinants of corporate environmental reputation: some UK evidence”. British Accounting Review: 34, 257-282
Ullmann, A. 1985. “Data in Search of a Theory: A Critical Examination of Relationship among Social Performance, Social Responsibility, and Economic Performance of U.S. firms. Academy of Management Review 10: 540-557.
Wheeler, David. and Shakeb Afsah. 1996. “Going public on polluters in Indonesia: Bapedal’s PROPER Prokasih Program”. East Asian Executive Reports. International Excecutive Reports. Washington, D.C.
Gupta, Shreekant and Bishwanath Golda. 2003.” Poor environmental ratings harm company stock prices in India”, Centre for Development Economics Delhi School of Economics.
Media Indonesia. 2002, “Soal 'Proper', Kementerian Lingkungan Hidup Dinilai Tidak Transparan”. 05 November.