MANAGING FRESHWATER INFLOWS TO ESTUARIES
Water Budget Analyses for the Yuna River Watershed and
Samana Bay, Dominican Republic
Tom Fitzhugh
The preparation of this document was made possible through support provided by the Office of Natural Resources Management, Bureau for Economic Growth, Agriculture and Trade, U.S. Agency for International Development, under the terms of Leader with Associates Cooperative Agreement Award LAG-A-00-99-00045-00 and Associates Cooperative Agreement No. EPP-A-00-03-00011-00. The opinions expressed herein are those of the author(s) and do not
Water Budget Analyses for the Yuna River Watershed and
A series of different analyses were conducted to characterize the freshwater budget of Samana Bay, in order to understand the sources of water entering the bay and the potential impacts on flows into the bay of human water use in the Yuna River Basin. Most of the analyses were conducted on an average annual basis, but a monthly model simulation was also conducted to try to better characterize the impacts of irrigation withdrawals. These analyses allowed us to draw some useful conclusions about what is happening in the watershed upstream of Samana Bay. But as will be discussed, we were unable to quantify certain components of the water budget, and there is still uncertainty in the ones we were able to quantify, so there are many improvements that could be made in the current water budget for the Yuna River and Samana Bay.
Annual water budget analysis
The first water budget analysis was conducted by Jeanny Wang (ECO Wang) and Steve Schill (The Nature Conservancy). An initial attempt was made to apply the Spatial Water Budget Model (SWBM), which is a customized tool programmed in Arcview GIS software, but this proved impossible because adequate data to run and parameterize the model were not
available for the Yuna watershed. Consequently, a more simplified average annual water budget was created in Excel, using measured precipitation and temperature data, for the watersheds upstream of two stream gage stations in the watershed (El Limon and Los Quemados). Using precipitation minus potential evapotranspiration (calculated using Thornthwaite’s equation) as an estimate of streamflow yielded estimates that were within 30% of measured values. Water budget estimates were also calculated for the Los Quemados watershed using precipitation estimates from TRMM satellite products (instead of field measured data), but this information was not found to be particularly useful because the TRMM estimates appeared to consistently under-estimate precipitation in the basin.
Two additional reports containing water budget information were compiled by hydrologists in the Dominican Republic contracted by The Nature Conservancy. These documents are entitled Water Budget of the Yuna Watershed and Yuna River Watershed
Evaluation. The first report contains basic background information about the hydrology and
climate of the Yuna watershed, and computes some different components of the average annual water budget of the entire watershed, including streamflow, irrigation withdrawals and return flows, and direct flow into the estuary.
evapotranspiration, hydric balance, streamflow, runoff, dams, irrigation activity and withdrawals, runoff, well withdrawals, and hydrogeology. This report contains estimates of average annual potential and actual evapotranspiration for all available climatic stations in the watershed. Evapotranspiration was calculated using a few different methods, but based upon review of the data and consultation with hydrology staff in the Dominican Republic, it appears that the Thornthwaite equation provides the best estimates for the Yuna watershed. Actual
evapotranspiration was calculated using estimates of potential evapotranspiration in conjunction with coefficients for land-cover in the vicinity of the climate station. This report also contains an appendix with monthly climatic and streamflow data, and maps of the watershed.
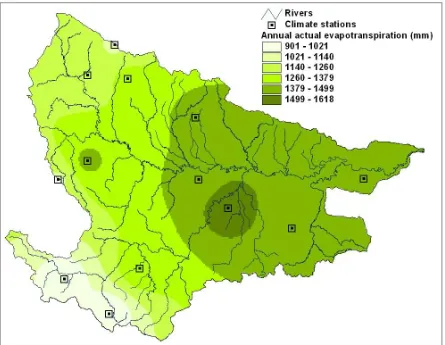
Data from these last two reports were then compiled and analyzed to further assess the annual water budget for the basin. By interpolating the data on precipitation and actual
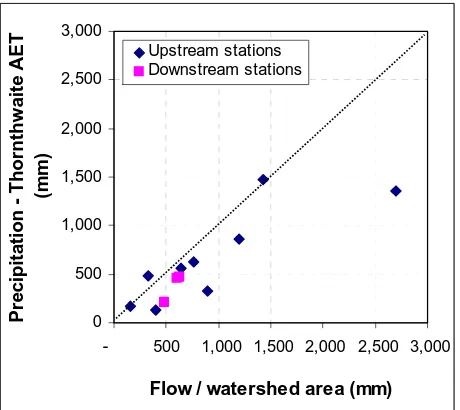
evapotranspiration for individual climate stations it was possible to map precipitation and actual evapotranspiration across the entire watershed (see Figures 1 and 2). To assess the accuracy of these estimates and their usefulness in characterizing the water budget at different locations in the watershed, the difference between precipitation and actual evapotranspiration was calculated for the watershed upstream of each stream gauging station (see Figure 3). This difference was then compared to measured streamflow per unit watershed area at the same locations (see Figure 4). Note that the time periods over which the evapotranspiration, precipitation and streamflow data used in this analysis were collected varies, but most are for 20-40 periods starting in 1960 or after and ending in 2002 or earlier.
Figure 3. Streamflow gages, dams, and irrigation areas in the Yuna watershed.
- 500 1,000 1,500 2,000 2,500 3,000
Flow / watershed area (mm)
Figure 4 shows that with the exception of one station (Masipedro in Los Arroces), there is a decent relationship between the precipitation minus actual evapotranspiration calculations and measured streamflow. The three stations downstream of the major irrigation areas and the two major dams in the basin (stations Camu en La Bija, Yuna en Villa Rivas, and Yuna en El Limon) are displayed separately on the graph from the stations upstream of these areas. The fact that the relationship for these downstream stations is similar to that for the upstream stations indicates that at least on an average annual basis, there has not been a substantial reduction in streamflows due to water withdrawals related to irrigation during the last 40 years.
From these results and from a separate analysis of trends in streamflow data in the Yuna watershed conducted by Andy Warner (The Nature Conservancy), it appears that there has not been a large change in annual streamflow due to irrigation withdrawals in the watershed. But this does not preclude the possibility that there has been reduction of flows into the estuary during the driest months, especially during dry years, which tend to be the periods when
irrigation water use is greatest and also when the estuarine ecosystem is under the most stress.
Monthly water budget analysis
To better assess the question of the impact of irrigation withdrawals on monthly flows, a monthly model was constructed using the Water Evaluation and Planning (WEAP) System (http://www.weap21.org/). WEAP is a model that was developed by the Stockholm
Environmental Institute in Boston, MA, and is a flexible water resources planning model that can be used to examine the impact of water withdrawals, dam operations, and other human activities on water budgets and streamflows on an annual or monthly basis. For the purpose of this project, a simple WEAP model was constructed to evaluate the impact of irrigated rice acreage on streamflows into the estuary. Given some of the uncertainties and data gaps in this basin, which will be discussed below, the intent of this model was only to get an idea of the order of magnitude of impacts of irrigation withdrawals on flows into the estuaries.
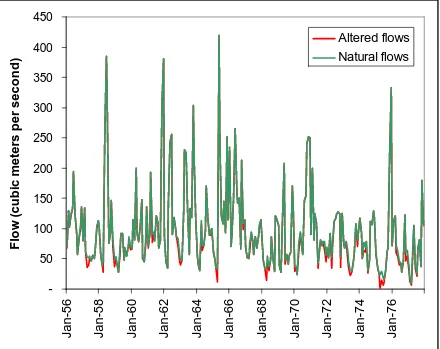
The approach taken was to use monthly streamflow data from the 1956-77 period and estimate how much the current level of irrigation withdrawals would have affected natural flows during that period. One reason for using this earlier period rather than more recent years is that it was before construction of major dams in the basin, so represents the most natural flow regime data that is available. The second reason is that the climate during this period appears to have been drier than that during recent years (median monthly streamflow at the El Limon station was on average 43% greater during 1984-2003 versus 1956-77). So using flow data from 1956-77 represents a worst-case scenario as to what the impacts would be if the climate returned to that earlier drier regime. Because there was irrigation even during that earlier period, estimated withdrawals for irrigation that occurred during that period were added back onto the measured streamflow data, to produce an estimate of natural flows during that period. Then the estimated irrigation withdrawals for all current irrigated areas were subtracted off of these flows.
distribution of precipitation (displayed in Figure 1). When predictions from this model were made for monthly precipitation for 1978-2003, the R2 varied between 0.33 and 0.41 depending on location. Based on this verification procedure, while rainfall values for individual months may not be particularly accurate, this synthesized precipitation dataset does seem to replicate the natural variation of monthly rainfall in the basin over a long period of time,
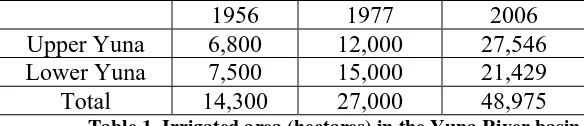
All of the other assumptions used in the WEAP model were derived either from the two reports described earlier or from conversations with hydrologists in the Dominican Republic. Table 1 below shows the irrigated acreage in the basin. The vast majority of this acreage is irrigated rice, so for the purposes of this simulation, it was assumed to be all rice. Two typical growing seasons for rice are from November – March and April – August, with no rice being grown during September – October because of the threat of hurricanes. Typical water use for rice irrigation ranges from a maximum of 1 liter per second per hectare early in the growing season to much less later in the growing season. Return flow was estimated as 25% of withdrawals.
1956 1977 2006
Upper Yuna 6,800 12,000 27,546
Lower Yuna 7,500 15,000 21,429
Total 14,300 27,000 48,975
Table 1. Irrigated area (hectares) in the Yuna River basin
-Figure 5. Projected results of irrigation withdrawals on natural flows 1956-77.
Conclusion
The analysis presented here seems to indicate that there has not been substantial
alteration in river flows into Samana Bay from human activities in the Yuna watershed. It should be understood, however, that the modeling techniques used here are relatively simplified and that there are still uncertainties remaining in the data and techniques used that could affect these conclusions. For this reason, it would be prudent for future management of the watershed and the estuary to improve on the analysis conducted here. This section describes some of the significant data gaps and the priorities that exist for future work. Improving on this analysis is necessary not only because of the need to understand what is happening in the watershed now, but also because future changes in climate, dam operations, and water withdrawal activity could make alteration of flows into the estuary a much bigger concern in the future. Having a good water budget model available would allow for an educated assessment of the impacts of future proposed projects in the watershed.
One of the biggest needs right now is to replicate the average annual water budget described above on an annual or monthly basis. The Yuna watershed has good monthly
Such a dataset could provide the framework for constructing an improved monthly water budget model (possibly in WEAP).
Some other weaknesses in the current analysis which could be improved upon are:
(1) There are water budget components other than precipitation, evapotranspiration, and water withdrawals which should be assessed and quantified if possible. One in particular is the role of dams, not only the operation of dams but also surface water evaporation from reservoirs. A second is water withdrawal activities other than irrigation withdrawals. A third is groundwater/surface water interaction and direct groundwater flow into Samana Bay.
(2) For the actual evapotranspiration estimates, it would be good to assess how using current rather historical land-cover affects these estimates. Because for the purpose of gauging changes in natural flow regimes, it would be useful to know what the actual
evapotranspiration was under natural land-cover conditions.
(3) The lack of precipitation data for 1956-77 is a potentially confounding factor in the WEAP analysis. It would be very useful to further assess how using a synthesized precipitation dataset is affecting the results of this analysis, and/or figure out how to create a model that avoids this problem by using the actual precipitation data that is available after about 1978.
(4) There is a lack of spatial resolution in the WEAP model as to the location of water
withdrawals, stream gages, dams etc. which it would be good to resolve. For example, while we know that there are water withdrawals in the Lower Yuna in the vicinity of the El Limon gage, it is uncertain at this point whether those withdrawals are upstream or downstream of this gage.