Mkuranga Governance Baseline
This publication is available electronically on the Coastal Resources Center’s website:
www.crc.uri.edu. It is also available on the Western Indian Ocean Marine Science Organization’s website: www.wiomsa.org. For more information contact: Coastal Resources Center, University of Rhode Island, Narragansett Bay Campus, South Ferry Road, Narragansett, RI 02882, USA. Email: [email protected]
Citation: Torell, Elin and Aviti Mmochi 2006, Mkuranga Governance Baseline, Coastal Resources Center, University of Rhode Island. pp. 18
Disclaimer: This report was made possible by the generous support of the American people through the United States Agency for International Development (USAID). The contents are the responsibility of the authors and do not necessarily reflect the views of USAID or the United States Government. Cooperative agreement # EPP-A-00-04-00014-00
Cover Photo: Milkfish pond in Mkuranga
Table of Contents
LIST OF TABLES ... 3
LIST OF FIGURES ... 3
INTRODUCTION ... 4
SOCIO-ECONOMIC PROFILE... 4
TRENDS IN RESOURCE CONDITION AND USE... 6
FISHERIES... 6
WATER AND SANITATION ... 6
MANGROVES AND CORAL REEFS ... 7
KISIJU PWANI AND MANGROVE MANAGEMENT ... 7
TRAJECTORY OF ICM IN MKURANGA... 8
SUCCESS AND AQUACULTURE IN MKURANGA... 10
FIRST ORDER OUTCOME ASSESSMENT... 11
MANAGEMENT CAPACITY... 13
REFERENCES... 15
APPENDIX A. SUMMARY TIMELINE... 16
List of Tables
Table 1. Population and Household Size in Mkuranga ... 5Table 2. The Status of Mangroves and Coral Reefs in Mkuranga ... 7
Table 3. Trajectory of ICM in Mkuranga... 9
Table 4. First Order Outcome Assessment... 11
Table 5. Management Capacity ... 13
List of Figures
Figure 1. Map of Tanzania and the Mkuranga District ... 4I
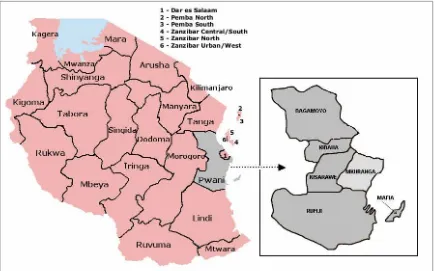
NTRODUCTIONMkuranga district is one of the six districts that form the Pwani Region (Figure 1). It was established in 1995, when the eastern part and coastal area of the Kisarawe district was cut off to form the district of Mkuranga. It is a relatively small district, covering 2,432 square kilometers, which is about a quarter of the size of Bagamoyo and about the size of the Zanzibar Islands. The district has about 90 kilometers of coastline, extending from the Temeke to the Rufiji districts. Like much of coastal Tanzania, the district is endowed with coral reefs, mangrove forests, and coastal fisheries. Remote unpopulated islands host endangered species such as the red colobus monkey and attractive birds.
In Mkuranga, there are seven coastal villages: Shungubweni, Mpafu, Kerekese, Kisiju Pwani, Mdimni, Magawa, and Kifumangao and several near-shore islands, hosting the Boza, Kuruti, Kwale, and Koma villages (Mkuranga District Council 2002). Most of these villages are remote and inaccessible, despite the relative proximity to Dar es Salaam.
Figure 1. Map of Tanzania and the Mkuranga District
S
OCIO-
ECONOMIC PROFILEAlmost 190,000 persons live in the 15 wards (three coastal) and 101 villages (10
District is one of the largest producers of cashew nuts in Tanzania, with over 35,000 hectares under cultivation and close to 3 million trees (United Republic of Tanzania 1997). The production of cashews peaked in the early 1970s, but a combination of issues (mildew disease, world market price decline, and villagization) caused the production to decline. The production started to increase again during the mid-1990s, when extension services improved and farmers began preventing mildew disease by spraying the trees with sulfur dust.
A socioeconomic baseline conducted in 2005 as part of the Songo-Songo Gas Development and Power Generation Project that surveyed four villages in Mkuranga, found that the average income per household was about Tsh 600,000 (less than US $600 per year). With an average household size of about 4.5 persons, this means less than US $150 per person per year. Eighty-seven percent of the respondents stated that they earned less than one dollar per day (Institute of Resource Assessment 2005).
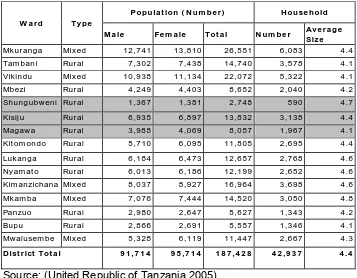
Table 1. Population and Household Size in Mkuranga
W a r d Ty pe
Popu la t ion ( N u m be r ) H ou se h old
M a le Fe m a le Tot a l N u m be r Av e r a g e Siz e Mk ur anga Mix ed 12,741 13,810 26,551 6,083 4.4 Tam bani Rur al 7,302 7,438 14,740 3,578 4.1 Vik indu Mix ed 10,938 11,134 22,072 5,322 4.1 Mbezi Rur al 4,249 4,403 8,652 2,040 4.2 Shungubw eni Rur al 1,367 1,381 2,748 590 4.7
Kisij u Rur al 6,935 6,897 13,832 3,138 4.4 Magaw a Rur al 3,988 4,069 8,057 1,967 4.1 Kit om ondo Rur al 5,710 6,095 11,805 2,695 4.4
Luk anga Rur al 6,184 6,473 12,657 2,768 4.6 Ny am at o Rur al 6,013 6,186 12,199 2,652 4.6 Kim anzichana Mixed 8,037 8,927 16,964 3,698 4.6
Mk am ba Mix ed 7,076 7,444 14,520 3,050 4.8 Panzuo Rur al 2,980 2,647 5,627 1,343 4.2 Bupu Rur al 2,866 2,691 5,557 1,346 4.1 Mw alusem be Mix ed 5,328 6,119 11,447 2,667 4.3
D ist r ict Tot a l 9 1 ,7 1 4 9 5 ,7 1 4 1 8 7 ,4 2 8 4 2 ,9 3 7 4 .4
Source: (United Republic of Tanzania 2005)
T
RENDS INR
ESOURCEC
ONDITION ANDU
SEF
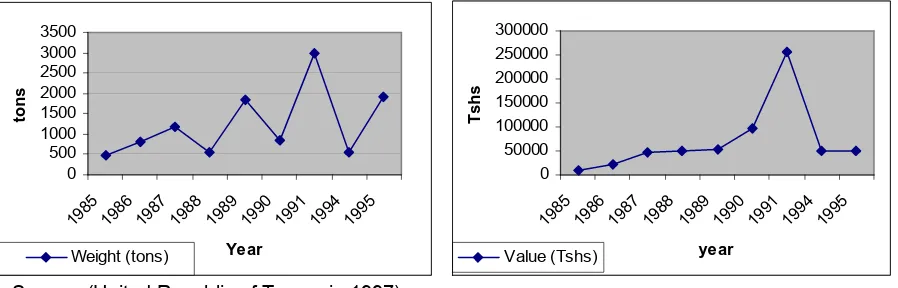
ISHERIESMkuranga has several areas that are attractive for shrimp and finfish fishing. The district has ten official fisheries landing sites, the largest being in Kisiju Pwani. This is the only place where fish landings are recorded. Overall, there is a serious fisheries statistics gap in Tanzania. Compiled and published fisheries statistics are only available up to 1996 (Department for International Development 2003). Figure 2 shows the weight and value of the fish landed in Kisiju Pwani between 1985 and1995. Note that there is no landing data for 1992 and 1993. Overall the figures show that the fish landings vary greatly from year to year, but that the value of the landings is more stable (with the exemption of 1991, when the landings were exceptionally high).
0 500 1000 1500 2000 2500 3000 3500
1985 1986 1987 1988 1989 1990 1991 1994 1995
Year
tons
Weight (tons)
0 50000 100000 150000 200000 250000 300000
1985 1986 1987 1988 1989 1990 1991 1994 1995
year
Tshs
Value (Tshs)
Source: (United Republic of Tanzania 1997)
Figure 2 . The Weight and Value of Fish Landed in Kisiju Pwani 1985-1995
Conflicts between industrial and artisanal fishers are common in Mkuranga. Artisanal fishers feel that the industrial fishers do not adhere to the established rules related to fishing grounds, gears, and timetables. For example, industrial vessels have broken rules by fishing in shallow water at night and dumping fish remains into the sea. As a result artisanal fishing gear has been damaged, stocks have been overfished, the fish harvest has declined, and the breeding grounds destroyed.
W
ATER ANDS
ANITATIONchildhood morbidity and the majority of deaths among under-five children (Bukenya, Komwihangiro et al. 2004).
M
ANGROVES ANDC
ORALR
EEFSThere are about 4,000 hectares of mangroves in Mkuranga (Mkuranga District Council 2002). In-between the mangroves there are approximately 2,000 hectares of non-forested area, such as creeks, salt pans, and bare saline areas. Some of the salt pans are being used to produce salt, whereas others are abandoned or used for aquaculture.
As is shown in Table 2, the mangroves are in generally good condition, with a high density of mature trees and seedlings. However, according to the District ICM Action Plan, there is a problem with illegal and uncontrolled cutting of mangroves in the district. The main causes for the mangrove cutting are: increased demand for fuel wood, building and construction materials; inadequate awareness around the importance of
conservation and the existing Mangrove Management Plan; and mangrove clearing for development of salt works, agriculture, and other activities.
Table 2. The Status of Mangroves and Coral Reefs in Mkuranga
Resource Impact/
Mangroves Good condition high density of Coral reefs Reefs good
condition, good
Source: (Francis, Wagner et al. 2002)
Table 2 also shows that Mkuranga’s coral reefs are in good condition, with good live hard coral cover, high fish abundance, and a low rate of reef damage. The trend, however, is negative, showing an increase in damaged coral areas and fish cover (Francis, Wagner et al. 2002).
K
ISIJUP
WANI ANDM
ANGROVEM
ANAGEMENTKisiju Pwani is different from other villages in Mkuranga because it is a port town. There is a commercial harbor area where you can buy anything from televisions, radios,
minutes from Dar es Salaam. It is also a place where merchants from Mafia, Zanzibar, Kilwa, Lindi, and Rufiji come to buy and sell goods.
Because of the large number of visitors to the village, the garbage problem is severe. Close to the town is a patch of mangroves standing in a sea of plastic bottles, old containers, wrapping materials, and other rubbish. Another problem in Kisiju Pwani is that there are no public bathrooms for visitors and few families have toilets in their homes. Therefore, a lot of people use the beach as a toilet, causing further beach pollution.
The village has been part of the Mangrove Management Program (MMP) for a few years and many villagers are aware of the value of conserving mangroves. The villagers have replanted some mangroves and maintain that they can see reduced erosion. As
everywhere in Tanzania, the mangroves are divided into four zones including a conservation zone and a use zone. The village has created a mangrove-zoning plan, which is included in a by-law that has been approved by the village council. The MMP has also helped strengthen the village environmental committees.
Since most of the villagers have been engaged in the mangrove management and have a relatively large understanding of this issue, we asked three focus groups (women, young men, and old men) a number of questions related to mangrove management. All the groups agreed that the problem is illegal mangrove cutting and depletion.
Interestingly, the group of older men stated that that population growth is an underlying problem contributing to the mangrove depletion. All groups maintained that the situation has improved and that the mangrove cover has grown. This, they said, has happened because of awareness raising, which has spurred villagers to decrease cutting and replant mangroves. Restraining forces are lack of equipment (boats, boots, spades, etc.), lack of land ownership, low education, lack of income generating activities, and lack of awareness within committees. Driving forces that have helped improve the situation are outside facilitation, permitting, and awareness-raising. Recently the
government of Tanzania banned logging and export of logs from natural forest including mangroves. The government also banned the use of natural forest for making charcoal. These two moves are also expected help mangrove conservation.
The villagers suggested awareness raising, public involvement, by-laws, patrolling and enforcement, and establishment of a Natural Resources Committee to decrease the restraining forces. All men were aware that there is a mangrove management plan that is trying to promote some of these actions. The women did not know about the plan although they knew that some mangrove management activities had occurred in the village.
Trajectory of ICM in Mkuranga
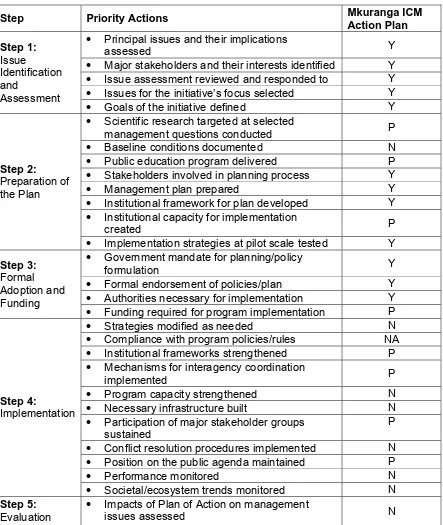
Through a participatory process, the district went through the different steps required to prepare an action plan, including training, issue identification, awareness raising, and issue analysis. Of fourteen issues identified by coastal villagers, three were selected for action planning:
1. conflicts between industrial and artisanal fishers 2. illegal and uncontrolled cutting of mangroves
3. beach pollution by human excreta and household refuses.
Table 3. Trajectory of ICM in Mkuranga
Step Priority Actions Mkuranga ICM
Action Plan
• Principal issues and their implications
assessed Y
• Major stakeholders and their interests identified Y • Issue assessment reviewed and responded to Y • Issues for the initiative’s focus selected Y
• Goals of the initiative defined Y
• Scientific research targeted at selected
management questions conducted P
• Baseline conditions documented N
Step 2:
Preparation of the Plan
• Public education program delivered P • Stakeholders involved in planning process Y
• Management plan prepared Y
• Institutional framework for plan developed Y • Institutional capacity for implementation
created P
• Implementation strategies at pilot scale tested Y
Step 3:
Formal Adoption and Funding
• Government mandate for planning/policy
formulation Y
• Formal endorsement of policies/plan Y • Authorities necessary for implementation Y • Funding required for program implementation P
• Strategies modified as needed N
• Compliance with program policies/rules NA • Institutional frameworks strengthened P • Mechanisms for interagency coordination
implemented P
Step 4:
Implementation
• Program capacity strengthened N
• Necessary infrastructure built N
• Participation of major stakeholder groups sustained
P
• Conflict resolution procedures implemented N • Position on the public agenda maintained P
• Performance monitored N
• Societal/ecosystem trends monitored N
Step 5:
Evaluation •
Impacts of Plan of Action on management
• Program adapted to its own experience and to
changing social and environmental conditions N
• External evaluations invited N
X = yes P = partially N = no
The overall goal with the action plan is to improve the quality of life of coastal communities, through better utilization of marine and coastal resources while
maintaining the biological diversity and productivity of coastal ecosystems in the districts. The action plan’s three main objectives directly linked to the three priority issues are to: i) to ensure harmonious and sustainable utilization of marine resources
ii) control illegal cutting of mangroves
iii) ensure hygienic condition and attractive beach area
Implementation of the Mkuranga District Action Plan began in 2003 and so far it has focused on community strengthening and bee-keeping (led by the Tanzania Women Leaders in Agriculture and Environment, TAWLAE) and aquaculture (conducted through the SUCCESSS program). Since 2004, TAWLAE has worked in Kisiju Pwani to initiate community based organizations (CBOs), providing training on group dynamics and business management (including accessing credit, extension, training and fund raising). In 2006, a new planning initiative began to establish a collaborative fisheries
management plan covering several Mkuranga villages. Initial meetings have been held, but no significant progress has been made yet.
The bee-keeping project has been initiated to promote mangrove conservation and generate income for the participating households. To ensure that the honey production is sustainable, TAWLAE is promoting bee-keeping in combination with mangrove
replanting. This project component is explicitly working to increase gender awareness and mainstreaming. To do this, TAWLAE requested that there was an equal number of female and male beekeepers. The TAWLAE staff also carried out gender training for the participants to make sure that they understood the importance of equal involvement of both men and women in developmental activities.
SUCCESS
ANDA
QUACULTURE INM
KURANGAThe aquaculture trials began in Mkuranga under the leadership of the Tanzania Coastal Management Partnership (TCMP) Science and Technology Working Group (STWG) in 2003. The group initiated Milkfish farming in the Mpafu village and a tilapia-based integrated farming system in the Mfuru-mwambao village. An initial assessment found that the locals regard milkfish as a delicacy and that there is an established market. The early aquaculture trials were not successful in Mkuranga — mainly because the ponds were not constructed properly. Since the SUCCESS program took over in 2004, the results have been more promising, thanks to in-country technical assistance from the Institute of Marine Science (IMS), Tanzania Fisheries Research Institute (TAFIRI), the Faculty of Aquatic Sciences and Technology (FAST), and an American aquaculture specialist.
owner of the farm does not have sufficient cash and capital to pay for dike construction. The construction of the two ponds (1 ha each) was completed in March, 2006. The ponds have been fertilized, the gates are under construction, fingerling collection is in progress and the ponds are expected to be stocked in July, 2006. At the tilapia site, the Program is assisting two groups of farmers through, for example, introducing a wind-driven water-pumping system to reduce production costs and make the operation more economically viable. One windmill has been installed and its efficiency is now being evaluated.
By May 2006, 36 persons (21 women and 15 men) were engaged in the aquaculture projects in Mkuranga. The IMS staff has taken an experimental approach to aquaculture in Mkuranga. For example, one of the milkfish ponds was fed using a locally developed feed formula while another pond was used as a control (without feeding). A total of 236 and 91 kg of milkfish in approximately one ha each was harvested respectively in July 2005. The fish were sold in a market in Dar es Salaam fetching a total of 353,000 at an average price of 1114 Tsh (approximately 1 USD) per kg.
F
IRSTO
RDERO
UTCOMEA
SSESSMENTThe Orders of Coastal Governance Outcomes Framework (Olsen 2003) groups outcomes of coastal management along a trajectory that traces the advance to more sustainable forms of coastal development. The framework emphasizes that the first threshold is creating the enabling conditions that make integrated forms of coastal management feasible. These “First Order Outcomes” are: constituencies that actively support an ICM initiative, a formal governmental mandate for the program along with the authority necessary to implement a course of action, resources (including sustained funding) clear unambiguous goals, and institutional capacity. The second threshold is to gauge the success of implementing an ICM program in terms of the changes in behavior that are required to meet its goals. Only after the requisite changes in behavior (Second Order Outcomes) have been practiced for a sufficient period can improvements be expected in the environment and in the social benefits (Third Order Outcomes) that may be attributable to a coastal management program.
As part of the governance baseline, we conducted an assessment of the status of ICM enabling conditions in the Mkuranga district. This assessment is presented in Table 4. The table shows that district has succeeded in building constituency for ICM in the coastal villages, which have been involved in developing the district ICM action plan. Villagers are also involved in implementation, through beekeeping and aquaculture.
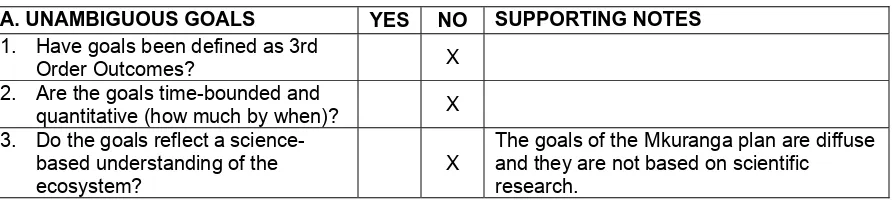
Table 4. First Order Outcome Assessment
A. UNAMBIGUOUS GOALS YES NO SUPPORTING NOTES
1. Have goals been defined as 3rd
Order Outcomes? X
2. Are the goals time-bounded and
quantitative (how much by when)? X 3. Do the goals reflect a
science-based understanding of the ecosystem?
X
4. Do the goals reflect an
understanding of the institutional
dimensions of the challenge? X B. CONSTITUENCIES
5. Do the user groups who will be affected by the Program’s actions understand and actively support its agenda?
X
There is support for the district action plan, but in the villages, people are more aware of the Mangrove Management Program than the district action planning.
6. Is there public support for the
Program? X
See above. 7. Do the institutions that will assist in
implementing the Program and/or be affected by its actions
understand and actively support its agenda?
X
Yes, but there has been a recent change in personnel and the new ICM committee is being familiarised with the ICM process and action plan.
8. Has the program successfully negotiated its place within the roles and responsibilities of pre-existing institutions?
X
The action plan is mainstreamed into the district development plan.
C. COMMITTMENT
9. Is there a clear, unambiguous and long-term commitment of authority from government that gives the program the powers it needs to implement its program?
X
There is commitment, but it is still a bit diffuse.
10. Have sufficient financial resources been committed to fully implement
the program? X
The district does not prioritise ICM in its allocation of funds. There are, however, some funds from USAID Tanzania through SUCCESS Tanzania to implement ICM in Mkuranga.
11. Have the program’s policies and a plan of action been formally approved by the appropriate level of government?
X
Action plan was approved in 2003.
12. Does the program’s mandate and authority extend over more than
one sector? X
To achieve integration, the district formed an ICM committee, comprising the heads of relevant sectors, and an ICM working group of representatives from district sectors, private interests, and NGOs.
D. CAPACITY TO IMPLEMENT
13. Does the program possess the human resources to implement its
plan of action? X
Capacity is a major problem in Mkuranga. The ICM facilitator recently left the program and a new facilitator was appointed in January 2005. 14. Do those human resources have
the sufficient, relevant capacity to implement all elements of the program?
X
Most program components are
implemented by NGOs (TAWLAE) and scientists (IMS, TAFIRI and FAST). 15. Have the lead institutions
responsible for program
implementation demonstrated the ability to practice adaptive management?
X
The only adaptive management that has occurred has been led by a scientist from IMS (to make the aquaculture trials more successful).
16. Is there voluntary compliance with
program rules? X
17. Is emerging scientific knowledge being incorporated into the program’s policies and plans?
X
Yes, the IMS, TAFIRI and FAST group use scientific knowledge to improve the
aquaculture projects.
The district has established commitment for the ICM planning process, through the ICM action plan and the institutional arrangements created for its implementation at district and village level. However, the district is still very much dependent on donor funds to carry out the implementation. The action plan has been fully incorporated into the district development plan, but, this does not mean that the district has committed funding. The district collects revenue from natural resources related activities such as charcoal-making and cashew nuts. Collected revenue goes into a general fund and the districts do not earmark funds for environmental management. Hence, even if a district was able to collect revenue from coastal activities, it is not certain that the funds would be used for coastal management. In Mkuranga, the priorities for the district are health, education, and natural resources activities that can generate revenue (e.g. charcoal). The only way to ensure that a district allocates funds for ICM action planning is if the national
government or the donor makes it a stipulation for other funding (e.g. if the Prime Minister's Office Regional Administration and Local Government (PMO-RALG) decides that a coastal district development plan must include an ICM element).
M
ANAGEMENTC
APACITYThe Mkuranga district has poor infrastructure and because of poor roads it is difficult to access coastal villagers, especially during the rainy season. Even more remote are villagers who live on islands that are part of the Mkuranga districts.
The Mkuranga district had only one computer to serve all district personnel when the program started. Lack of human capacity is another problem. The district team members need training on various ICM technical skills. In all districts there are personnel
shortages, forcing people to wear many hats and spreading capacity too thin. One recent problem was that the District ICM Facilitator left for graduate studies in 2005. When he left, the district ICM process was temporarily stalled as he had been the driving force behind ICM in the district. A new facilitator was appointed early in 2006 and the district is currently reestablishing its ICM process. Although the ICM process was temporarily stalled, some work still went on — especially related to beekeeping and aquaculture. One positive aspect of having IMS, TAWLAE, TAFIRI and FAST involved in implementing the District Action Plan in Mkuranga is that these groups provide
substantial extension services. Without these groups, it would not be possible to implement the current activities in the district.
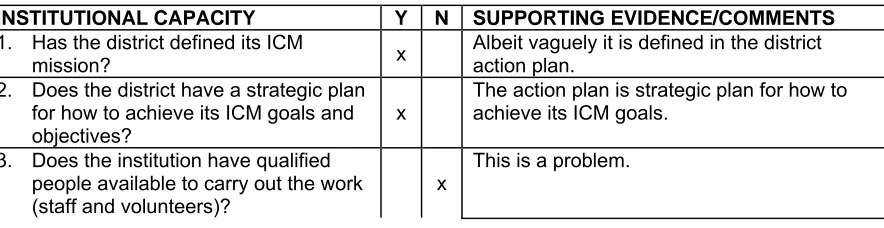
Table 5. Management Capacity
INSTITUTIONAL CAPACITY Y N SUPPORTING EVIDENCE/COMMENTS
1. Has the district defined its ICM
mission? x
Albeit vaguely it is defined in the district action plan.
2. Does the district have a strategic plan for how to achieve its ICM goals and objectives?
x
The action plan is strategic plan for how to achieve its ICM goals.
3. Does the institution have qualified people available to carry out the work (staff and volunteers)?
x
4. Does the district have a clear
administrative structure? x 5. Does the organization have funding
from several, diverse sources to support projects in the SUCCESS area?
x
It is dependent on funding from USAID.
6. Has a plan or plans been developed in collaboration with stakeholders from the SUCCESS area?
x 7. Does the organization have a
communications strategy, with an identified target audience, using diverse media?
x
8. Does the organization offer training for practitioners in the SUCCESS region?
x
TCMP and SUCCESS have provided training on ICM and aquaculture respectively.
9. Does the organization have an extension program that includes long-term engagement with key
stakeholders or community groups to implement on-the-ground results in the SUCCESS area?
x
Extension is provided through TAWLAE, IMS, TAFIRI, FAST, and international experts (not directly by the district).
10. Has the organization produced and disseminated studies of lessons learned and best practices, from the SUCCESS area, that are
interdisciplinary and of high quality?
x
11. Does the organization have formal and informal structures for facilitating learning within the organization and the SUCCESS area?
x
EXTENSION CAPACITY Y N SUPPORTING EVIDENCE/COMMENTS
1. Is there in-country extension
capability on key ICM topics? x
Some – in Mkuranga the experts come from IMS, TAWLAE, TAFIRI, and FAST.
2. Are services and supplies needed by producers or others receiving
extension support readily available?
x 3. Are roads, transport and storage
facilities adequate? x
4. Does extension supply adequate educational support materials for field
workers? x
To some extent, but there is still a need for better extension materials for villagers (e.g. extension manuals). SUCCESS is working on milkfish and Tilapia farming manuals. 5. Do field workers provide regular
in-service training? x
TAWLAE, IMS, TAFIRI and FAST visit the sites, but need a more frequent presence. 6. Is the linkage of extension with
research agencies working? x
Yes on aquaculture, No for bee-keeping. 7. Have the experience of those
receiving the extension support been adequately captured in lessons learned?
x
8. Does government provide or allow incentives that favor natural resource-based coastal livelihood
development?
References
Bukenya, D., J. Komwihangiro, et al. (2004). Integrating Water, Hygiene, and Sanitation into Community IMCI Interventions: Lessons from the African Medical and
Research Foundation (AMREF) in Tanzania. Researching Communities for Child Health: Advancing Health Outcomes through Multisectoral Approaches,
Washington DC.
Department for International Development (2003). Understanding Fisheries, Livelihoods, and Constraints to their Development, Kenya and Tanzania: Review of Marine Fisheries in Tanzania. Dar es Salaam, Department for International
Development.
Francis, J., G. Wagner, et al. (2002). "Development and Protection of the Coastal and Marine Environment in Sub-Saharan Africa" - Tanzania National Report, Phase 1: Integrated Problem Analysis. Dar es Salaam, Global Environment Facility. Institute of Resource Assessment (2005). Songo Songo Gas Development and Power
Generation Project - Wayleave Village Electrification Scheme: Socioeconomic Baseline Data. Dar es Salaam, Institute of Resource Assessment, University of Dar es Salaam.
Mkuranga District Council (2002). Integrated Coastal Management Action Plan. Mkuranga, The Mkuranga District Council.
Olsen, S. B. (2003). Crafting Coastal Governance in a Changing World. Narragansett, The Coastal Resources Center.
United Republic of Tanzania (1997). Coast Region Socioeconomic Profile. Dar es Salaam.
United Republic of Tanzania (2005). Population and Housing Census: Population
Projections. Dar es Salaam, Central Census Office, National Bureau of Statistics, President's Office, Planning and Privatization.
Appendix A. Summary Timeline
YEAR PRESSURE CHANGES IN STATE
RESPONSE AND CHANGES IN GOVERNANCE
1885 • Tanganyika became a
German colony
● Mangrove managed under ordinance
1898 • German administration
established an
opened at Mkuranga •
Trade dominated by
Mkuranga in fear of revenge by independent African Tanganyikans
• Tanganyika attained independence
1967 • Arusha declaration in
place Pre
1970`s •
Mkuranga sparsely
populated •
Dominated by Zaramo and Ndengereko
1980
-85 •
Police post built at Mkuranga
1986 • Proposals for Mkuranga district presented to government
1987 •
Director of forestry imposed a national ban on the cutting of mangroves 1990 • NBC in place in
Mkuranga
1994 •
Mangrove management plan was approved, calling for protecting and zoning all mangroves in Tanzania.
1995 • Mkuranga district
established •
Kisarawe district divided into Mkuranga and Kisarawe
1996 • Lion threat at
Mkuranga, about ten people killed
• National fisheries and environmental policies adapted
1997 • National fisheries policy
adopted
• National environmental policy adopted
1999 • NBC closed due to low capital to sustain services
2001 • Mkuranga District Action
Planning process begins
2002 • National ICM Strategy
Approved
2003 • Mkuranga District Action
Plan is approved 2004 • Dangerous lions
disappear after elders meeting