Fakultas Teknik Universitas Katolik Santo Thomas ojs.ust.ac.id 19
Walkability; The Relationship of Walking Distance,
Walking Time and Walking Speed
Shanty SILITONGA
11Study Program of Architecture, Saint Thomas Catholic University, email: [email protected]
Abstract
Walking is cheap and healthy. It is the main transportation for the majority of students exploring their daily life in their campus area. Different types of people will have various types of walking behavior. To develop a better knowledge of the walkability of built environment, it is important to understand the complexity behind walking behavior. There are many possible factors in measuring walking behavior. Walking behavior can be measured by walking speed, walking directions, walking experiences, group formation, and density. In this research paper, only three factors are going to be used to testify the descriptive study of walking behavior on the campus of UNIKA St Thomas University; which are walking distance, walking time and walking speed. The method used in this study is known as walking distance test, and the data were analyzed using the comparative approach. The findings show that walking speed, walking time and walking speed are deeply related to each other. The results of the observation study of walking behavior revealed that the condition of the campus built environment related to the density, connectivity, and land-use diversity seem to influence the amount and variety of walking activities that occur in the given environment and also affect how the walking activities conducted. The researcher concluded that walking speed, walking time and walking distance the pedestrian in campus UNIKA St.Thomas are comfortable based on the related theories.
Keywords: walking distance, walking time, walking speed
1.
Introduction
Walking is one of the most convenient means of transport, it is cheap, it also can unify other transportation modes and yet also healthy and fun at the same time (Litman, 2001 in Özer & Kubat, 2014). A pedestrian has an important place in the design of a place; pedestrian often used as an indicator of a comfortable or uncomfortable place to inhabit. Likewise on campus, walking is an activity carried out by almost all the students. Campus Unika St.Thomas Medan has a pedestrian path but not connecting all the existing functions or disjointed. As a result, many students complained of discomfort in walking. The environment can influence behavior, the environment can hinder behavior consequently also limits what it does. The environment can determine how far people can walk in it. The environment can invite and bring behavior, determine how people should act. A good environment will invite people to do or bring behaviors including walking. Having an environment that allows people to walk is one thing that is important because it can encourage people to choose walking instead of driving and reducing our dependence with motor vehicle. The environment which can encourage people to walk is the environment which has quality; perceptual quality of the built environment (Ernawati, Adhitama, & Sudarmo, 2016). In his research, Jenny and his colleagues concluded that the adaptability of quality of a street environment may depend on the spatial quality of the street such as legibility, human scale, coherence, and imageability. On the other hand, people likability or preference to a street for walking may depend on both qualities, i.e. spatial and non-spatial dimension of the street. An easy walkable environment has many attributes that support walking. Attributes such as mixed land use, connectivity between sites, and sidewalks are needed. Other attributes that encourage walking include
Fakultas Teknik Universitas Katolik Santo Thomas ojs.ust.ac.id 20
aesthetics and safety (Ford, 2013). These attributes are important factors that can encourage individuals to choose walking over other.
2.
Literature Review
Walking behavior can be considered as one of the important factors in measuring the walkability level. Walking behavior has close interrelationships with walkability (Azmi, Karim, & Amin, 2012). There are five (5) things that show the behavior of walking is a walking speed, walking direction, walking experiences, group formation, and density (Daamen & Hoogendoorn, 2003). This study focused on walking speed, which related to walking time and walking distance.
Walking speed
Every person walking at a pace that they find most convenient for them. There are several factors that affect walking speed, some of which are age, gender, height, weight and so on. Walking speed of a man is faster than woman who has the same age (Patricia, 2010). A human walking speed ranges from an average of 1.40 m per second (Barton, Grant, & Guise, 2003). According to (Barton et al., 2003), the average walking speed is 1.40 meters per second. Individual speeds vary widely in the 2- 4 miles per hours range. According to (Uttermann, 1985 in Azmi et al., 2012), the average human walking speed without baggage are about three miles per hour or 260 feet per minute, slightly more for men and less for women.
Walking distance
Walking distance is a fixed distance of walking. Typically often used in planning as a benchmark for comfortable walking distance is 400 meters (Olson, 2010). The same thing also delivered by (Barton et al., 2003) which states that the most comfortable walking distance from house to public facilities is 400 meters, while the most comfortable walking distance from the house to the city center is 800 meters. Walking speed is often associated with walking distance. Walking distance is a fixed distance that can be reached by foot; a lot of theory, which states that the radius of 400 meters is the distance that is most widely known as the most comfortable walking distance (Olson, 2010). The distance is smaller than the distance radius of 600 meters which is termed by Clarence Perry (Perry in Azmi et al., 2012). Comfortable mileages to walk are vary; for example, the maximum mileage from residential to primary school is 600 meters (Perry, 1942 in Azmi et al., 2012), the distance from residential to kindergarten and primary school is 400 meters away and takes about five minutes (Meenakshi, 2011).
Walking time
Walking time is the time to takes to walk from one place to another. Walking time is influenced by many factors, such as gender, age, health and leisure. The walking time will take longer for sightseeing or relaxing. Clarence Perry (Perry, 1942 in Azmi et al., 2012) suggest a 5-10 minutes is the most convenient time for 400 meters, the same thing also delivered by (Barton et al., 2003) suggest 5 minutes for 400 meters and 10 minutes for 800 meters. A recent study states that there are eight urban design qualities that greatly affect the quality of walkability; imageability, enclosure, human scale, transparency, complexity, coherence, legibility, and the linkage (Ewing & Clemente, 2013; Ewing & Handy, 2009). Meanwhile (Ford, 2013) simplifying to three environmental attributes are mixed land use, connectivity between sites, and sidewalks. Researcher saw some similarities that complexity with mixed land use, linkage with connectivity, imageability related to aesthetic.
Mixed used affect walkability (Ford, 2013). Mixed use in a campus environment can be interpreted with a diversity of functions. Rapoport (1990) mentioned the complexity is richness in one place. Complexity depends on the quality of the physical environment such as
Fakultas Teknik Universitas Katolik Santo Thomas ojs.ust.ac.id 21
variations of buildings, the diversity of architecture and ornamentation, landscape elements, street furniture, signage, and human activities. The complexity associated with the amount of variety that can be seen by the observer clearly (Rapoport, 1990) and pedestrian requires a high complexity of the environment in order to generate appeal for people to walk. Complexity refers to a diversity seen in the area. In this diversity there are aesthetic elements, (Handy, Boarnet, Ewing, & Killingsworth, 2002) aesthesis defined as "attractiveness and appeal of a place" the which includes the appearance of the building, landscaping, shade trees, and public amenities such as water fountains, benches and lighting. (Horacek et al., 2012) noted that aesthetics were a positive factor in walkability in 73% of college campuses studied. These findings put greater emphasis on campus aesthetics compared to a normal urban community. Enjoying the environment in the which one walks increases the probability of walking.
If diversity is already present in the environment, then next it is needed connectivity between the functions. The ease and efficiency to achieve a wide variety of functions is a characteristic of connectivity. Good connectivity occurs when numerous intersections and smaller block lengths create a neighborhood that can be walked and easily navigated (Southworth, 2005). Research conducted by Guibo (2014) found that the connectivity encourages increased people to choose walk for transportation. Sidewalks or pedestrians created to direct people to walk and help people to move from one place to another. The existence of sidewalks or pedestrian indirectly creating walkable communities, but the quality is decisive. In sidewalks we are also talking about safety, how the safety of pedestrians during their walk. Sidewalks should be enough for at least two or three people to walk side by side, have a smooth surface without holes or bumps, to have and good lighting at night (Southworth, 2005). A clear separation between pedestrian and vehicle lanes are also very important for the security.
3.
Research Method
This paper aims to compare the walking behavior; the which are divided into three factors which are walking distance, walking time and walking speed, of students in Catholic University of St.Thomas with the current guidelines from the literature review. The data was also taken by observation. Researcher using a stopwatch and measuring tools to determine walking time and walking speed.
The data were analysed using the comparative approach whereby, the raw data is from the field survey are compared with the current guidelines found in the literature reviews and the background study. The analysis results will be reanalyzed by associating them with the observation of the researchers on the three attributes of the environment that is mixed land use, connectivity between sites, and sidewalks.
The case study site
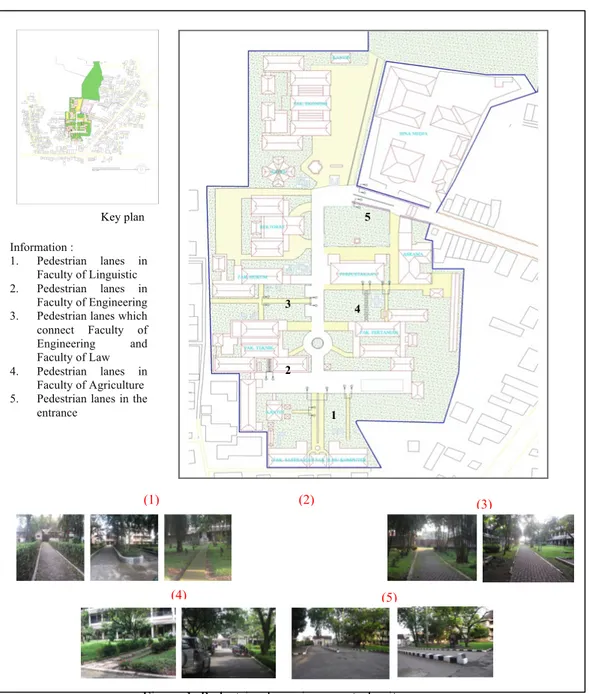
Case study site is the campus of St.Thomas Catholic University, located in the city of Medan, Indonesia. The acreage is more than 2 acres. St.Thomas Catholic University has eight faculties and sixteen departments or study programs, the university is currently in the top five well-known universities and most desirable in the city of Medan. The picture below shows the location of the well-planned pedestrian path. These pathways are intermittent and sadly, seem only patches to the campus area.
Fakultas Teknik Universitas Katolik Santo Thomas ojs.ust.ac.id 22
In this study researcher only studied the behavior of pedestrians walking on roads only.
Figure 1. Pedestrian lanes in case study site
Periodic observation and photography (visual) is used as a technique to document the physical characteristics, types and patterns of user activity. Photography is used with the aim of recording evidence in the form of physical characteristics, use and activity, movement, intensity of pedestrians, and other things that require evidence.
Observations are made in one week (Monday-Friday) starting at 8:00 a.m. - 2:30 p.m. in the afternoon. The observation points were carried out at three points around campus area. Each observer will take 5 pedestrians or pedestrian groups, they will record the start of the journey to the destination, where the campus gate is assumed to be the deadline for counting / observation. There were 367 people who were successfully observed during a week of observation. (1) (2) (3) (4) (5) Information : 1. Pedestrian lanes in Faculty of Linguistic 2. Pedestrian lanes in Faculty of Engineering 3. Pedestrian lanes which connect Faculty of Engineering and Faculty of Law 4. Pedestrian lanes in
Faculty of Agriculture 5. Pedestrian lanes in the
entrance 1 3 2 5 4 Key plan
Fakultas Teknik Universitas Katolik Santo Thomas ojs.ust.ac.id 23
4.
Result and Discussion
From the observation, the first thing seen researcher is that the pedestrian are not aware of the difference between pedestrian lanes and public roads. They walk on the public road and then moved to pedestrian lanes if needed. Disjointed pedestrian lanes are the problem; fig.1 indicating the location of the place pedestrian lanes which are well-planned. A well-planned pedestrian lanes have materials from paving block, with a height range least 20 centimeters, 1.2 m wide and at least have 10 meters long. Researcher conducted small research to know visibility of pedestrian lanes through the sense of vision. By doing small qualitative research researcher concluded that pedestrians feel the visibility of pedestrian lanes is not good. Disjointed pedestrian lanes makes them uncomfortable in walk.
Therefore, in this study researcher only studied the behavior of pedestrians walking on public roads only. Pedestrians in the research environment has a range of ages 18-23 years (age mostly students), which became the difference is their gender. Through observation found that there are six pedestrian routes in accordance with the six faculties at this Catholic University. Researcher saw that the six (6) routes have a close relationship with the number of students per faculty; where Faculty of Education is the faculty with the highest number of students followed by a Faculty of Linguistics and Computer Science, Faculty of Economy, Faculty of Agriculture, Faculty of Law and Faculty of Engineering last (Fig.2). Researcher calculates walking speed, walking time and walking distance from the pedestrian farthest journey; ie from the entrance to the Faculty of Linguistics and Computer Science.
Walking speed
For walking speed, the current guideline use is based on average speed from Barton et al., (2003) which is 1.40 meters per second. The walking speed is calculated by dividing walking distance with the time taken for walking. From the observation researcher calculates that there is a little difference walking speed between women and man. Man can go faster 0,3 seconds per meter than women (Table.1). Walking speed pedestrians in UNIKA is not too far from average theoretically.
Table. 1 Comparison between current guidelines with the current walking speed
Age Average walking speed This study
Male Female Adult
Barton, Grant & Guise (2003)
Untermann (1985)
1,40 m per second 260 feet per minute 1,9 m per second
1,6 m per second
Walking distance
For walking distance, the current guideline use is based on average walking distance to local community proposed by Barton et al., (2003) which is 400 meters in five minutes and Clarence Perry (1942) which is 600 meters per five minutes. From the observation researcher calculates that longest distance traveled were 375 meters from the entrance to the Faculty of Linguistic and Faculty of Teacher Training and Education (Table.2).
Table. 2 Comparison between current guidelines with the current walking distance
Age Average walking distance This study
Male Female Adult Olson (2010), Barton, Grant, Guise (2003) Perry (1942) 400 meters 600 meters 375 375
Fakultas Teknik Universitas Katolik Santo Thomas ojs.ust.ac.id 24
Walking time
For walking time, the current guideline use is based on average walking time to local community proposed by Barton et al., (2003). The walking time consists of approximately 5 minute for 400 meters, approximately 10 minutes for 800 meters and approximately 12 minutes for 1 kilometre. From the observation researcher count walking time for man was 3 minutes for 375 meters and 4 minutes for 375 meters for women (Table.3).
Table. 3 Comparison between current guidelines with the current walking time
Age Average walking time This study
Male Female
Adult
Barton, Grant, Guise (2003)
Perry (1942)
5 minutes for 400 meters 5-10 minutes for 400 meters 3 minutes for 375 meters 4 minutes for 375 meters
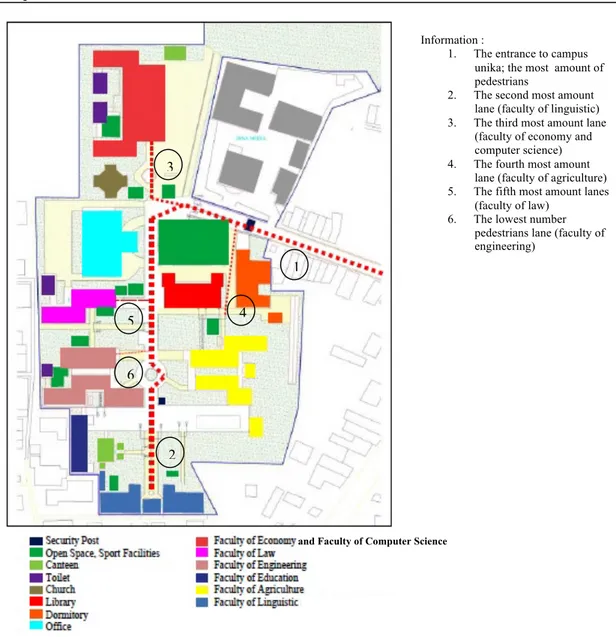
Mixed land use affect walkability (Ford, 2013). Mixed land use in a campus environment can be interpreted with a diversity of functions. From Figure 2 it can be seen that 14 different functions within the campus with an area of more than 2 acres. Six types of faculty is a major function of most buildings. This affects the number of pedestrians; based on observations of the order of the number of pedestrians in accordance with the order of students amount per faculty. The existence of the cafeteria near the building Faculty of Linguistics and Science and the Cafeteria near the Faculty of Economy is also an attraction in the area. The variation was not found. The entire building is brick expose according to the particularities of the building catholic in Indonesia. Nothing interesting on the arrangement of the landscape, there are only the old trees that might be the appeal of the area. Street furniture is also not found, so signage was not found. Horacek et al., (2012) noted that aesthetics were a positive factor in walkability in 73% of college Campuses studied, and this does not occur on the campus UNIKA St.Thomas.
Regarding connectivity and the sidewalk or pedestrian has been found in small research conducted by researchers at the beginning. There is no form of pedestrian connectivity between the functions contained in this campus. There is only a pedestrian path planned in some small part, no more than 10 meters in length. The quality of pedestrian way was not good, slippery when it rains, a lot of holes and used as a parking lot of traps. However, there has been a clear difference between pedestrian and public roads.
Fakultas Teknik Universitas Katolik Santo Thomas ojs.ust.ac.id 25
The following is the picture showing the order route of most amounts of pedestrians in campus UNIKA:
Figure 2. The order route of most amounts of pedestrians
5.
Conclusion
From the observation researchers concluded that walking speed, walking time and walking distance the pedestrian in campus UNIKA St.Thomas are comfortable based on the related theories. The three attributes of environment; diversity, connectivity and sidewalk, did not affect pedestrians in campus UNIKA St.Thomas. However, this study is still in the early part of a series of on-going research. Therefore, it is necessary to do qualitative study on perceived quality of environment’s attributes that affecting people to walk to establish the results of this study.
6.
References
Azmi, D. I., Karim, H. A., & Amin, M. Z. M. (2012). Comparing the walking behaviour between urban and rural residents. Procedia-Social and Behavioral Sciences, 68, 406–416.
Barton, H., Grant, M., & Guise, R. (2003). Shaping neighbourhoods: a guide for health, sustainability and vitality. Taylor & Francis.
Daamen, W., & Hoogendoorn, S. P. (2003). Experimental research of pedestrian walking behavior.
Transportation Research Record, 1828(1), 20–30.
Information :
1. The entrance to campus unika; the most amount of pedestrians
2. The second most amount lane (faculty of linguistic) 3. The third most amount lane
(faculty of economy and computer science) 4. The fourth most amount
lane (faculty of agriculture) 5. The fifth most amount lanes
(faculty of law) 6. The lowest number
pedestrians lane (faculty of engineering) 2 3 1 4 6 5
Fakultas Teknik Universitas Katolik Santo Thomas ojs.ust.ac.id 26 Ernawati, J., Adhitama, M. S., & Sudarmo, B. S. (2016). Urban design qualities related walkability in a
commercial neighbourhood. Environment-Behaviour Proceedings Journal, 1(4), 242–250. Ewing, R., & Clemente, O. (2013). Measuring urban design: Metrics for livable places. Island Press. Ewing, R., & Handy, S. (2009). Measuring the unmeasurable: Urban design qualities related to
walkability. Journal of Urban Design, 14(1), 65–84.
Ford, A. M. (2013). Walkability of Campus Communities Surrounding Wright State University. Wright State University, Dayton, Ohio retrived from https://corescholar.libraries.wright.edu/ on 8 april 2020.
Handy, S. L., Boarnet, M. G., Ewing, R., & Killingsworth, R. E. (2002). How the built environment affects physical activity: views from urban planning. American Journal of Preventive Medicine,
23(2), 64–73.
Horacek, T. M., White, A. A., Greene, G. W., Reznar, M. M., Quick, V. M., Morrell, J. S., … Shelnutt, K. P. (2012). Sneakers and spokes: an assessment of the walkability and bikeability of US postsecondary institutions. Journal of Environmental Health, 74(7), 8–15.
Meenakshi, A. (2011). Neighbourhood Unit and its Conceptualization in the Contemporary Urban Context. Institute of Town Planners, India Journal, 8, 81–86.
Olson, J. (2010). The neighbourhood unit: how does concept apply to modern day planning. Texas: EVstudio Colorado & Texas Architects & Engineers.
Özer, Ö., & Kubat, A. S. (2014). Walkability: Perceived and measured qualities in action. ITU Journal of Faculty of Architecture (ITU AlZ), 11(2), 101–117.
Patricia (2010). Normal walking speed: Average human walking pace. Retrieved March 7, 2020 from http://www.yogawiz.com/blog/walking/normal-walking-speed.html.
Rapoport, A. (1990). The meaning of the built environment: A nonverbal communication approach. University of Arizona Press.
Southworth, M. (2005). Designing the walkable city. Journal of Urban Planning and Development,