Determination Inventory Level for Aircraft Spare Parts Using
Continuous Review Model
Azizah Aisyati [email protected]
Department of Industrial Engineering Sebelas Maret University
Jl. Ir Sutami 36A, Surakarta, Indonesia
Wakhid Ahmad Jauhari [email protected]
Department of Industrial Engineering Sebelas Maret University
Jl. Ir Sutami 36A, Surakarta, Indonesia
Cucuk Nur Rosyidi [email protected]
Department of Industrial Engineering Sebelas Maret University
Jl. Ir Sutami 36A, Surakarta, Indonesia
Abstract
In this paper, we determine ordering quantity and reorder point for aircraft consumable spare parts. We use continuous review model to propose a spare part inventory policy that can be used in a aircraft maintenance company in Indonesia. We employ ABC classification system to categorize the spare parts based on their dollar contribution. We focus our research on managing the inventory level for spare parts on class A and B which commonly known as important classes. The result from the research indicates that the continuous review policy gives a significant amount of saving compared to an existing policy used by the company.
Keywords:
Inventory, Continuous Review, Ordering Quantity, Reorder Point, ABC Classification
System.1. INTRODUCTION
Inventory management becomes one of primary needs for company to win in a tight global competition. Inventory is a significant asset for any organization. Therefore, it should be managed effectively and efficiently to minimize total cost and to satisfy the customer’s requirement. In any practical situation, inventory management faces barriers in the form of a tradeoff between minimizing total cost and maximizing service level. Selecting inventory policy correctly now becomes essential to management as there are many inventory policies provided in the inventory literature.
Garuda Maintenance Facility Aero Asia (GMF-AA) is a company that provides maintenance, repair and overhaul (MRO) service to airlines. Maintenance is activity to maintain aircraft that comprises of line maintenance, base maintenance and engine maintenance. Repair is a activity to improve the broken components in aircraft machine. Overhaul is activity to monitor and give major repair to any object in aircraft, including machine or component.
disposable component are called consumable spare part. The consumable spare parts are very important component in GMF-AA due to their magnitude needs in daily MRO activity. Besides having higher demand than other spare parts, consumable spare parts must be ordered from foreign countries, hence, the replenishment may take a long time. If the spare parts aren’t well managed by management, the daily MRO process will probably be interrupted due to the lack of spare part inventories. Moreover, if management decides to hold more spare parts to guarantee that the needs from daily MRO activity must be satisfied, a high inventory cost may occurs. Therefore, controlling consumable spare part accurately is needed by management to ensure that the daily MRO activities run smoothly.
Spare parts inventory system has been studied extensively by many researchers. Croston [1] was probably the first researcher introduced spare part inventory model. The proposed model was developed by integrating single exponential smoothing into inventory model. Kaldchschmidt et al. [2] argued that croston method was very important tool to determine inventory level of spare part in supply chain which has intermittent demand. Syntetos and Boylan [3] and Syntetos and Boylan [4] gave critics to croston method which still results a bias in forecasting the spare part. Therefore, Syntetos and Boylan [5] proposed a model for controlling spare part inventory to reduce the level of error in forecasting spare part. Unfortunately, the both models, including croston [1] and Syntetos and Boylan [5] were not suitable to adopt since most inventory environment in real condition is stochastic.
Strijbosch et al [6] developed another model compound bernoulli method and compound poisson method to determine ordering quantity and reorder point. Teunter and Sani [7] gave their research attention on studying the lumpy product. They used order-up-to policy to determine inventory level which previously employed croston method to forecast the demand. Results from this research indicated that integrating croston method and order-up-to policy results in optimal service level. Chang et al [8] implemented r,r,Q policy to manage semiconductor component by assuming stochastic demand. Furthermore, Porras and Dekker [9] determined spare part inventory level at oil company. They used different reorder points to find optimal inventory level in order to minimize total inventory cost. Smidth-Destombes et al. [10] proposed joint optimization of inventory management and maintenance activity. They proposed a heuristic model to derive the optimal solutions and proved that the proposed model performed better than METRIC model. Kilpi et al.[11] developed cooperative strategies for the availability service of repairable aircraft components and determined the factors that give the contribution to the cooperative strategy. They used simulation model to determine optimal cost and used game theory to test the cooperative strategies. Wong et al. [12] investigated the cost allocation problem in context of repairable spare parts pooling with game theoretic model. The results from this study showed that the cost allocation policy affects the companies in making the decision in inventory management. Even many methods have been implemented in determining spare part inventory level, lack of them considering the utilization of continuous review model in reducing total inventory cost.
An important work that must be considered firstly before deciding the correct inventory method is spare part classification. Silver et al. [10] and Tersine [11] proposed ABC classification system to categorize items based on their contribution to dollar volume. They also proposed a suitable inventory models that can be implemented for each classes. Chu et al. [12] developed inventory classification system with fuzzy ABC method. In this proposed method, inventory classification system is not only developed by considering dollar volume’s contribution, but also incorporating expert judgments.
2. LITERATURE REVIEW
2.1 ABC Classification System
ABC classification system is a method that classifies the spare parts based on how critical the spare parts for the company. This method segment the spare parts into three categories, that are A, B and C. A items make up roughly 20 percent of the total number of items and represent 80 percent of the dollar sales volume. B items comprise roughly 30 percent of the items and represent 15 percent of the dollar volume. C items comprise roughly 50 percent of the items and represent only 5 percent of dollar volume [10]. The A items must received more attention from manager. The B items are of secondary importance in relation to class A items and the class C items are relatively unimportant items, hence, the manager can manage them as simple as possible. The steps of ABC classification are described as follows:
1. Listing the spare parts and their demand.
2. Determining the contribution of the spare part by multiplying the demand for each item and the value or price of item.
3. Computing the percentage of spare part contribution by dividing the contribution of each spare part with the total contribution of the spare parts.
4. Sorting the spare parts so that the percentages of spare part contribution are listed from higher value to lower value. The category of spare part could be found by using the above description from [10].
2.2 Continuous Review Model
The continuous review model is one of the inventory policies that manage the inventory through monitoring the inventory level continuously until if the inventory level drops to the reorder point r, the ordering of size Q should be done. Reorder point is determined for each stock keeping unit as demand forecasting during supply time. Reorder point is commonly defined as the summation of demand during lead time and safety stock. The assumptions that be used in continuous review model are as follows:
a. The demand per unit time is probabilistic with mean D and standard deviation σ
b. The price of item is not influenced by ordering size.
c. Reorder point is determined using net inventory.
d. The backorder cost is set independently to the length time of backorder.
e. Ordering cost is constant and independent to ordering size.
f. Holding cost is proportional to the item price and storage time.
g. Warehouse space, capital and supplier capacity are sufficient.
The notations that will be used in developing continuous review model are as follows:
D demand in units per unit time
σ standard deviation of demand per unit time
A ordering cost incurred for each order size of Q
SS safety stock for the buyer
ES expected number of backorder
H holding cost per unit per unit time
π backorder cost per unit backordered
q the ordering quantity
f(.) probability density function of standard normal distribution
F(.) cumulative distribution function of standard normal distribution
Considering the frequency of ordering is (D/q) and ordering cost is A, the ordering cost per unit time can be formulated by:
………..(1)
The holding cost per unit time is determined by multiplying the average inventory level and safety stock and holding cost per unit product. Safety stock is formulated by multiplying safety factor k and standard deviation of demand during lead time. Thus, holding cost per unit time is as follows:
√ ………..(2)
The backorder cost per unit time can be found by multiplying the backorder cost per unit backordered and the expected number of unit backordered per unit time. Let x as continue random variable with normal distribution with mean µ and standard deviation σ >0. Then, the
probability density function of x can be expressed as
√ ……….(3)
Since the demand during lead time is DL with standard deviation
√
, thereorder point can beformulated as ROP = DL + SS. Shortage occurs when the demand during lead time is bigger than the inventory level at that period (x > ROP). Thus, the expected number of shortage can be expressed by:
!" #) $ %&' (
*+,
!" -∞ . – 0
*+ 122
""3 1 √2 √4
562
2 √62 ( ……….………....(4)
By substituting z = x-DL
σ√L and dx =
√
Ldz
into equation (4), we will find:!" # .2σ√L SS3 1
√2π e z2
2 dz ∞
z=ss
!" -SS- 1 definition of standard normal distribution, we will have:
1 – Fs(y) = -z=y∞ fs z dz
2 into equation 2.6, the expected number of shortage (ES) is given by:
!" -SS 71-Fs 8SS distribution function of standard normal distribution, respectively. Therefore, the backorder cost per unit time is formulated by
TC3 = D
q πσ√L ψ k ………...……...(8)
∂TCtotal(q,k)
∂k =0
∂√LH+ πDσ√L(Fs k -1)
q =0
Fs k 1$ qH
πD ………...(11)
It can be seen in equation (10) and (11) that both equations express the relationship between q and k. Therefore, the solution of the above continuous review model can be found by searching the convergence values of q and k which minimizes total cost. Considering the iterative procedure from Ben-Daya and Hariga [13], the algorithm to solve the continuous review is as follows:
1. Set the initial value of q by
E F2 0
2. Substitute qinto equation (11) to find k.
3. Find the new value of q by using equation (10).
4. Find the new value of k by using equation (11).
5. Repeat step 3-4 until no changes occur in the values of q and k.
6. Compute total cost with equation (9) by employing the convergence values of q and k in step 5.
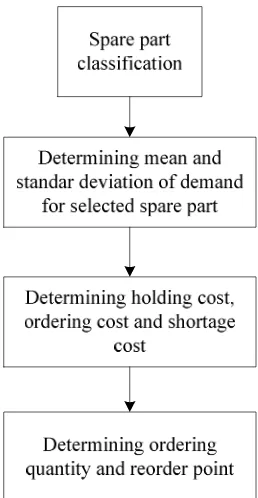
3. RESEARCH METHODOLOGY
FIGURE 1: Research Methodology.
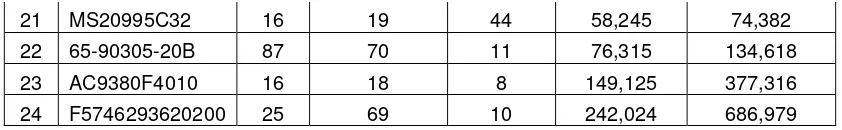
No. Spare part Mean
(unit)
Standar deviation
(unit)
Lead time (day)
Holding cost (IDR)
Shortage cost (IDR)
1 CH34736 58 61 44 393,432 1,191,674
2 335-299-401-0 90 180 95 75,766 132,788
3 S9413-11 96 83 21 288,694 842,545
4 MFFA632/2 6 10 23 6,292,279 20,854,498
5 740001 98 107 10 93,357 191,424
6 D717-01-100 8 7 23 504,483 1,561,843
7 FK16588 5 4 21 1,721,942 5,620,039
8 088-1031-006 6 5 11 867,097 2,770,557
9 KB29665 32 18 23 174,458 461,759
10 4L83-046 102 167 7 550,175 1,714,149
11 QA03963 26 19 29 127,021 303,636
12 5709-4 14 7 35 358,843 1,076,377
13 362-509-9002 7 7 29 397,937 1,206,690
14 65-90305-15 44 33 7 106,871 236,471
15 16135-62 11 8 7 340,241 1,014,369
16 335-299-401 169 185 26 41,971 20,137
17 453A1810-33 5 4 23 364,744 1,096,046
18 AB0473993 14 6 88 151,381 384,838
19 740007 76 62 20 58,489 75,198
21 MS20995C32 16 19 44 58,245 74,382
22 65-90305-20B 87 70 11 76,315 134,618
23 AC9380F4010 16 18 8 149,125 377,316
24 F5746293620200 25 69 10 242,024 686,979
TABLE 1: Input Parameters and Related Inventory Costs of Spare Parts.
4. RESULTS AND DISCUSSIONS
4.1 Spare Part Classification
From ABC classification we found that class A comprises of 11 spare parts, class B comprises of 13 spare parts and class C comprises of 36 spare parts. Spare parts in class A give the contribution about 79.6%, spare parts in class B contributes 14.7% and spare parts in class C contributes 5.6% to rupiah volume. The results from ABC classification is given in table 2. In this research, we focus to manage the inventory in class A and class B due to its criticality for management. 24 spare parts in this classes give significant contribution (94.3%) to the management, hence, controlling them tightly may results in significant amount of inventory cost saving. One of the tight inventory management policies that can be used to manage spare parts in this classes are continuous review. In practical situation, the continuous model has an ability to maintain lower inventory level although it needs more attention from inventory manager. Even the ABC classification can be used to categorize the spare part, considering more factors such as spare parts severity and spare part severity, may provide more attractive results. Each spare part may have different severity level based on its usefulness in aircraft machine.
4.2 Determination of Ordering Quantity and Reorder Point
Ordering quantity (q) and reorder point (ROP) are determined by employing an iterative procedure described in above section. We develop list of program using MATLAB 2009a. The results from MATLAB are given in table 3. As can be seen in this table that some spare parts such as CH34736, S9413-11, 4L83-046 have reorder point level higher than its ordering quantity. It is understandable, because the spare parts have high uncertainty indicated by high standard deviation of demand. Having high standard deviation of demand, the model will produce high safety stock. This condition absolutely will increase the reorder point level.
No Spare part Class No. Spare part Class No. Spare part Class
1 CH34736 Class A 21 MS20995C32 Class B 41 OF25-021 Class C
2 335-299-401-0 Class A 22 65-90305-20B Class B 42 BACC63BV14B7SN Class C
3 S9413-111 Class A 23 AC9380F4010 Class B 43 FK20158 Class C
4 MFFA632/2 Class A 24 F5746293620200 Class B 44 BACR15BB6D7C Class C
5 740001 Class A 25 ABS0368-01 Class C 45 MS29526-2 Class C
6 D717-01-100 Class A 26 BV03112-03-33 Class C 46 BACB30NN4K4 Class C
7 FK16588 Class A 27 2315M20-3 Class C 47 ABS0367-030 Class C
8 088-1031-006 Class A 28 ASPF-S-V06 Class C 48 ABS0604-4 Class C
9 KB29665 Class A 29 65-90305-17 Class C 49 F5746293620100 Class C
10 4L83-046 Class A 30 QD1004-125 Class C 50 BACR15GF8D7 Class C
13 362-509-9002 Class B 33 FK20159 Class C 53 S9413-11 Class C
14 65-90305-15 Class B 34 77870949 Class C 54 BACN10JC4CD Class C
15 16135-62 Class B 35 65-90305-59 Class C 55 65B10920-171 Class C
16 335-299-401 Class B 36 BACH20X3 Class C 56 4551 Class C
17 453A1810-33 Class B 37 QA06123 Class C 57 1683 Class C
18 AB0473993 Class B 38 332A1034-25 Class C 58 M83248/1-906 Class C
19 740007 Class B 39 RG1969 Class C 59 BACB30VF4K12 Class C
20 QA03362 Class B 40 65C27738-2 Class C 60 BACW10BP41CD Class C
TABLE 2:Spare Part Classification.
No Spare part Ordering quantity
(unit)
Reorder Point (unit)
1 CH34736 21 32
2 335-299-401-0 108 24
3 S9413-11 17 36
4 MFFA632/2 2 3
5 740001 16 27
6 D717-01-100 2 3
7 FK16588 1 2
8 088-1031-006 1 2
9 KB29665 4 10
10 4L83-046 20 37
11 QA03963 5 9
12 5709-4 2 5
13 362-509-9002 2 3
14 65-90305-15 4 9
15 16135-62 1 2
16 335-299-401 20 12
17 453A1810-33 1 2
18 AB0473993 2 9
19 740007 12 33
20 QA03362 12 11
21 MS20995C32 11 2
22 65-90305-20B 12 20
23 AC9380F4010 3 4
24 F5746293620200 12 11
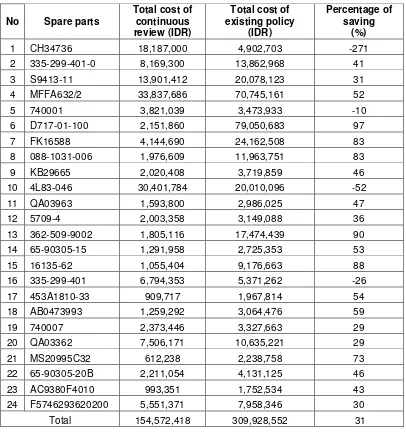
No Spare parts
24 F5746293620200 5,551,371 7,958,346 30
Total 154,572,418 309,928,552 31
perform in this condition. It is due to the both model’s ability to capture the essence of the demand. Furthermore, this study used the spare part demand from spare part data in warehouse, therefore the demand in real aircraft maintenance activity is neglected. It should be noted here that, assuming demand to be independent with the real spare part demand in maintenance may result in higher cost since there a gap between inventory management and maintenance activity. To develop the efficiency of company, both activities should be synchronized in one decision model to decrease the total cost incurred in the system. An integrated information system which integrates the information from both activities is also required by the company to increase the system feasibility in enhancing the capability of the company in reducing total cost.
5. CONCLUSIONS
In this paper, we determine the ordering quantity and reorder point of aircraft spare part using continuous review model. Previously, we classify the 60 spare parts by using ABC classification system. The results from this research show that the proposed continuous review model results in lower total cost compared to an existing policy. The amount of average savings that can be gained by this proposed policy is about 31%. However, an existing policy still performs better in reducing total cost for some spare parts.
Future research can look into determining the inventory level of spare part which total cost has not been minimized by continuous review model. The inventory model accommodating poisson demand or compound poisson demand may suitable to use in solving this problem. Furthermore, the spare part classification can be extended by integrating other qualitative attribute into ABC classification system. The attribute such as spare part severity and spare part criticality probably can be included into spare part classification. The fuzzy method can be used to assess the level of spare part severity and criticality. Other future research direction may focus on integrating inventory decision with maintenance activity. Our study assumes that the demand parameter was a given parameter, however it may not represent the actual system in aircraft repair facility hence, integrating inventory decision with the schedule of maintenance may give valuable insights.
6. REFERENCES
[1] Croston, J.D. “Forecasting and stock control for intermittent demands”. Operational Research Quarterly, Vol. 42(3), pp. 289–303.1972.
[2] Kaldchschmidt, M., Zotteri, G., and Verganti, R. “Inventory management in a multi-echelon spare parts supply chain”, International Journal of Production Economics, Vol. 81, pp. 397-413. 2003.
[3] Syntetos, A.A. and Boylan, J.E. “On the bias of intermittent demand estimates”. International Journal of Production Economics, Vol. 71, pp.457–466. 2001.
[4] Syntetos, A.A. and Boylan, J.E. “The accuracy of intermittent demand estimates”. International Journal of Forecasting, Vol. 21, pp. 303–314. 2005.
[5] Syntetos, A.A. and Boylan, J.E. “On the stock control performance of intermittent demand estimators”. International Journal of Production Economics, Vol. 103, pp. 36–47. 2006.
[6] Strijbosch, L.W.G., Heuts, R.M.J. and Schoot, E.H.M. Improved Spare Parts Inventory Management: A Case Study," Discussion Paper 1998-135, Tilburg University, Center for Economic Research. 1998.
[8] Chang P.L., Chou Y.C. and Huang M.G. “A r,r,Q inventory model for spare parts involving equipment criticality”, International Journal of Production Economics, Vol.97, pp. 66–74. 2005.
[9] Porras E. and Dekker R. “An inventory control system for spare parts at a refinery: An empirical comparison of different re-order point methods”, European Journal of Operational Research, Vol. 184, pp. 101–132. 2008.
[10] Smidt-Destombes, K.S., Van Der Heijden, M.C. and Van Harten, “A. Joint optimisation of spare part inventory, maintenance frequency and repair capacity for k-out of N system”, International Journal of Production Economics, Vol. 118, pp. 260-268.2009.
[11] Kilpi, J., Toyli, J. And Vepsalainen, A. “Cooperative strategies for the availability service of repairable aircraft components”, International Journal of Production Economics, Vol 117, pp. 360-370. 2009.
[12] Wong, H., Van Oudheusden, D. And Cattrysse, D. “Cost allocation in spare parts inventory pooling”, Transportation Research Part E, Vol. 43, pp. 370-386. 2007.
[13] Silver, E.A., Pyke, D.F., and Peterson, R. Inventory Management and Production Planning and Scheduling. New York : John Willey & Sons. 1998.
[14] Tersine, R.J. Principles of Inventory and Material Management. New Jersey : Prentice Hall, 1994