Top Gear Race : The Estimation of Society’s Choice on Transpor tation Mode using a Multinomial Logit Model
I Wayan Suk adana1
Amr it a Nugraheni Sarasw aty2
I Gusti Ayu Putr i Anggara Indr asw ar i3
1,2 ,3Depar tment of Development Economics, Faculty of Economics and
Business, Udayana University pr event the thr eat of tr affic congesti on, the gover nment of Bali pr ovides the soci et y w ith a publ ic tr anspor t ati on and a br and new tol l r oad. These i nfr astructur es give an oppor tuni ty to society to decide bet w een tr avel by their ow n car / motor cycl e or public t r anspor t. For the gover nment, it is impor tant to set efficient tr anspor tation infr astr uct ur es to escape fr om hi gh cost economy w hich appear fr om tr affic congestion. Thi s paper investi gates society’s choi ce on tr anspor tation mode in Denpasar City. We esti mate the passenger ’s choice data using a Multi nomial Logit model, with income and number of congestion spot as i ndependent var iables. The r esul t show s that
Key wor ds: pr efer ence, tr anspor t ati on i nfr astr uctur e, l ost minimization, multi nomial logit.
Abstrak
Bali sebagai bagian dar i per t umbuhan ekonomi Indonesia menghadapi peni ngkat an per mint aan infr ast ruktur tr anspor t asi. Untuk mer espon ti ngginya per mintaan infr ast r uktur tr anspor tasi, dan untuk mencegah ancaman kemacetan l al u li ntas, pemer intah Bali menyediakan tr anspor tasi umum dan jalan t ol bar u bagi masyar akat . Infr astr ukt ur ini member ikan kesempat an kepada masyar akat unt uk memutuskan apakah melakukan per jalanan dengan mobil mer eka sendi r i / sepeda motor atau angkutan umum. Bagi pemer intah, penting untuk mengatur infr astr uktur tr anspor t asi yang efisi en untuk t er hindar dar i ekonomi bi aya ti nggi yang muncul dar i kemacet an lalu lintas. Makalah ini mengkaji pilihan masyar akat pada moda tr anspor tasi di Kot a Denpasar . Data pil ihan penumpang diper ki r akan menggunakan model Mul tinomial Logit, dengan pemer intah, masih kur ang menar ik dibandingkan dengan kendar aan pr i badi.
INTRODUCTION
Since the new economic order i n the late 1960s, economi c development has been
increasing r apidly and so has the demand for tr anspor t. A decade later , it became
obvious that tr ansportation on the w hole needed a lot of attention. Lending
agenci es, as w ell as the cent r al gover nment made funds available for highw ay
and tr anspor tati on pr ojects to impr ove its r ole i n developing the nation. (Sutomo
et.al, 1993). It then tur ned out that the supply of public tr anspor t failed to fulfil l
the mark et demand, so people began to collectively opt for pr ivate vehicles over
public tr anspor tati on.Now , for over the l ast decade, the aver age number of
public tr anspor tation user s has decr eased r apidly, partl y due to the over al l
gr ow th of the Indonesian economy, w hich has increased the number of
middle-income earner s and the mar ket’s vehicle affor dabil ity (Seti aw an, 2013)
On 2003, public tr anspor t user s accounted for 45 per cent of total tr ansportation
user s, and it r emai ned so until 2012. Fr om that poi nt, motor cycl es became mor e
ubiquitous as a r esult of their almost 60 per cent mark et share, as few er and
few er people took to public tr anspor tation. It i s also wor th nothing that over the
same per iod, public tr anspor t onl y accounted for 1 per cent of total vehicles on
the r oad.
In the fast and moder n economy, demand of t r anspor t ati on infr ast r uctur es ar e
getting higher and higher . Unfor tunately, this gr ow th was and still is not
concur r entl y car r ied out w ith enough r esponsibility from the ci tizens. Vehicle
ow ner ship symbol izes pr estige and r elat es to socioeconomic status, w hile
quantity i s valued over quali ty: the mor e vehicles one ow ns the better their
per cei ved economic status. Gri dlock and inconvenient public tr anspor t systems
ar e becoming a hindr ance to pr oductivity and a w inni ng st r ategy to incr ease
citi zens’ str ess levels. The cities that wer e initially developed for human
pur poses, ar e now tr ansfor ming into a contai ner of vehicles, gr ow ing at a 12
per cent r at e annuall y (Seti aw an, 2013)
Bali as par t of Indonesi an gr ow ing economy is also facing an incr easing demand
of tr anspor tation infr astr uctures. In or der to response high demand of
transport ation infrastructur e, and to pr event t he thr eat of tr affic congestion, the
new toll r oad. These infr astr uctur es give an oppor tunity to society to decide
betw een t ravel by their own car / motor cycl e or public tr anspor t. For the
gover nment, it is i mpor tant to set efficient t r anspor t ation infr astr uctur es to
escape fr om hi gh cost economy w hich appear fr om tr affi c congestion.
Liter atur e Review
To mak e an adequate measur es on this ar ea of study, it is important to have an
enough understanding of tr avel behavior and modal choice. Tr avel behaviour is
compl ex and in the other side modal choices ar e deter mined by several factor s.
Some studi es have been done for analyzing the tr anspor t ation mode choice.
Studies that explored the deter minants of the public transport demand
conducted by Paulley et al. (2006) analysed differ ent type of elastici ties. They
show that far es, qual ity of ser vice and car ow ner ship ar e the most significant
variabl es w hi ch influence public transpor t demand. Meanw hi le, Al pizar and
Car lsson (2001) studi ed a gr oup of policies ai med at di scouraging the use of
pr ivate transportation duri ng peak hours, both di rectly and indirectly, by
increasing the att r activeness of the only available substi tute, the bus. This is
done using a choi ce exper iment constr ucted to find the answ er to the foll ow ing
basic question: Given fixed house-to-wor k str uctur es and no w or ki ng hour
flexibi lity, by how much is the choice of tr avel mode for commuter s to work
sensitive to changes in t r avel ti me, changes i n costs for each mode and other
ser vice attr ibutes?. The results show that i n gener al, indicate that model
substitution is sensitive to the char acter isti cs and per formance of each mode. In
par ticul ar , tr avel time for both modes and t ravel cost for car ar e the most
impor tant deter minants of mode choi ce. They al so concl ude that a pr ogr am
aimed at r educing congestion and pollution dur ing peak hour s should focus on
increasing the cost of pri vate t r anspor t and pr oviding faster and mor e reliable
public tr anspor t.
The opposition betw een car and public tr anspor t use and ways to encour age
people to take public tr anspor t that provided by the goverment can be found in
many empi ri cal researchs such as; Hensher (1998) and Meyer (1999)
action is to i ncrease the pr ice of car for indi vidual use and to r educe the over al l
attr activeness of the car . Nakamura and Hayashi (2013) define thr ee st r ategi es
for low -car bon ur ban tr anspor t: ‘avoid’ (i.e. r educing unnecessar y tr avel
demand), ‘shift’ (i.e. encour aging modal shi ft in favor of publi c transpor t use) and
‘impr ove’ (i.e. i mpr oving fuel economy and emission intensity).
The method that usually uses to estimate tr anspor tation mode choice is the logit
model (McCar thy (2001) and also Gebeyehu and Tak ano (2007). Depar t fr om
those studies, w e also t r y to esti mate the society’s pr efer ence tow ar d the
transport ation mode. This study estimates the i mpact of monetary expense and
value of time on the soci ety’s choi ces.
METHODOLOGY
Model of Society’s Choice
In thi s paper w e assume the society is facing a l ost minimization pr obl em of two
alter nati ves to tr avel, which are their ow n car / motor cycle or the public
transport ation. Before w e ar r ive at the lost minimi zation pr oblem, let we
consider a simple model of society’s choice, which adapt fr om Shy (1995) w ith a
sli ght modification. We assume that the passengers, who tr avel fr om Denpasar to
Buki t Jimbar an Campus, have tw o possible alter natives for getting ther e; each
passenger can use either to t r avel by their ow n vehicle or choose to use the
public tr ansportation. For the passenger s w ho tr avel by their ow n vehicle, we
assume deal w ith tC tr avel time. This tr avel time depends on the tr affic
(congestion) and ther efore depends on the number of all passenger s who decide
to tr avel w ith thei r ow n vehicle. For mally, w e can w r ite this tr avel time as;
The parameter
α
measur es the time that spend by passenger , which isindependent from congestion, such as the time i t tak es to star t and heat a car , to
check the oil, dust, and so on. The par ameter
β
measur es the effect of congestionon tr avel time, w hich depends on the qual ity of r oad, number of lanes, and tr affic
lights. Simil ar to travel time by using pr ivate vehicle, l et w e consider a tP for the
travel ti me by using public tr anspor tation, and w e can w r ite for mally as follows;
tP
φ
ϕnC, wher e 0 φ
1 andϕ 0 (2)The paramet er
φ
measur es the time that spend by passenger , which isindependent fr om congesti on, such as the time it tak es to get to the bus station
or stop. The par ameter ϕ measur es the effect of congestion on tr avel time, which
depends on the quality of r oad, number of lanes, and tr affic li ghts. The
interpr etati on of par ameter ϕ almost identi c w ith
β
, because publictransport ation has almost same r oute wi th private tr anspor tation.
We assume N passenger s w ill fall into nC passenger s w ho chose to tr avel with
pr ivate vehicle and nP passenger s w ho chose t o tr avel by public tr anspor tation,
so nCnPN . Than, w e denote v as the value of time and defi ne the lost function
for the passenger s w ho use the pri vate vehicle as;
LC ≡ v(
α
β
nC ) γ
(3)
Meanwhile the lost function for passenger s who use publ ic tr anspor t is as
follows;
LP≡ v(
φ
ϕnC ) λ
(4)
The l ost-minimization functions of the tw o alter natives ar e functions of both
value of time and a monetar y expense.
We assume that ther e are a lar ge number of passenger s w ishi ng to go Udayana
Univer sity on Jimbar an, so each passenger i gnor es their mar ginal effect on
min
L
≡ min
LC, LP
(5)C,P
Therefor e, i f in equilibr ium passenger s use both tr anspor t ation methods, then nC
must satisfy;
v(
α
β
nC ) γ
v(φ
ϕnC ) λ
(6) Assuming that N is sufficiency lar ge, so that not all passenger s use the same
transport ation mode, the equil ibr ium allocati on of passenger s betw een the two
transport ation methods is given by;
n
Ce
(
λ
−
γ
)
v(
φ
−
α
)
(7)
v(β−ϕ)
The equilibr ium number of passenger s w ho use pr ivate vehicle nC i ncreases wi th
the cost of public tr anspor tati on (the ticket) λ and decrease wi th an incr ease i n
toll-r oad tick et, γ . For a gi ven value of time, v , the nC incr ease w ith time it tak es
to get to the bus stati on or stop, intuitively we can assume the
α
,
is ver y small.The equation (7) also give an interesting int er pr etation, the number of pr ivate
vehicle’s dri ver is decr ease w ith the decr ease of the travel time using public
transport ation ϕ .
RESULT AND DISCUSSION Sample and Sur vey Result
The samples are the students and employee of Udayana Univer si ty w ho tr avel
for study or wor k i n Bukit Jimbar an Campus fr om Denpasar gr eater ar ea
(Sar bagit a). We cl assifi ed the mode of tr anspor tation into three categor y;
“publ ic” for the tr ans-sarbagita, “motor ” for motorcycle, and “car ” for car . We
select the samples r andomly fr om the student and employee who have an
experi ence in using those thr ee t r anspor tati on modes. Thi s setting is very
impor tant in gaining gr eater dat a sets that wil l use i n Multinomi al Logit Model
later on. We classifi ed the per son w ho usually uses the public tr anspor t ation into
other s. We also applied the same method for other s mode.
To collect the data, w e have distr ibuted 100 questionnai res, but ther e are 8
retur n questionnair es that not give cl ear infor mati on, and w e decide to dr op it.
Table 1. show the fr equencies and per centages of the mode chosen by
respondent.
Table 1. Fr equencies and Per centages of the Chosen Mode mode Freq. Percent Cum.
public 30 32.61 32.61 car 27 29.35 61.96 motor 35 38.04 100.00
Total 92 100.00
The data on Tabl e 1, show that r espondents ar e di st r ibuted almost equally
among the alter natives. Motor cycle appear s to be the most popular mode,
compar e to car or public mode. This popul ar ity may because of motor cycle have
the shor test tr avel time among the alter natives as show n in Table 2.
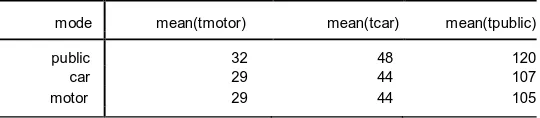
Table 2. Mean of Tr avel Time by Mode
mode mean(tmotor) mean(tcar) mean(tpublic)
public 32 48 120
car 29 44 107
motor 29 44 105
Respondent tend to choose motor cycle to tr avel w hen they face mor e congestion
spot. Tabl e 3, show us that the average number of congestion spot that face by
respondent who choose car and publ ic tr ansportation does not differ so much.
This figur e t ell us that people tend to i ndiffer ent in choosi ng betw een car or
public tr anspor tation when they face less congestion spot.
mode N(scong) mean(scong) sd(scong)
public 30 2.5 .5085476 car 27 2.22222 .4236593 motor 35 3.51429 .8178677
Fr om Table 4, w e can see that r espondent who has low er income choose public
mode. Meanw hile, for the highest i ncome tend to choose car .
Table 4. Mean of Respondent by Mode in Thousand Rupiah
mode N(income) mean(income) sd(income)
public 30 1420 99.65458 car 27 3814.81 845.6694 motor 35 1728.57 388.4899
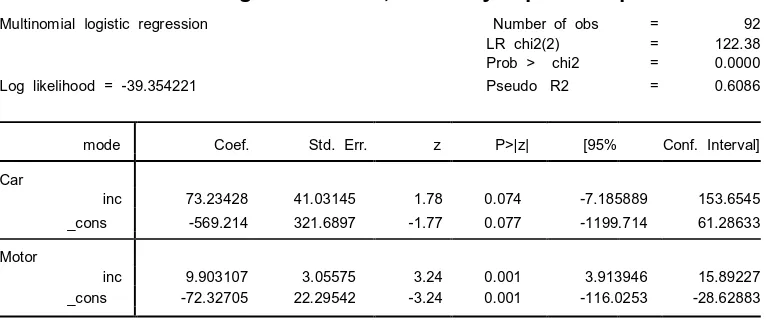
Econometric Approach and Multinomial Logit Estimation
We esti mate the passenger’s choice data using a Multi nomial Logit model, with
income and number of congestion spot as i ndependent vari abl es. Fir st, we
estimate the i mpact of income on mode choice. This setting t r y to analyze
monetar y expense i mpact on society’s choice tow ar d the transpor tation mode.
Table 5. Multinomial Logit Estimation; Monetary Expense Impact
Multinomial logistic regression Number of obs = 92 LR chi2(2) = 122.38 Prob > chi2 = 0.0000 Log likelihood = -39.354221 Pseudo R2 = 0.6086
mode Coef. Std. Err. z P>|z| [95% Conf. Interval]
Car
inc 73.23428 41.03145 1.78 0.074 -7.185889 153.6545 _cons -569.214 321.6897 -1.77 0.077 -1199.714 61.28633
Motor
inc 9.903107 3.05575 3.24 0.001 3.913946 15.89227 _cons -72.32705 22.29542 -3.24 0.001 -116.0253 -28.62883
(mode==public is the base outcome)
Table 5, tell us that the incr ease in i ncome w i ll induce the society to leave the
public tr anspor tation. When society’s income incr eases they w ill pr efer
motor cycl e compar e to public tr anspor tation. This phenomenon is causes by the
thei r income incr eases more, and then they pr efer car compar e to motor cycle.
Although the tr avel time using motor cycle is shor ter than car, using car gives
people mor e comfor t, mor e over i f the congesti on spot i s less.
The income affect society’s choice of tr anspor tati on mode. It i s in line wi th
Muk al a’s and Chunchu’s r esear ch (2011). They developed var ious choi ce models
based on the stated prefer ence dat a for modeling the inter ci ty mode choi ce
behavior in India. The r esul t found that the income and total tr avel cost play an
impor tant r ole in the mode choice decision for the inter ci ty tr anspor t.
On the other hand, car avail abi lity gives people mor e comfor t compar e to
motor cycl e or public tr anspor t. Thi s r esult i n line w ith Nur deen, et.al (2007).
They found car availabil ity i s ther efor e a major factor that deter mines the choi ce
of inter city transport mode. Resi stance to sw itching w as obser ved among
respondents w ho have one vehicle availabl e, while r espondents w ho have tw o or
mor e vehi cles w er e less r esi stant to mode change.
The second estimation is dedicated to test the val ue of ti me tow ar d society’s the
number of congestion spot as the pr oxy of val ue of ti me. The estimation r esult is
as shown in Table 6.
Table 6, tell us that an increase in the number of congestion spot faced by society
wil l causes peopl e to use motor cycle. Inter estingly, the incr ease in the number of
congestion spot mak es people to sw itch fr om using car to public tr anspor tation.
public tr anspor tation costumer, the gover nment have to decr ease the time tr avel
of this publi c tr anspor tation so can compete w ith motor cycle. It is in l ine with
other r esear ch that conducted by Alpizar and Car lsson (2001) for r educing tr avel
time.
CONCLUSION
The Mul tinomial logit estimati on shows that passenger w ho has hi gh value of
time prefer to chose tr avel by their own vehi cle, w hich is their motor cycle,
compar e to car or public tr ansport. The r eason is, because it mor e pr acti cable
and no w aiting time. The result i s analogue to the Top Gear Race, w her e the car s
or motor cycle most of the ti me w in the r ace against the publ ic transpor t. Fi nally,
from the society’s point of view, w e can say that the development of
infr ast r uctur es of public tr anspor tation, w hi ch has been done by the
gover nment, stil l less att r active compar e to the pr ivate tr anspor tation. How ever,
the government still has an oppor tunity to w in the hear t of society by incr easing
the number of bus to r educe the w aiting time. Although it is hard to compet e
with the motor cycle tr avel time and si mpl ici ty, the public transportation stil l
may w in in comfor t aspect.
RECOMMENDATION
The possibi lity of separ ati ng public transpor t by cr eating a parallel ser vice that
pr ovi des a faster service and mor e comfor t vehicle, i s one potential alter native to
detr act society’s fr om pr ivate tr ansportation. It is alr eady conduct with
Sarbagit a’s Pr ogr amme but it still need mor e effort to satisfy the society’s. Our
study sheds light on the featur es r equir ed by that system i f it is to attr act
traveler s fr om pri vate modes. Specificall y, speci al emphasis has to be put on
redesi gning r outes and exclusi ve bus l anes, and pr oviding tr affi c pr ior ity for
buses, faster connections betw een routes, and mor e fr equent and r eliable
depar tur es, among other measur es i ntended t o r educe t r avel time wi th public
transport.
REFERENCES
Alpizar, F., and Carl sson, F. 2001. Policy Implicati ons and Analysis of the Deter minants of Tr avel Mode Choi ce: An Applicati on of Choi ce Exper iment s to Met r opolitan Costa Rica. Wor king Paper s in Economics no. 56.
Gebeyehu,M and Tak ano, S. 2007. Diagnostic Evaluation of Public Tr ansportation Mode Choice in Addis Ababa.Jour nal of Public Tr anspor t at ion, Vol. 10, No. 4, 2007.pp 27-50
Hensher , D.A. 1998. The imbalance between car and public transport use in ur ban Australia: w hy does it exist?. Transpor t Policy, 5, pp. 193-204
McCarthy. P. S. 2001. Tr anspor tat ion Economics, Theory and Pract ice; A Case St udy Appr oach. Massachusett s: Blackw ellpublisher s Inc.
Meyer, M.D. 1999. Demand management as an element of t r anspor tati on policy: using car r ots and stickts to infl uence t r avel behavior. Tr anspor t ation Resear ch Par t A, 33, pp. 575-599
Muk al a, P. K. and M. Chunchu. 2011. Mode choice modelli ng for inter city tr anspor t ation in Indi a: A case of Guwahati to five met r o cities. Int er nat i onal Jour nal of Ear t h Sciences and Engineer i ng, vol. 04, no. 06 SPL, pp. 364-374
Nakamur a, K. and Hayashi, Y. 2013. Str ategi es and instr uments for l ow -car bon ur ban tr anspor t: an inter nation r eview on tr ends and effect s. Transpor t Policy, 29, pp. 264-274
Nur deen. A., R. A. O. Rahmat, and A. Ismail. 2007. Modeling of t ransportation behavior for coer cive measur es for car dri ving in Kuala Lumpur . ARPN Jour nal of Engineer ing and Applied Sciences, Vol. 2, no.2, pp.18-24
Paulley, N., Balcombe, R., Mackett, R., Tither idge, H., Pr eston, J., War dman, M., Shir es, J., Whi te, P. 2006, The demand for public tr anspor t: the effects of far es, quali ty of ser vice, income and car ow ner ship. Transpor t Policy, 13, pp. 295-306
Setiaw an, R. 2013. Fixing Indonesia’s Public Transport Woes. Comment ar y Ar t icle on The Jakar t a Globe. Nov. 4th. 2013. Retr ieved July 27 2014 fr om
http:/ / w w w .thejakartagl obe.com/ opinion/ commentary/ fi xing-indonesias-public-tr anspor t-woes/
Shy, Oz. 1995. Indust r ial Or ganizat ion Theory and Applicat ions. Cambr idge: MIT Pr ess.