A Comparative Dissolution Test between Generic and Branded Name of Furosemide
Tablets
Henny Lucida, Erizal and Sri Rahmi
Departement of Pharmacy, FMIPA, University of Andalas Padang
Diterima tanggal : 27 Juli 2006 disetujui : 05 September 2006
Abstract
A study on comparative dissolution rates betwen two generic tablets and two branded name of furosemide tablets has been undertaken. Method applied was paddle method as required by FI IV, and furosemide concentration was measured spectrophotometrically at maximum wavelength of 277.5 nm. The dissolution profiles were drawn from the plot between percentage of furosemide dissolved versus time, and linearized according to Langenbucher equation. Results showed that at 5 th minute of dissolution, the dissolution rates between generic
tablet A1 and brand name tablets B1 and B2 were not significantly different but there was a significant difference
between tablets A1, B1, B2 and generic tablet A2. At 10th minute, the dissolution rates between brand name tablets
(B1 and B2) were not significantly different, but there was a significant difference between brand name tablets
(B1 and B2) and generic tablets (A1 and A2). At 15th minute, all tablets showed a significant difference in
dissolution rates.
Keywords: comparative dissolution, furosemide tablet, dissolusion profile
Introduction
Furosemide (4-chloro-N-furfuryl-5-sulfamoilanthranilic acid) is a potent and short duration diuretic used for the therapy of oedema, and hypertension (Katzung, 1995). This compound is widely used and also a fast moving drug (Gemari, 2006). Being practically insoluble in water (Indonesia Pharmacopeia IV), the bioavailability of furosemide is dissolution rate-limited (Waller, 1982). It is a polimophous substance which consisted of 7 forms (4 true polymorphs, 2 sovates and 1 amorphous) (Bauer et al., 2002) which has significant contribution to variability in the dissolution profile among its dosage forms.
Furosemide tablets are found commercially in several brands with different prices. The branded names are much more expensive than the generic tablets, for example the price of branded name “L” is 32 times higher than that of the generic tablet (ISFI, 2003). It is our interest to ensure whether higher price correlates with better quality and vice versa. Further, the results might support the disintegration tester (Sinsho), tablet friability tester
(Friabilator-Roche), dissolution tester (Pharma Test PT-DT7), pH meter (Metrohm Herisau E 520), analytical balance (Denver Instrument M-220 D) and stopwatch.
Materials: Furosemide (courtesy of Kimia Farma), generic furosemide tablets: A1 and A2, branded furosemid tablets: B1 and B2, phosphate buffer pH 5,8, NaOH, methanol, ethanol and aqua destilata.
Sample collection
Samples were randomly taken from commercially available furosemide tablets (drug content was 40 mg) in Padang, consisted of 2 generic tablets A1 and
A2 and 2 branded name furosemide tablets B1 and
B2 which were 62 tablets each.
Determination of the maximum wavelength and the calibration curve of furosemide in phosphate buffer pH 5.8
Ten mg of furosemide was dissolved in a 100 mL flask which then diluted with pH 5.8 phosphate buffer to obtain a series of solutions with concentration of 4, 6, 8, 10, 12, dan 14 µg/ml respectively. The absorption of each solution was measured at maximum wavelength of furosemide.
Tablet evaluation
2 . 0 0 A
Comparative dissolution test of furosemide (Indonesia Pharmacopeia IV)
Dissolution test of 6 tablets from each brand was performed by using paddle method (stirring rate of 50 rpm) with a medium of 900mL pH 5.8 phosphate buffer solution at 37o ± 0,5oC. Samples
were taken at 5, 10, 15, 30, 45, 60 minutes respectively. The concentration of furosemide dissolved were determined by spectrophotometry UV-visible. The dissolution profile of each brand was plotted and data were then analyzed according to Langenbucher equation:
log
ln
1
m
b
log
t
Ti
log
a
Where: m = fraction of drug dissolved at time t a = scale parameter
t = time Ti = lag time
b = curve parameter ; where b = 1 for exponential curve b > 1 for S curve
b < 1 for curve with higher slope than lag time
Parameters such as Td and T80% of each brand were
then submitted to statistical analysis. The percentage of furosemide dissolved from each brand at 5th, 10th and 15th respectively were analyzed
by using t sudent analysis.
Results and Discussion
The maximum wavelength of the absorption of furosemide solution in pH 5.8 phosphate buffer was 277,5 nm (Figure 1). The spectrometric analysis validation showed a linear plot of concentration vs absorption (y = 0,0588x + 0,0018; r = 0.9992).
Figure 1. The UV spectrum of Furosemide in pH 5,8 phosphate buffer solution
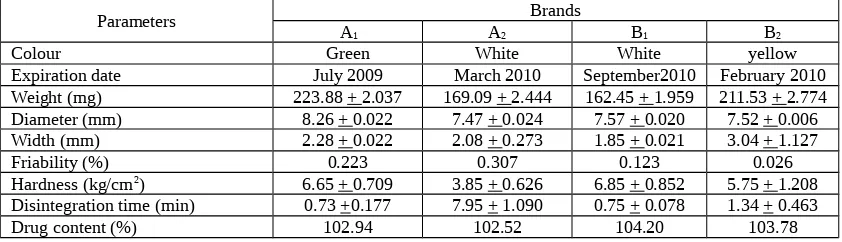
Evaluation of the physicochemical and pharmaceutical properties of furosemide tablets showed that all brands fulfilled the requirements of The Indonesia Pharmacopeia IV (Table 1) except for the hardness of tablet A2 which was slightly
lower than required (4 – 8 kg/cm2). Each brand
showed a significant difference in disintegration time which corresponded to different mechanism of disintegration process. Tablet A2 which had a low
hardness but showed the highest disintegration time.
Table 1. Physicohemical and Pharmaceutical properties of furosemide tablets
Parameters A Brands
1 A2 B1 B2
Colour Green White White yellow
Expiration date July 2009 March 2010 September2010 February 2010
Weight (mg) 223.88 + 2.037 169.09 + 2.444 162.45 + 1.959 211.53 + 2.774
Diameter (mm) 8.26 + 0.022 7.47 + 0.024 7.57 + 0.020 7.52 + 0.006
Width (mm) 2.28 + 0.022 2.08 + 0.273 1.85 + 0.021 3.04 + 1.127
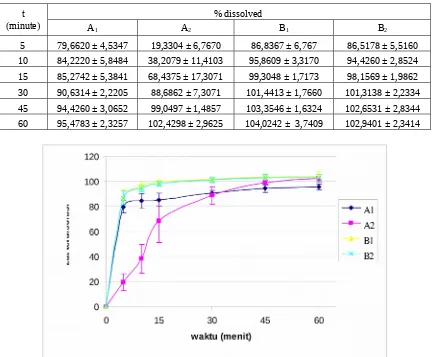
The dissolution profile of all brands of furosemide tablets (Figure 2) was obtained by plotting the percentage of furosemide dissolved versus time (Table 2). The profile showed that tablets A1, B1 and
B2 dissolved more rapidly than tablet A2 . These
correlated well with the disintegration time of each brands. Furosemide had 7 type of polymorph which
may contribute to a different in solubility and hence dissolution time among brands (Bauer et al., 2002). Furthermore, the type of excipients used in the formula also determined the physicochemical and pharmaceutical properties of tablet.
Table 2. The amount of furosemide dissolved in pH 5.8 phosphate buffer solution
at various times
t (minute)
% dissolved
A1 A2 B1 B2
5 79,6620 ± 4,5347 19,3304 ± 6,7670 86,8367 ± 6,767 86,5178 ± 5,5160 10 84,2220 ± 5,8484 38,2079 ± 11,4103 95,8609 ± 3,3170 94,4260 ± 2,8524 15 85,2742 ± 5,3841 68,4375 ± 17,3071 99,3048 ± 1,7173 98,1569 ± 1,9862 30 90,6314 ± 2,2205 88,6862 ± 7,3071 101,4413 ± 1,7660 101,3138 ± 2,2334 45 94,4260 ± 3,0652 99,0497 ± 1,4857 103,3546 ± 1,6324 102,6531 ± 2,8344 60 95,4783 ± 2,3257 102,4298 ± 2,9625 104,0242 ± 3,7409 102,9401 ± 2,3414
Figure 2. Dissolution profile of furosemide tablet A1, A2, B1 dan B2 in pH 5.8 phosphate buffer solution.
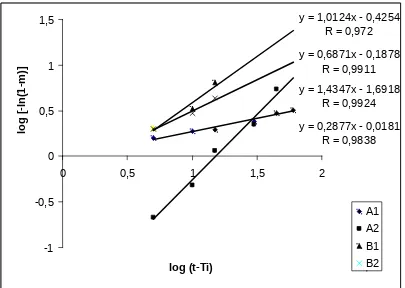
The dissolution data were then analyzed according to Langenbucher equation to determine the kinetic profile. All data showed a good agreement with this
equation (Table 3 and Figure 3) which allowed the calculation of Td and T80% parameters from the best
fit curve .
Table 3. Regression analysis of dissolution data of various brands of furosemide tablets according to Langenbucher equation
Brand Linear Equation r
Tablet A1 y = 0,2877x – 0,0181 r = 0,9838
Tablet A2 y = 1,4337x – 1,6918 r = 0,9924
Tablet B1 y = 1,0214x – 0,4254 r = 0,9721
Figure 3. Langenbucher plot of the dissolution of furosemide tablet A1, A2, B1 dan B2 in pH 5.8
phosphate buffer solution.
Td is time needed for the dissolution of 63.2% from the tablet. Td for tablet A1, A2, B1 dan B2
respectively was 1,1559; 15,1078; 2,6314; and 1,8764 minutes. The T80% parameter, the time
needed for 80% dissolution, for furosemide tablet required by the Indonesia Pharmacopeia IV is 60 minutes. The T80% for each brand was 4,5227;
21,0501; 4,2105, and 3,7507 minutes respectively for tablet A1, A2, B1 dan B2 which fullfiled the
requirement. Again, both parameters showed the longest time for dissolution of furosemide from generic tablet A2 which correlated well with its
disintegration time.
The percentage of furosemide dissolved at 5th, 10th
and 15th minutes respectively were analyzed
statistically using T student test. Results indicated that there was a significant difference of % furosemide dissolved between tablet A1 and A2;
A1and B2; A2 and B1; and between A2 and B2 (T calc
> T tab) at 5th minutes of dissolution. However
there was no significant difference between tablet A1 and B1; B1 and B2 (T calc < T tab). At 10th
minutes, there was a significant difference of % furosemide dissolved between tablet A1 and A2; A1
and B1; A1 and B2; A2 and B1; and between A2 and
B2 (T calc > T tab), only that between tablet B1 and
% furosemide dissolved among all brands (T calc > T tab).
In summary, all brands met the requirements of the Indonesia Pharmacopeia IV especially in dissolution time (T80%), with the fastest was branded
name tablet B2 and the slowest was generic tablet
A2 while that of generic tablet A1 and branded
name tablet B1 showed a similar value. The
bioavailability of furosemide is dissolution rate limited, thus the dissolution rate of furosemide may closely related to its fate in-vivo. These results also showed that higher price does not always correlate with better quality because the dissolution profile and also probably the bioavailability of generic tablet A1 and branded name tablets B1 and B2 were
not significantly different. Thus the use of furosemide generic tablet prescribed for common people is highly supported.
References
Departemen Kesehatan Republik Indonesia, the Indonesia Pharmacopeia , ed. IV, Jakarta,1995.
Gemari, KB, “Harga Obat Generik Turun”, 2006.
www.kbi.gemari.or.id/beritadetail.php? id=2559
Ikatan Sarjana Farmasi Indonesia, ”Informasi Spesialite Obat Indonesia”, Volume 38-2003.
Katzung, B.G., Basic and Clinical Pharmacology, 6th ed. , Appleton Lange, London, 1995