METRICS
for IT Service
Management
METRICS
for IT Service
Management
About the ITSM Library series
The ITSM Library publications cover best practices in IT Management. The authors are leading specialists in their discipline. This series is published by Van Haren Publishing on behalf of ITSMF Netherlands (ITSMF-NL). The IT Service Management Forum (ITSMF) is the association for IT service organizations, and for customers of IT services. ITSMF's goal is to promote innovation and support of IT Management. Suppliers and customers are both represented within the ITSMF. The exchange of peer knowledge and experience is ITSMF's main focus; by publishing the ITSM Library series ITSMF-NL hopes to contribute to this exchange. The following publications are, or soon will be, available:
Introduction- and Foundations books
• Introduction to ITIL®(English, Danish, Italian, German, Portugese, Russian, Japanese)
• Foundations of IT Service Management based on ITIL®
(English, Danish, Italian, Dutch, German, Portugese, Russian, Japanese)
• IT Service Management, an introduction - based on ITIL®(French, Spanish, Chinese)
• ASL - A framework for Application Management (English)
• BiSL - A framework for Business Information Management (Dutch) • IT Services Procurement based on ISPL (Dutch)
• Project Management Based on PRINCE2®- An Introduction (English, Dutch, German)
Best practice books
• IT Service Management - best practices, part 1 (Dutch) • IT Service Management - best practices, part 2 (Dutch) • IT Service Management - best practices, part 3 (Dutch) • Metrics for IT Service Management (English)
• Six Sigma for IT Management (English)
Pocket guides
• ISO/IEC 20000, a pocket guide (English, German, former BS 15000) • IT Services Procurement based on ISPL, a pocket guide (English) • IT Governance, a pocket guide based on COBIT (English) • IT Service CMM, a pocket guide (English)
• IT Service Management - a pocket guide based on ITIL®(Dutch)
• IT Service Management from hell! (English)
Colophon
Title: Metrics for IT Service Management
A publication of: ITSMF-NL
Editorial team: Peter Brooks (lead author) Jan van Bon (chief editor) Tieneke Verheijen (editor)
Publisher: Van Haren Publishing, Zaltbommel, www.vanharen.net
ISBN: 90 77212 69 8
Copyright © ITSMF 2006
Version: First edition, first impression, April 2006
Design & Layout: DTPresto grafisch ontwerp & layout, Zeewolde - NL Printer: Wilco, Amersfoort -NL
For any further enquiries about Van Haren Publishing, please send an e-mail to: [email protected]
The International ITSMF organization, through its International Publications Executive Sub-Committee (IPESC), comprised of a council of members from global ITSMF chapters has given its formal ITSMF International endorsement to this book.
All rights reserved. No part of this publication may be reproduced in any form by print, photo print, microfilm or any other means without written permission by the publisher.
Foreword
Wherever Service Management is discussed around the globe the topic of Metrics soon follows. For those implementing or involved with IT service management a method of measuring results is fundamental.
Measurement within an organization can either be relatively subjective and informal or rigorously applied within the context of a formal standard or framework. However, regardless of the interpretation, one factor remains: the Metrics used must be relevant to the business objectives and the expected outcomes to be of any value.
I am pleased to say that this book will serve its readers well here. As the Chair for the ITSMF International Publication committee (IPESC), I am very proud to officially add our Committee’s formal endorsement of this publication.
The IPESC, through its council of members, their efforts and dedication create added value to the community of ITSM professionals, by endorsing the development of a common global library which supports a uniform standard of ITSM best practices and knowledge.
Our endorsement process is a rigorous one, with stringent criteria that any ITSM-related publication must meet before it can be endorsed by the IPESC.
On behalf of the ITSMF global community, I wish to thank the IPESC for their efforts and endorsement of this book.
I know that you will find it informative and a valuable addition to your ITSM library in support of your journey toward service excellence.
Sharon Taylor
7 Practical Metric Production . . . .51
7.1 Reasons for metric choices: Configuration Management as an example . . . .51
7.2 Data Model for Measuring Metrics . . . .57
7.3 Prioritizing and scoring the metrics . . . .59
8 Specific Metrics for IT Service Management . . . .63
8.1 Metrics for Operational Service Management Processes . . . .65
8.2 Metrics for Tactical Service Management Processes . . . .68
8.3 Metrics for strategic Service Management Processes . . . .71
8.4 Metrics for Programme and Project Management (S) . . . .74
9 Integrating Metrics . . . .75
9.1 Governance . . . .75
9.2 ITIL - ISO20000 (BS15000) . . . .76
9.3 eTOM . . . .76
9.4 COBIT . . . .77
9.5 Six Sigma . . . .78
10 Implementing Metrics . . . .79
10.1 Activities . . . .79
10.2 Critical Success Factors . . . .80
10.3 Possible problems . . . .81
10.4 Service Reporting . . . .86
11 Continuous improvement with metrics . . . .93
A Metrics for Incident Management . . . .95
B Service Desk metrics . . . .101
C Metrics for Configuration Management . . . .107
D Metrics for Change Management . . . .111
E Metrics for Release Management . . . .117
E.1 Application Support metrics . . . .121
E.2 Application Development metrics . . . .124
F Metrics for Operations Management/ICT Infrastructure Management . . . .127
G Metrics for Service Level Management . . . .131
H Metrics for Problem Management . . . .137
J Metrics for Capacity Management . . . .147
K Metrics for IT Service Continuity Management . . . .153
L Metrics for Availability Management . . . .157
M Metrics for Security Management . . . .163
N Business Perspective metrics . . . .169
N.1 Business Relationship Management . . . .171
N.2 Supplier Relationship Management . . . .171
N.3 Providing IT services . . . .173
N.4 Planning, Review and Development . . . .174
N.5 Liaison, Education and Communication . . . .175
O Metrics for Continuous Service Improvement Programmes (SIP) . . . .177
P Risk Management metrics . . . .183
Q Documentation Management metrics . . . .189
R Metrics for Competence, Awareness and Training (CAT) . . . .193
Introduction
IT service organizations are increasingly implementing Quality and IT Service Management standards. The IT Infrastructure Library (ITIL, ISO20000), Control Objectives for Information and Related Technology (COBIT), Six Sigma, enhanced Telecom Operations Map (eTOM) and Sarbanes Oxley (SOX) are emerging as some of the more popular standards in addressing IT Service Management, governance, quality and operational issues.
This book considers the design and implementation of metrics in service organizations using one or more of the frameworks mentioned above. It uses the ITIL process structure and many principles from the ITIL and ISO20000 (originally produced in the UK as BS15000) as a basis. It is a general guide to the use of metrics as a mechanism to control and steer IT service organizations.
Implementing IT Service Management as a series of interlocking processes - with ‘process’ strictly defined - enables a consistent view to be taken across the many disciplines that exist in a modern IT department.
This consistent view has been adopted as Best Practice by thousands of organizations across the world, with excellent results. The ITSMF is an independent organization that champions the cause of IT Service Management in many countries by holding events, working to improve the practice advocated by ITIL through knowledge and experience sharing, whereby driving continuous refinement of the practice, and producing books such as this.
The ITIL processes all devote a section to possible metrics, giving an excellent starting framework for setting up metrics. For example, there is a chapter focusing on Key Performance Indicators (KPIs) in the ITIL Best Practice book ‘Planning to Implement Service Management’. This guide deals specifically with the issue of setting up metrics in the context of IT Service Management frameworks, with a special focus on ITIL.
A major reason for writing this book is that many organizations have found it very difficult to use metrics properly. This book will deal with the causes of the difficulties to implementing metrics and will present workable solutions.
The book is a general guide to the design, implementation and use of metrics as a mechanism to control and steer IT service organizations. It also provides specific recommendations for applying metrics across the ITIL, ISO20000 and other processes, discussing the rationale of the recommendations. This enables an organization to implement the metrics as described directly as a first-pass solution that can be benchmarked against other organizations. But they can also be used as a starting point for customizing particular metrics.
The recommended audience for this book is service managers, process owners, consultants, general IT management and anybody interested in mastering metrics of IT Service Management.
1
What are metrics all about?
A ‘metric’ is just another term for a measure. In IT, metrics have come to mean particular things to different people. Though this book is about metrics, it is important to remember why we use metrics. Simply measuring things for the sake of it is expensive and pointless. Metrics themselves are not an end. Metrics are an important part of the Management System that steers and controls IT in the desired direction. As we will see, Metrics must be designed in line with customer requirements, they must be benchmarked to ensure that they are achievable and they must be monitored to ensure that they keep within desired thresholds with action taken to correct any problems. They also are the target of the Continuous Service Improvement Programme (SIP), as processes and services are continuously improved, so are the metrics that measure them. It is important to understand what the business’ objectives are and ultimately arrange that all measuring, monitoring and control is aligned to attaining these objectives. This chapter discusses ways to ensure this.
1.1 Objectives
The aims, or the objectives, of using metrics in IT Service Management are:
1. to align business objectives with IT
• to provide accounting for IT processes and deliverables, • to inform stakeholders of IT Service Management,
• to assist stakeholders in understanding IT performance and issues.
2. to help achieve compliance requirements for business operations • to steer IT operations strategically,
• to help attain ISO20000, COBIT or other certifications,
• to achieve Critical Success Factors (CSFs) - see later discussion section 1.3 and 10.2, • to minimize interruption of the business. • to prove the value creation of the IT organization.
In short, to steer the particular area being measured in the right direction.
1.2 Business & IT Alignment
1.2.1 Metrics as Management Information
The business has to understand how well its business processes are performing. IT plays an important role in three ways to assist with this.
Firstly, IT nowadays often is responsible for providing accounting, logistical and other direct services to business processes. Accordingly, the measures are provided in management reports to the various business units - for example SAP reports on sales, provided to the Sales team.
Secondly, IT provides services to business processes documented in the Service Catalogue, with the detail of delivery defined in the various SLAs set up between the Service Level Manager and business customers. These measures are shown as exception reports to Key Performance Indicators (KPIs) based on negotiated SLAs. Trends in these reports show how IT is improving its ability to provide services to a high standard.
Thirdly, IT itself is an important business process, a business contingency plan without a substantial section on IT service continuity is rare! Thus, IT reports on the operation of IT processes are part of the management information required by the business. These metrics form the bulk of the discussion in this book. They’re based on the measurement of IT Service Management process operation.
This information is, however, business information, so detailed technical metrics are not appropriate. Rather the condensed results of measurement of IT processes can be presented in business terms. Ultimately business measures are monetary measures so the aim of IT is eventually to provide Return on Investment (ROI), Return on Capital Employed (ROCE), Economic Value Added (EVA) or any other expression.
Before this can be done, however, IT Financial Management, in ITIL terms, must have reached a high level of maturity. Until then, measures of process efficiency, along with KPIs against SLAs provide the most complete picture of IT’s services to the business.
Once clear and relevant metrics have been designed, it is important that they are presented clearly. Various ways of achieving this are discussed below, such as ‘balanced scorecard’, ‘traffic light’ and ‘dashboard’ systems. Different reporting methods and different sets of metrics will be appropriate for different audiences. The naming of metrics is also important so that, if a metric is changed from one reporting period to another this is made clear.
If processes are not implemented in a consistent, repeatable manner, the metrics produced by them will be unreliable. It is important, as ISO20000 emphasizes, for there to be a sound Management System in place with sufficient maturity and process management to be part of an organization’s way of doing things for metrics to provide useful measurement.
1.2.2 Metrics for Management Control
When something in business is measured, particularly when this measure is made the responsibility of a manager or a team of people, the behavior of the people measured changes.
requirements, this behavior will tend to be in line with these business requirements. In other words, a well designed and measured metric is a method of control. If a metric is not well designed, is not in line with actual business requirements or is not measured correctly then this ‘control’ can drive behavior in the opposite direction and harm the operation of the business.
There are many examples of this. Just one will suffice to show the problem. In the UK, the government decided that the length of time patients had to wait for operations was a useful metric. To measure this it set targets to reduce the length of waiting lists. The result was exactly the behavior the government had requested. The waiting lists got shorter and the targets were met. However patients were actually waiting just as long for their operations as before. Hospital administrators were not allowing patients to be entered onto the waiting list until their operation had been scheduled to a time within the target waiting time. Thus, a second, informal, waiting list came into being. On it were those waiting to be allowed onto the waiting list!
This example is a good one for a few reasons. One is that it shows the ingenuity of people in working to produce exactly what is asked for, and measured, rather than what is actually sought, the letter of the law rather than the spirit of the law. It also shows that a measure must be designed to actually measure what is important. In this case a waiting list was measured. However, it would have been more appropriate, but quite possible more difficult, to measure patient referral dates against patient operation dates. So, the design of the measure is important. The final problem was that the process itself was not measured, so when a new process (the informal waiting list for the waiting list) was invented by hospital administrators, it was not visible to the government auditors.
Another problem many organizations have met is indecision. If metrics have been badly designed, they have to be changed, of course. However, if they are changed to try to address the immediate problem, rather than carefully designed, the new metrics may prove almost as bad. This will then mean that they have to be changed again. If metrics are changed every few months there is no reason for anybody to work hard to achieve them. People soon work out that they only have to wait for the change, and there will be a new period of uncertainty in which there is no effective metric and hence no effective management control. An organization under the effect of constantly changing metrics is likely to be worse off than one with no metrics at all.
We are all happy to work for goals that we think have a reasonable chance of attaining. We also work better if we are given recognition, and sometimes even praise, when we do a job well. If we are asked to do an impossible job, we know that we can only be blamed for not managing to do it. The natural human response to this is to give up and simply go through the motions of trying. Metrics must be set to be perceived as achievable and make business sense so as to encourage positive change of behaviour.
The moral of this is that metrics must be achievable and recognition and praise must be given to those who achieve and excel in over-achieving against the metrics.
1.2.3 Metric integration & Reporting
Metrics do involve detailed measures of technical matters. This is unavoidable. However, once the key metrics have been set, these can be reported using the ‘traffic light’ or ‘dashboard’ methods, discussed in detail in chapter 7. This method allows a ‘drill-down’ into the detail to occur when a problem is isolated at the top level.
If the metrics for different processes are designed in a similar way, the management of these processes can be compared with each other. Though the Change Management Process is a very different thing from the Availability Management Process the management, maturity and effectiveness of these two processes can be compared by having similarly structured integrated metrics, particularly if these metrics include an accurate measure of customer satisfaction, in which the ‘customer’ is defined as the main beneficiary from the output of the process.
For example: if Availability Management has a score of 8.5 on the weighted sum of its ten metrics and Change Management has a score of 10.8 on its metrics, we can see that Availability Management is less in control of its processes than Change Management, even though the processes themselves are quite different.
How these scores are set and exactly what they might mean will be the subject of chapter 7.
1.2.4 Metrics aligned to stakeholders
Communication is a vital part of IT Service Management. If stakeholders are being informed by metrics, they can contribute to the success of the enterprise by supporting the openness and transparency, and by seeing the improvement. Each section below discusses the needs of particular stakeholders and how they fit into the customer relationship diagram (figure 6.1).
This enables appropriate communication of metrics, their results and what these results mean in terms of delivery of services to stakeholders. Stakeholders need to be an integral part of IT definition and satisfied with the results they see from their active involvement.
Communication is a two-way process so it is important to integrate requirements from the various stakeholders and use their involvement throughout to improve service delivery and process operation.
For this to be handled properly, it is important that it is dealt with using a carefully constructed communication plan, using stakeholders to assist in its construction and review.
Customer
In this book, by using the word ‘customer’, we usually mean the purchaser of a service, be it internal or external. In this section we refer to the end customer of the business. Ultimately all business effort ought to be directed towards the end customer. IT provides a support function for the business processes, but sometimes the IT contribution is experienced by the business, end customer (the ultimate customer) as well.
sensitively. If we demand surveys too frequently from customers, this activity itself will become a negative factor to them. If we don’t solicit advice on how well we are doing often enough, there is a danger of not being aware of service incidents for long enough for them to impact our customer satisfaction seriously.
User
Since users do not negotiate the terms of their service and do not pay for it, they are not direct customers of IT. However, as stakeholders, their satisfaction with the service is vital. If users are not satisfied as they are being supplied with poor quality services, eventually our customers will not be satisfied.
Employee
Employees within IT have the responsibility to deliver service processes. IT, in return, has the responsibility to supply good working conditions with fair evaluation and reward. If employees are not satisfied the service levels provided will be less than they ought to be, no matter how well defined the metrics are. Thus, it is an imperative of IT management to measure staff morale and be sensitive to changes that might impact it negatively.
Employees are happier when they feel recognized as a stakeholder. Also, they need to be able to identify with their employer, out of positive respect for the business, and approval of the processes. Communicating metrics to employees clearly and openly, enables them to understand where IT is doing well and where there are issues that require further effort. Effective communication enables employees to address issues and to find an inspiration to further effort.
Board
Senior management and the Board have a particular need, as stakeholders. In order for the business to strive, they require advance warning of any potentially serious incidents so that urgent corrective actions can be taken. An open and transparent communication with the Board can help as these incidents can be identified before they become too serious to remedy.
Good news is also important to the Board. It can be communicated both within and outside the company to enhance its reputation. The attainment of ISO20000, for example, ought to be an opportunity for the Board to report the achievement with pride.
Other stakeholders like government and shareholders
1.3
Why Metrics are not SLAs
The agreement between the business organization, the customer, and IT is negotiated by the Service Level Manager and results in a set of defined Service Level Agreements (SLAs). These SLAs define what service levels IT agrees to provide.
These SLAs are used by the Service Level Manager to define the Operational Level Agreements (OLAs) and, where third parties are involved, the Underpinning Contracts (UC) that enable the service to be delivered.
The Critical Success Factors (CSFs) for IT are defined by the OLAs - if you look at it from a bottom-up point of view. If an OLA is met then the relevant CSF will be satisfied - if the match between them is good. Actually OLAs are derived from SLAs which rely on CSFs, so are broader in scope than a particular OLA may be. For a member of the organization, though, the CSF can be seen as the goal of the OLA.
CSFs are the service delivery measures that must be met to satisfy the SLAs. Each CSF can then be used to define a Key Performance Indicator (KPI) that is a measure of whether the CSF is being delivered.
Thus the entire chain:
Customer Requirement > SLA > OLA/UC > CSF > KPI > Monthly Report
is driven directly by the customer requirements and the KPIs can be measured and reported back to the customer to show how effectively the IT organization is meeting the agreed service levels.
1.4 Metrics and KPIs
As we see above, the KPI provides a customer facing metric that measures the success with the SLAs defined with the customer.
This enables IT management to know each month whether it is doing well or not. This is too late to do anything about it! It is no good having a petrol gauge in your car that tells you that the tank is empty. You need one to tell you how full the tank is so that you can fill up before it becomes a problem.
In just the same way, IT management must have measures that show how the organization is operating daily or weekly so that corrections can be made before SLAs are compromised.
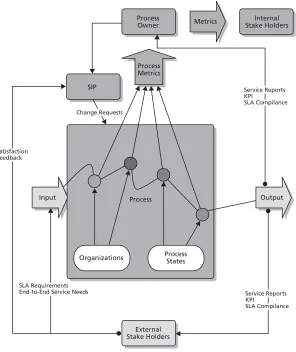
Figure 1.1: General Process Schematic
The process flow between Organizations and/or Process States is shown along with the contribution to Metrics. This diagram also shows the alignment between this process and both internal and external stakeholders. Dark grayrepresents processes and organizations internal to IT whilst pale grayrepresents external connections and organizations.
As can be seen, for the process owner to control the working of the process to deliver its goals, KPIs are defined for the process. These are measured daily or hourly and triggers on thresholds decide escalations to enable corrective actions.
Each process, however, working with the other ITIL processes, must be managed by metrics that can be reported to IT management and to other stakeholders, to contrast the process operation of the different IT processes. The careful selection and measurement of the process metrics as shown enables the management of the process, as a process, the measurement of the process owner and, where relevant, the process team. These metrics include some of the KPIs used by
Process Owner Process Metrics SIP
Process
Input Output
Organizations ProcessStates
External Stake Holders
Metrics Stake HoldersInternal
Satisfaction Feedback
Change Requests
Service Reports KPI
SLA Compilance
Service Reports KPI
SLA Compilance SLA Requirements
the process owner. He, however, is likely to use a larger set of metrics, giving more detail of day-to-day changes in process delivery, thus providing more hands-on management.
1.5
Metrics and Benchmarking
Over a longer period of time it is possible to measure previous results of metrics and compare one month or year to previous months and years. These comparisons can be used to set performance improvement goals.
There are two problems with this. Firstly, when metrics are introduced, it is not clear what an acceptable or ideal level of performance might be. In order to establish this, it is necessary to produce an initial base level or ‘benchmark’. This is often done by running the metrics for two or three periods and then taking the values produced as a ‘benchmark’ of the minimum requirement and working from there.
The second problem is knowing whether this benchmark compares well or badly with other organizations. If your metrics are uniquely set for your organization this will be an impossible question to answer! Nobody else uses your metrics, so only you know what values are possible.
There are two approaches to resolving this. Some research organizations have produced lists of standard metrics with average results across a number of organizations. If you measure these same standard metrics then these figures can be used to identify how your organization sits relative to the average.
The other approach is to use either a standard set of metrics, or a set modified from a standard set, such as those in this book. Then it is possible to compare your metrics directly with other organizations using the same, or very similar, metrics.
A hybrid approach is also possible. If you implement your own metrics, but also measure two or three of the published research metrics, then benchmarking the research metrics can give an external view, giving an insight into how well the processes work.
If, for example, the research metrics show your organization to be between 95 per cent and 115 per cent against the average, then the other metric goals can be scaled to fit within the same range. At some future time, if your own metrics are, say, 120 per cent to 130 against this benchmark then it can be reasonably assumed that you are at approximately that level relative to the organizations in the benchmark.
2 Why
Metrics?
- Cheshire Puss - she began, rather timidly, as she did not at all know whether it would like the name: however, it only grinned a little wider.
- Come, it’s pleased so far - thought Alice, and she went on. - Would you tell me, please, which way I ought to go from here?
- That depends a good deal on where you want to get to - said the Cat. - I don’t much care where - said Alice.
- Then it doesn’t matter which way you go - said the Cat. - So long as I get somewhere - Alice added as an explanation.
- Oh, you’re sure to do that - said the Cat - if you only walk long enough.
Alice in Wonderland, Lewis Carroll
We rely on metrics every day for many of the things we do. We simply do not think of them in quite that way! It is important to put metrics into perspective because there is a danger of being carried away. If you know what you want to do, or where you need to go, then you can decide what you need to measure to know how you are doing your way to get there and how it will help you. If you are given a machine with many different instruments, there is a temptation to find the instruments themselves exciting rather than what that machine is really useful for.
As with Alice, if we do not care where we are going it does not matter what we measure. If we do not measure where we are going then we are sure to get somewhere. But probably not where we would like to be!
2.1 Metrics as an instrument
The speedometer in a car or aircraft generates metrics; it provides a measure of how fast the driver is going. He will be aware when he’s driving too fast, because he knows the maximum speed, and therefore knows what to do: brake or release the gas.
Before the days of very fast cars and speed traps, this was an unnecessary thing to measure. After all, you could tell how fast you were going from the wind in your hair and your speed around corners!
From even the earliest days a much more important instrument was the fuel gauge, particularly in aeroplanes. If you run out of fuel in a car you either have a long walk or, if you have come prepared, have to fill up from a spare can (a dangerous option). When you are flying your options are more limited so an accurate fuel gauge is that much more important.
An oil level indicator will be a close second since this can cause your engine to seize. These days, however, though these instruments are important, they are usually so reliable that we only need to know when it is time to fill up or when there is danger of overheating.
With these metrics, it is quite easy to see how the process model works. Consider the speedometer. The input will come from a transducer on the wheel. The output is the level of the indicator needle on the dial. The throughput, or the operation of the process itself, is the gearing (or now electronics) in the speedometer itself that translates the transducer input in so many thousands of turns into the output in so many kilometers per hour. The appropriate target levels of outcome will vary.
On a motorway they will be different from on a farm track. And the optimal outcome for the engine, as shown by the speedometer and the rev counter (tachometer), may not be appropriate because of legal speed restrictions.
The speedometer and odometer are less crucially important, to the functioning of the vehicle, but are more important to our trip. If we know the distance and at what time we are due to arrive, we can adjust our speed depending on the distance we see that we have come. If we have plenty of time in hand, we can even take breaks to ensure that we are alert enough to drive safely.
With all this in hand, our KPI, the matter that will decide if we arrive on time or not, might well be our ability to read the map properly, or a cell phone to help us navigate the last few kilometers to our destination with the help of landmarks and advice from those we are visiting. These are not instrumented (unless we have GPS in the car!) so it is less easy to measure unless things go wrong. This last point is another one to keep in mind with IT metrics!
2.2 Metrics as a control
The true control of a car is through the steering, the accelerator, brakes and gears. These allow us to control the car through minute changes to the road surface, unexpected hazards and other short-term contingencies. These are similar to day-to-day management in a company - or what is sometimes called ‘micro-management’, too much concern with the fine detail. This is not to say that the fine detail is not important, if you run over a log in the road and have a puncture, your journey time will certainly suffer!
The real long-term control comes from good planning, just like anything else! Properly selected metrics, with proper management, encourage properly defined activities that allow us to increase the certainty that we will arrive on time at the end of the journey. How often the car is serviced is one very long-term but important metric.
Some instruments, the rev counter, for example, do not seem immediately valuable, some cars don’t even have them. A sensitive driver, however, can use one to get the optimal performance from the car, without putting the engine under too much strain. If you were running a rally, points could be given to competitors who never redline the rev counter, but complete in the fastest time with the use of the minimum fuel. That calls for excellent driving, excellent planning and excellent navigation.
This long analogy applies pretty directly to IT metrics. In IT, there are KPIs that are so important that we just expect them to be done, like the fuel gauge being accurate! Other metrics are difficult to gather and only very sophisticated and mature IT organizations will need them to get optimal performance, like rev counters. Meanwhile most IT organizations will benefit greatly from using metrics to control the ride so that life is not all fire-fighting, sharp cornering, extreme braking, and the business, and people in IT, are comfortable enough to give of their best without unnecessary stress. It is important to remember that the measure is not enough to ensure the result - the activity must be managed in line with the metric - a well designed speedometer will not make you obey the speed limit!
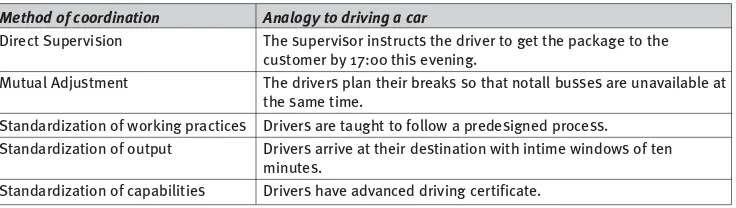
Five different methods of coordinating organizational activities have been identified (Mintzberg). These can be likened to the various instrument options in the analogy, as table 2.1 shows.
Table 2.1 Five methods of coordinating organizational activities and their analogies to driving a car (after Mintzberg).
In the above examples, we see various ways of requesting desired results. Some require underlying metrics to be in place to help the measure - checking that all drivers have advanced driving certificates, for example. Others are ad hoc and need to be documented individually.
For IT management we can see that much of what occurs today is at the ‘Direct Supervision’ level. With the rise of ITIL, it is possible to put in place metrics that allow ITIL qualified people to implement standardized processes with standardized metrics. ISO20000 makes it clear that this works only if it is part of a coherent Management System.
2.3 Metrics and innovation
Metrics can only work if there is a process in place to be measured. Measuring how things happen without a process allows no consistent method of improvement, nor even a coherent way of discovering what prevented the metric occurring or how.
Analogy to driving a car
The supervisor instructs the driver to get the package to the customer by 17:00 this evening.
Much criticism of metrics comes from people who are opposed to processes rather than to metrics themselves. This is discussed more in section 10.3.1 on resistance. It is worth noting here that it is easy to agree to work according to a particular process and then carry on doing things just as before. Unless there are appropriate process metrics that will soon show that the process is not working.
Organizations that believe they have implemented processes but find that they appear to give little benefit may discover nothing has really changed when process metrics are established. For this reason, as well as the ones already mentioned, it makes sense to implement metrics at the same time as the processes are piloted, but this has often not been done!
There are a number of reasons for objecting to processes, and hence to metrics. One is simply that they are a change and most of us do not welcome change. Another is that they make a job boring as they force it to be done in a particular way each time. A further objection is that the measurement of process metrics exposes people to criticism and may endanger their jobs.
There is an element of truth to all the above objections, particularly if the reason for processes is not well communicated.
An analogy might help here. Riding a bicycle is a process. Once we learn how to do it, and those that have remember the wobbly start, the fear of falling off and the scraped knees that accompanied the learning, we no longer think about the detail. In fact, it has been pointed out that, if you think too carefully about what you are doing when riding a bicycle, you are likely to fall off! The important thing is that we then can concentrate on where we are going, what the view is like and the pleasure of being outdoors. If we never turn riding a bicycle into a well-known process, we will condemn ourselves to always finding it difficult, falling off and not enjoying the journey. We probably will not complete many journeys and certainly not many long ones.
So it is with IT Service Management or business processes. Once they are in place and working then it is possible to concentrate on the more interesting matters of introducing new things and fire fighting ceases to be a way of life. In an organization with good processes, people are free to innovate and give of their best in a calmer, more relaxed environment than in an organization that moves from crisis to crisis.
Yes, metrics do make problems visible and they have to be fixed. However, the object of the exercise is not to blame individuals, but to fix the process. It takes time for people to realize this, but it is vital for processes and their metrics to become accepted.
2.4 Costs
Measuring can cost a lot of money. One service management consultant was happy to save a company millions of pounds by closing down a department of over a hundred people who did nothing but produce reports. He found out all these reports were easier and cheaper to obtain from elsewhere in the organization.
One international organization sent out a monthly book of reports, called the ‘Blue Book’, because of its cover. One month, to test its importance, the management deliberately decided not to send out the report but wait for requests for it. Only one came. They were pleased to find that one person, out of the twenty who received the very expensive report, was interested in having it and asked why he wanted it. “My four year old daughter loves it because she can draw on the back of each page and it is very good paper”, was his reply.
Reports are only worthwhile if they are used and they will only be used if they tell us something interesting. Metrics must be designed to measure important matters and reported in a clear and simple manner. For most managers, a one-page summary on a web site will be perfectly suitable to their needs, as long as any potential problems are communicated clearly. Hiding bad news in the notes at the back of reports might work for publicly listed companies, but it is not a sensible approach for IT!
Metrics that report on costs are important and, in the IT Service Management scheme, the responsibility of Financial Management. The level, or maturity, of the organization will determine at what level of cost metrics are produced. It is important not to report costs inaccurately. Waiting until a proper costing model has been agreed with the business by the Financial Management function through the SLA process would be better.
2.5 Benefits
This chapter ought to have made most of the benefits clear. To summarize: • Metrics provide the instrumentation necessary to control an organization. • Metrics make it easier to concentrate on the important matters.
• Well-presented metrics make it easy to spot danger in time to correct it. • Metrics can improve morale in an organization.
3 Where to use metrics
IT Service Management software tools provide many possible metrics, most of which will be interesting to people in the relevant departments or running the relevant processes. If only these metrics are relied upon then the ‘tail wags the dog’. The organization knows what the designer of the software thought it should know, not what business IT alignment demands.
For this reason it is important to start at the other end, design the processes for your organization, then design the metrics to measure them. After this, it is possible to decide how to implement them in software.
Since metrics are designed to allow an organization to control its destiny, somebody must be responsible for them. If two people are responsible for the same metric, neither person is as the actions of one could prevent the other from achieving the desired result.
With process driven IT Service Management, whether you’re using ITIL, Six Sigma, COBIT or all three, it is important to distinguish between individuals, organizations or departments, and processes. For a metric to be a successful control, it must be the responsibility of somebody, an individual, who has the authority necessary to influence the outcome of the metric. There is no point, as King Canute showed, of giving somebody responsibility for the tides in the sea, unless that person also is able to influence them!
For each metric, it is necessary to establish who the responsible person will be. Will it be a departmental manager or will it be a designated process owner who might not have any direct reports.
3.1 Departments
In IT Service Management, the most obvious two departmental entities that every organization has are the Service Desk (formerly known as the Help Desk) and the ICT Infrastructure Management team (formerly known as Operations). These two departments will have department heads responsible for metrics measuring their departmental efficiency, and for the processes for which their departments are responsible.
The Service Desk is often responsible for the Incident Management process. The manager of this department will then be the process owner responsible for the metrics.
For example, consider an administrative department that provides reporting, of both ITIL process metrics and SLA compliance. It may have other duties as well, but metrics that test the accuracy and timeliness of production of these reports must be in place for the manager of this department. Such a department may also well have responsibility for the communication plan, an important plan that provides services to all other processes and must have its own measures of success.
3.2 Processes
Many processes don’t have their own department to run the process, but rather run across many departments and organizations to deliver the end-to-end service. The person responsible for these is the process owner who must have authority to ensure that the process metrics are met, even with only influence management authority.
A good example of this is the Change Manager who is responsible for the Change Management process. One of the most important requirements for the implementation of IT Service Management along ITIL quality lines is an effective corporate sponsor. Change Management is always going to involve influence management, as so many different parties are involved. The Change Manager is responsible for final approval of changes, under advice. This is not always going to be a popular decision and there are opportunities for political, rather than business, considerations to come into play. The corporate sponsor is needed to provide the required support to the influence management of the Change Manager. This is possible if there is evidence that the Change Manager is doing a good job. Without metrics to prove it, this can be a matter of opinion and political undermining of the Change Manager becomes easier. Well chosen metrics for the Change Management process can help identifying organizational areas that are not as cooperative as they could be. Working with them to iron out any process difficulties can be made considerably easier by a strong executive sponsor.