Chapter 1
Functions, Graphs, and Limits
MA1103 Business Mathematics I Semester I Year 2016/2017
SBM International Class
1.1 Functions
Function
A function is a rule that assigns to
each
object in a
set
A
exactly
one
object in a set
B
.
Which One is a Function?
fff
A
B
A
B
f
A
B
f
)
(
x
f
y
We represent a functional relationship by an equation
x
and
y
are called variables:
y
is the
dependent variable
and
x
is the
independent variable
.
Example.
Note that
x
and
y
can be substituted by other letters.
For example, the above function can be represented by
4
)
(
2
f
x
x
y
4
2
Function which is Described as a Tabular Data
Academic Year Tuition and
Ending in Period
n
Fees
1973 1 $1,898
1978 2 $2,700
1983 3 $4,639
1988 4 $7,048
1993 5 $10,448
1998 6 $13,785
2003 7 $18,273
6
We can describe this data as a function
f
defined by
the rule
Thus,
Noted that the domain of
f
is the set of integers
Piecewise-defined function
8
A
piecewise-defined function
is a function that is
often defined using more than one formula, where
each individual formula describes the function on a
subset of the domain.
Natural Domain
The
natural domain
of
f
is the domain of
f
to be the set
of all real numbers for which
f(x)
is defined.
Examples.
Find the domain and range of each of these functions.
1.
2.
There are two situations often need to be considered:
1) division by 0
2) the even root of a negative number
2
1
1
)
(
x
x
f
4
2
)
Functions Used in Economics
A
d
emand function
p=D(x)
is a function that relates the unit
price
p
for a particular commodity to the number of units
x
demanded by consumers at that price.
The
total revenue
is given by the product
R(x)=(number of items sold)(price per item)
=xp=xD(x)
If
C(x)
is the
total cost
of producing the
x
units, then the
profit
is given by the function
P(x)=R(x)-C(x)=xD(x)-C(x)
Example
Market research indicates that consumers will buy
x
thousand units of a particular kind of coffee maker when
the unit price is dollars. The cost of
producing the
x
thousand units is
51
27
.
0
x
p
85
5
.
3
23
.
2
)
(
x
x
2
x
C
thousand dollars
a. What are the revenue and profit functions,
R(x)
and
P(x),
for this production process?
12
a. The demand function is , so the revenue is
thousand dollars, and the profit is (thousand dollars)
51
b. Production is profitable when
P(x)>0
. We find that
0
Composition of Functions
Given functions
f(u)
and
g(x),
the
composition
f(g(x))
is the
function of
x
formed by substituting
u=g(x)
for
u
in the formula
for
f(u).
1 )
(x x g
1
)
(
u
u
3
f
2
3
3
1
)
1
(
))
(
(
g
x
x
3
x
3
x
2
x
f
Example.
Find the composition function
f(g(x)),
where and
Solution.
Replace
u
by
x+1
in the formula for
f(u)
to get
Question: How about
g(f(x))
?
1.2 The Graph of a Function
Graph
The
graph of a function
f
consists of all points
(x,y)
where
x
is in the domain of
f
and
y=f(x),
that is, all points of the
form
(x,f(x)).
Rectangular coordinate system, horizontal axis, vertical
axis.
2
)
(
x
x
2
x
f
x -3 -2 -1 0 1 2 3 4
Intercepts
x
intercept:
points where a graph crosses the
x
axis.
y
intercept:
a point where the graph crosses the
y
axis.
How to find the
x
and
y
intercepts:
The only possible
y
intercept for a function is ,
to find any
x
intercept of
y=f(x),
set
y=0
and solve for
x.
Note: Sometimes finding
x
intercepts may be difficult.
Following aforementioned example, the
y
intercept is
f(0)=2
.
To find the
x
intercepts, solve the equation
f(x)=0
, we have
x=-1
and
2
. Thus, the
x
intercepts are
(-1,0)
and
(2,0).
)
0
(
0
f
y
Parabolas
Parabolas:
The graph of as long as
A
≠0.
All parabolas have a “U shape” and the parabola opens up
if
A>0
and down if
A<0
.
The “peak” or “valley” of the parabola is called its
vertex
,
and it always occurs where
C Bx
Ax
y 2
A B x
18
Example 6
A manufacturer determines that when x hundred units of a particular
commodity are produced, they can all be sold for a unit price given by
the demand function
p=60-x
dollars. At what level of production is
revenue maximized? What is the maximum revenue?
Solution:
The revenue function
R(x)=x(60-x)
hundred dollars. Note that
R(x) ≥0
only for
0
≤x≤60
.The revenue function can be rewritten as
x
x
x
R
(
)
2
60
which is a parabola that opens downward (Since
A=-1<0
) and has its
high point (vertex) at
30) 1 (
2
60
2
A B x
Thus, revenue is maximized when
x=30
hundred units are produced,
and the corresponding maximum revenue is
R(30)=900
hundred
Intersections of Graphs
Sometimes it is necessary to determine when two
functions are equal.
For example, an
economist may
wish to compute
the market price at
which the
Power, Polynomial, and Rational Functions
A power function: A function of the form , where n is a real number.
A polynomial function: A function of the form
The Vertical Line Test
1.3 Linear Functions
Linear Functions
b
mx
y
A linear function
is a function that changes at a
constant rate with respect to its independent
variable.
The graph of a linear function is a straight line.
The equation of a linear function can be written in the
form
The Slope of a Line
The slope of the non-vertical line passing through the points
and is given by the formula
)
,
(
x
1y
11 2
1 2
in x
change
y
in
change
Slope
x
x
y
y
x
y
24
)
,
Equation of a Line
The slope-intercept form:
The equation is the
equation of a line whose slope is
m
and whose
y
intercept is
(0,b).
The slope-intercept form is
3
26
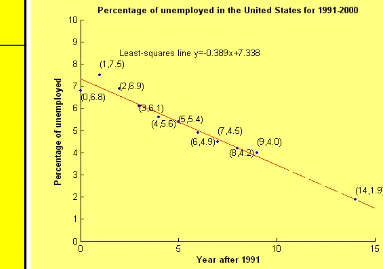
Table 1.2 lists the percentage of the labour force that was unemployed
during the decade
1991-2000
. Plot a graph with the time (years after
1991) on the
x
axis and percentage of unemployment on the
y
axis. Do
the points follow a clear pattern? Based on these data, what would
you expect the percentage of unemployment to be in the year
2005
?
Number of Years Percentage of Year from 1991 Unemployed
1991 0 6.8 1992 1 7.5 1993 2 6.9 1994 3 6.1 1995 4 5.6 1996 5 5.4 1997 6 4.9 1998 7 4.5 1999 8 4.2 2000 9 4.0
Parallel and Perpendicular Lines
Let and be the slope of the
non-vertical lines
and . Then
and are
parallel
if and only if
and
are
perpendicular
if and only if
1
m
2
L
2
m
1
L
1
L
L
2 m1 m21
L
L
21 2
1
m
28
By rewriting the equation
4x+3y=3
in the slope-intercept form
, we see that
L
has slope
a. Any line parallel to
L
must also have slope
-4/3
. The required line
Functional Models
To analyze a real world problem, a common procedure is to
make assumptions about the problem that simplify it enough
to allow a mathematical description. This process is called
mathematical modelling
and the modified problem based on
the simplifying assumptions is called
a mathematical model
.
30
Real-world problem
Testing
Interpretation
Mathematical model
adjustments
Prediction Analysis
Elimination of Variables
In next example, the quantity you are seeking is expressed
most naturally in term of two variables. We will have to
eliminate one of these variables before you can write the
quantity as a function of a single variable.
Example
32
Solution:
We denote
x
and
y
as the lengths of the sides of the picnic area.
Expressing the number of yards
F
of required fencing in terms of
these two variables, we get . Using the fact that the area
is to be
5,000
square yards that is
y
x
F
2
x y
xy 5,000 5000
and substitute the resulting expression for
y
into the formula for
F
to
get
x x
x x
x
F( ) 2 5000 10000
Modelling in Business and Economics
A manufacturer can produce blank videotapes at a
cost of
$2
per
cassette
. The cassettes have been selling for $5
a piece
.
Consumers have been buying 4000
cassettes a month
. The
manufacturer is planning to raise the price of the cassettes and
estimates that for
each
$1
increase in the price,
400
fewer
cassettes will be sold each month
.
a. Express the manufacturer’s monthly profit as a function of the
price at which the cassettes are sold.
b. Sketch the graph of the profit function. What price
34
Solution:
a. As we know,
Profit=(number of cassettes sold)(profit per
cassette)
Let
p
denote the price at which each cassette will be sold
and let
P(p)
be the corresponding monthly profit.
Number of cassettes sold
=
4000-400(number of $1 increases)
=
4000-400(p-5)=6000-400p
Profit per cassette=p-2
The total profit is
12000
6800
400
)
2
)(
400
6000
(
)
(
2
p
p
p
p
p
b. The graph of
P(p)
is the downward opening parabola
shown in the bottom figure. Profit is maximized at the
value of
p
that corresponds to the vertex of the parabola.
We know
Thus, profit is maximized when the manufacturer charges
Market Equilibrium
)
(
)
(
e ee
D
x
S
x
p
The law of supply and demand
: In a competitive market
environment, supply tends to equal demand, and when
this occurs, the market is said to be in equilibrium.
The demand function
:
p=D(x)
The supply function
:
p=S(x)
The equilibrium price
:
Shortage:
D(x)>S(x)
Market research indicates that manufacturers will supply
x
units of a particular commodity to the marketplace when the
price is
p=S(x)
dollars per unit and that the same number of
units will be demanded by consumers when the price is
p=D(x)
dollars per unit, where the supply and demand
functions are given by
x
x
D
x
x
S
(
)
2
14
(
)
174
6
a. At what level of production
x
and unit price
p
is market
equilibrium achieved?
b. Sketch the supply and demand curves,
p=S(x)
and
38
Solution:
a. Market equilibrium occurs when
S(x)=D(x)
, we have
16 or
10
0 )
16 )(
10 (
6 174
14
2
x x
x
x x
Break-Even Analysis
At low levels of production, the manufacturer suffers a
loss. At higher levels of production, however, the total
revenue curve is the higher one and the manufacturer
realizes a profit.
40
A manufacturer can sell a certain product for
$110
per unit.
Total cost consists of a fixed overhead of
$7500
plus
production costs of
$60
per unit.
a. How many units must the manufacturer sell to break even?
b.
What is the manufacturer’s profit or loss if
100
units are
sold?
c.How many units must be sold for the manufacturer to
realize a profit of
$1250
?
Solution:
If
x
is the number of units manufactured and sold, the total
revenue is given by
R(x)=110x
and the total cost by
a. To find the break-even point, set
R(x)
equal to
C(x)
and solve
110x=7500+60x
, so that
x=150
.
It follows that the manufacturer will have to sell
150
units to break
even.
b. The profit
P(x)
is revenue minus cost. Hence,
P(x)=R(x)-C(x)=110x-(7500+60x)=50x-7500
The profit from the sale of
100
units is
P(100)=-2500
It follows that the manufacturer will lose
$2500
if
100
units are
sold.
c. We set the formula for profit
P(x)
equal to
1250
and solve for
x,
42
A certain car rental agency charges
$25
plus
60
cents per
mile. A second agency charge
$30
plus
50
cents per mile.
Which agency offers the better deal?
Solution:
Suppose a car is to be driven
x
miles, then the first agency
will charge dollars and the second will charge
. So that
x=50
.
For shorter distances, the first agency offers the better deal,
and for longer distances, the second agency is better.
x x
C1( ) 25 0.60
x
x
Illustration of Limit
T
he limit process
involves examining the behaviour of a
function
f(x)
as
x
approaches a number
c
that may or may not
be in the domain of
f
.
Illustration.
Consider a manager who determines that when
x
percent of
her company’s plant capacity is being used, the total cost is
hundred thousand dollars. The company has a policy of
rotating maintenance in such a way that no more than
80%
of
capacity is ever in use at any one time. What cost should the
manager expect when the plant is operating at full
permissible capacity?
44960 68
320 636
8 )
( 2
2
x x
x x
It may seem that we can answer this question by simply evaluating C(80), but attempting this evaluation results in the meaningless fraction 0/0.
However, it is still possible to evaluate C(x) for values of
x that approach 80 from the left (x<80) and the right (x>80), as indicated in this table:
x approaches 80from the left→ ←x approaches 80 from the right
x 79.8 79.99 79.999 80 80.0001 80.001 80.04
C(x) 6.99782 6.99989 6.99999 7.000001 7.00001 7.00043
The values of C(x) displayed on the lower line of this table suggest that C(x) approaches the number 7 as x gets closer and closer to 80. The functional behavior in this example can be describe by lim ( ) 7
80
C x
Limits
If f(x) gets closer and closer to a number L as x gets closer and closer to
c from both sides, then L is the limit of f(x) as x approaches c. The behaviour is expressed by writing
46
L x
f
c
x ( )
Example
Use a table to estimate the limit
1
x 0.99 0.999 0.9999 1 1.00001 1.0001 1.001
f(x) 0.50126 0.50013 0.50001 0.499999 0.49999 0.49988
The table suggest that f(x) approaches 0.5 as x approaches
48
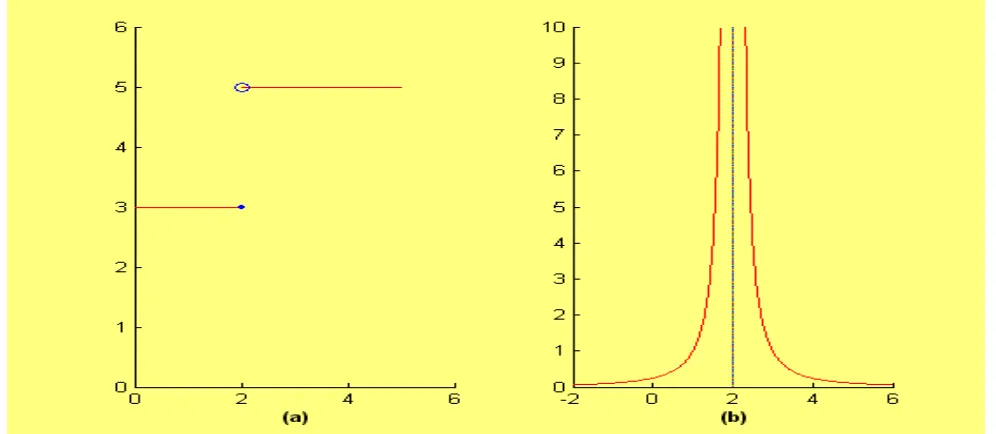
Three functions for which
It is important to remember that limits describe the behavior of a function near a particular point, not
necessarily at the point itself.
4 ) ( lim
3
f x
The figure below shows that the graph of two functions that do not have a limit as x approaches 2.
Figure (a): The limit does not exist;
Figure (b): The function has no finite limit as x
Properties of Limits
For any constant k,
That is, the limit of a constant is the constant itself, and the limit of f(x)=x as x approaches c is c.
c x k
k
c
x and limxc
Examples
a. Apply the properties of limits to obtain
Limits of Polynomials and Rational Functions
Indeterminate Form
54
If and , then is said to be
Limits Involving Infinity
Limits at Infinity
If the value of the function f(x) approach the number L as x increases without bound, we write
Similarly, we write
when the functional values f(x) approach the number M as x decreases without bound.
L x
f
xlim ( )
M x
f
56 Reciprocal Power Rules
Procedure for Evaluating a Limit at Infinity of f(x)=p(x)/q(x) Step 1. Divide each term in f(x) by the highest power xk that
appears in the denominator polynomial q(x).
Step 2. Compute or using algebraic properties of limits and the reciprocal rules.
) ( lim f x
x xlim f (x)
Example.
1 5
2 8
3
lim 4
2 4
x
x x
58 Infinite Limits
If f(x) increases or decreases without bound as x→c, we have lim f (x) or lim f (x)
c x c
x
Example. 2
2 ( 2)
lim
x
x
x
From the figure, we can guest that
2 ( 2)2
lim
x x
One-Sided Limits
If
f(x)
approaches
L
as
x
tends toward
c
from the left
(x<c)
, we write
L
x
f
c
x
lim
(
)
M
x
f
c
x
)
(
lim
60
where
L
is called the
limit from the left
(or
left-hand
limit
)
Likewise if
f(x)
approaches
M
as
x
tends toward
c
from the right
(x>c),
then
Example.
For the function
62
Existence of a Limit
The two-sided limit exists if and only if the two
one-sided limits and exist and are
equal, and then
At x=1:
1
lim 0
x f x
1
lim 1
x f x
1 1f
Left-hand limit
Right-hand limit
value of the function
does not exist!
Since the left and right hand limits are not equal.
) ( lim
1 f x
64
At x=2: Left-hand limit
Right-hand limit
value of the function
2
lim 1
x f x
2
lim 1
x f x
2 2f
does exist!
Since the left and right hand limits are equal. However, the limit is not equal to the value of
function.
) ( lim
2 f x
At x=3: Left-hand limit
Right-hand limit
value of the function
3
lim 2
x f x
3
lim 2
x f x
3 2f
does exist!
Since the left and right hand limits are equal, and the limit is equal to the value of
function.
) ( lim
3 f x
66
Non-existent One-sided Limits
A simple example is provided by the function
)
/
1
sin(
)
(
x
x
f
As x approaches 0 from either the left or the right, f(x)
Continuity
A continuous function is one whose graph can be drawn
68
70
What properties will guarantee that f(x) does not have a “hole”
or “gap” at x=c?
A function f is continuous at c if all three of these conditions are satisfied:
a.
b.
c.
If f(x) is not continuous at c, it is said to have a discontinuity
there.
exists
) ( lim f x
c x
) ( )
(
lim f x f c
c
x
defined
f(x) is continuous at
72
Continuity of Polynomials and
Rational Functions
If p(x) and q(x) are polynomials, then
)
Example.
Show that the rational function is
continuous at
x=3.
21
Note that
f(3)=(3+1)/(3-2)=4,
74
Example.
Determine where the function below is not continuous.
Rational functions are continuous everywhere except
where we have division by zero.
The function given will not be continuous at
t=-3
Example.
Discuss the continuity of each of the following functions
76
Example.
For what value of the constant A is the following function continuous for all real x?
f(x) will be continuous everywhere except possibly at x=1 . According to the three criteria for continuity, we have
Example.
Find numbers a and b so that the following function is continuous everywhere.
78
Continuity on an Interval
A function f(x) is said to be continuous on an open interval a<x<b if it is continuous at each point x=c in that interval.
f is continuous on closed interval a≤x≤b, if it continuous on
the open interval a<x<b, and
is continuous on [-1,1] ) ( )
(
lim f x f a
a
x
) ( )
(
lim f x f b
b
x
2 1
)
(x x
Example.
Discuss the continuity of the function on the open interval -2<x<3 and on the closed interval -2≤x≤33
2 )
(
x x x f
80
Summary
Function:
Domain and range of a function Composition of function f(g(x))
Graph of a function:
x and y intercepts,
Piecewise-defined function, power function Polynomial, rational function, vertical line test
Linear function:
Function Models:
Market equilibrium: law of supply and demand Shortage and surplus, break-even analysis
Limits:
Calculation of limits, limits of polynomial and rational function
Limits at infinity: limits at the infinity (Reciprocal power Rules), infinite limit
One sided limit, existence of limit
Continuity of f(x) at x=c:
Continuity of polynomials and rational function
L x f
c x
) (