Evaluation of Satellite...(Santosa)
Available online at http://Journals.ums.ac.id/index.php/fg/article/view/1768
Evaluation of Satellite Image Correction Methods Caused by
Differential Terrain Illumination
Purnama Budi Santosa
Department of Geodetic Engineering Faculty of Engineering, Gadjah Mada University Corresponding author (email: [email protected])
Abstract
The problem due to differential terrain illumination on satellite imagery is experienced by most of areas which are on mountainous terrain. This may cause variations in reflectance of similar ground features which lead to a misclassification of land cover classes due to different topographic positions. This phenomenon most commonly occurred in the areas which are located on southern and northern hemisphere because of the low sun inclination. This problem has been a major interest for researchers to be solved prior to the land cover classification process. For satellite images which experience this kind of problem, topographic correction need to be applied in order to reduce the illumination effects prior to land cover classification process. This research is aimed at conducting topographic correction of multi spectral SPOT 5 satellite data as well as evaluating the three topographic correction methods. They are Cosine which is based on Lambertian reflectance assumption, as well as Minnaert correction and C correction methods which are based on non-Lambertian reflectance assumption. The data used in this study are two scenes of SPOT 5 images of forested mountainous area of Miyazaki Prefecture, Kyushu, Japan.Research steps had been conducted in this study including geometric correction, sample data collection for calculating Minnaert constants and C constants at location which represents the whole study area, topographic correction for two scenes SPOT 5 images, and results analysis. The results show that Cosine method did not show good performance for the study area which is topographically dominated by rugged terrain. Whereas Minnaert method and C method gave satisfactory results as is indicated by the statistical data as well as visual interpretation. However the Minnaert correction method showed slightly better performance than the C correction method.
Keywords: Minnaert, Cosine, C-Correction, topographic normalization, SPOT, image processing. Abstrak
Permasalahan yang disebabkan oleh pencahayaan medan permukaan yang berbeda pada citra satelit dialami oleh sebagian besar dari daerah-daerah pada daerah pegunungan. Hal ini dapat menyebabkan variasi dalam pemantulan kenampakan permukaan tanah yang sama yang menyebabkan kesalahan
klasifikasi kelas tutupan lahan karena posisi topografi yang berbeda. Fenomena ini paling sering terjadi
pada wilayah yang terletak di belahan bumi selatan dan utara karena kemiringan matahari yang rendah.
Masalah ini telah menjadi perhatian para peneliti untuk dipecahkan sebelum proses klasifikasi tutupan lahan. Oleh karena itu, untuk citra satelit yang mengalami masalah seperti ini, koreksi topografi perlu diterapkan untuk mengurangi efek pencahayaan sebelum proses klasifikasi tutupan lahan. Penelitian ini bertujuan untuk melakukan koreksi topografi citra satelit multi speltral SPOT 5 serta mengevaluasi tiga metode koreksi topografi. Metode tersebut adalah Cosine yang didasarkan pada asumsi pemantulan Lambertian, serta koreksi Minnaert dan koreksi C yang didasarkan pada asumsi pemantulan non-Lambertian. Data yang digunakan dalam penelitian ini adalah dua citra satelit SPOT 5 yang meliputi
daerah pegunungan berhutan Prefektur Miyazaki, Kyushu, Jepang. Langkah penelitian telah dilakukan dalam penelitian ini meliputi koreksi geometrik, pengumpulan data sampel untuk menghitung konstanta
Minnaert dan konstanta C di lokasi yang mewakili keseluruhan daerah penelitian, koreksi topografi untuk dua citra satelit SPOT 5, dan analisis hasil. Hasil penelitian menunjukkan bahwa metode Cosine tidak menunjukkan kinerja yang baik untuk daerah penelitian yang topografinya didominasi oleh medan permukaan bergelombang. Sedangkan metode Minnaert dan metode C memberikan hasil yang memuaskan seperti yang ditunjukkan oleh data statistik serta interpretasi visual. Namun metode koreksi Minnaert menunjukkan kinerja sedikit lebih baik daripada metode koreksi C.
Introduction
For the purpose of monitoring landuse dynamic of the study area from 2004 to 2006
in the Miyazaki Prefecture Japan, detailed
information about land cover classes is needed. However, the available data namely multi spectral SPOT 5 satellite data which were
acquisitioned in 2004 and 2006 are influenced
by topographically induced illumination effects which result in the existence of shadowed areas on the slope that is facing away from the sun. These effects may cause variations in
reflectance of similar ground features, leading to a possible misclassification into different
land cover classes due to different topographic positions. In order to be able to conduct land
cover classification, topographic correction
needs to be applied to remove or minimize this error.
For areas which are on flat or gently undulating
terrain, where topographically induce
illumination effects do not exist significantly, land cover classification from satellite imagery
has become a routine practice. However, when the satellite dataset covers areas which are in
mountainous terrains, spectral classification
is still remain a challenge (Leprieur et al.
1988). For these areas, the classification
results often misleading, especially when the topographically induced illumination effects exist. For this case, researchers have attempted to develop methods and techniques to improve the situation, and several strategies have been
pursued. The improvements in classification
methods and techniques can involve
classification algorithm refinement, the use
of textural or contextual information derived from the image itself, or the incorporation of ancillary information sources, such as existing maps.
For the case of satellite imageries which experience topographically induced illumination effects, one measure that can be
done to improve the land cover classification
results is by conducting topographic correction. Several topographic correction methods have been developed and their functionalities have
been tested for different satellite imageries on different terrain and land cover conditions (e.g. Twele and Erasmi 2005, McDonald et al.
2002, Meyer et al. 1993, Riano et al, 2003).
Twele and Erasmi (2003) tried to evaluate topographic correction algorithms to improve land cover discrimination in tropical forest of mountainous areas based on a Landsat ETM+. The study ended up with the conclusion that the simplistic assumption of Lambertian surface properties was not appropriate for the terrain correction of tropical forest. In contrast, non-Lambertian methods showed good performance in eliminating topographically induced illumination effects. McDonald et al. (2002) evaluated a number of topographic correction algorithms published by Teillet et al. (1982) and Meyer et al. (1993) for Landsat TM data. As part of the land management purposes, this research was aimed at eliminating the shadowing effects exists in the images due to topographic condition coupled with a low sun angle at the time of satellite overpass
which the final goal was to improve image classification results. The result came to the
suggestion that the most effective illumination correction was C-correction. While the Minnaert correction gave similar results to
those of the C-correction, the coefficients for
the C-correction were easier to obtain from the
data, making its application simpler.
Similar to the previous researches, Wu et al. (2007) compared different topographic correction algorithms to understand their
performance on QuickBird images for undulant
area with maximum slope of 7.4 degrees. Among these corrections, the empirical correction proved to be the most effective method for all spectral bands in both the solar and view directions. The cosine correction gave the worst performance, whereas the C correction and the Minnaert correction performed well for highly non-Lambertian surfaces, but they were less effective than the empirical correction.
The inclusion of constant or coefficient in
several researchers. Murakami (2007) studied
the derivation of Minnaert constants based on three different forest types. He suggested that
there were no significant differences between
the derived constants which were calculated from the data extracted from the three forest types with similar topographic conditions. In addition, Minnaert constants derived only from topographic conditions without
forest-type specification also presented no significant difference in all bands and all scenes. While not directly confirming that Minnaert constants were similar regardless of forest type, the results suggested that a stable Minnaert constant could be obtained
by taking only topographic conditions into consideration. These results contradict with
the study conducted by Blesius and Weirich
(2005). In this research, they employed Minnaert correction method to improve land
cover classification in mountainous terrain.
One of the study results suggested that Minnaert constant should be derived from individual land cover classes.
This study investigates three topographic correction methods namely Cosine method
which is based on the Lambertian reflectance
assumptions, as well as Minnaert and C method for the non-Lambertian assumption which are proposed by previous researchers as effective
and efficient topographic correction method.
This is done to compare the results of the three methods on the satellite images which are severely affected by the topographic-induced illumination effects.
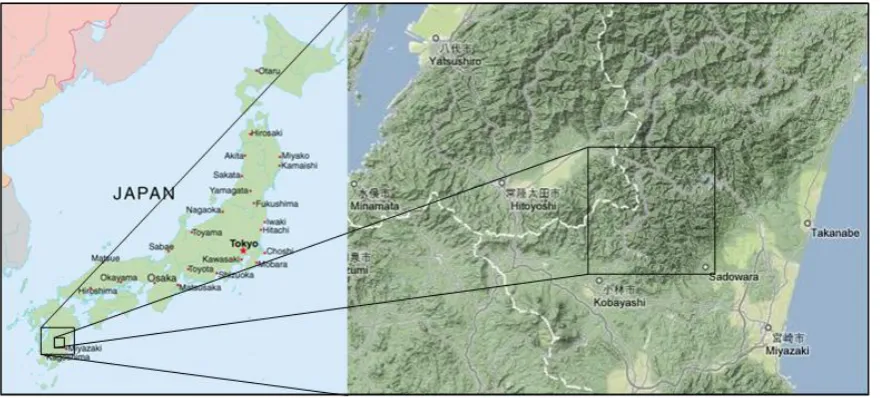
Study Area And Data
The study area is in a mountainous forested
terrain of the Hitotsuse area in Miyazaki Prefecture, Kyushu, Japan (Figure 1), bounded
within Latitude: 13102`40” E - 131017`31” E,
and Longitude: 320 10` 48” N - 32024`590” N.
The topographic condition is very undulating
with maximum slope of about 79.5 degrees, and the elevations ranging from 196 to 1723 m above sea level. The natural vegetation is warm-temperate evergreen broadleaf forest and secondary natural broadleaf forest presently dominates the area. Other land cover includes coniferous plantation forests composed mainly of Japanese cedar and bamboo forests.
Two SPOT 5/HRG images were used in this study. The first SPOT satellite data, which is
called H18. It was observed in February 3, 2006 at 11:11 am with sun altitude of 37.6175 degrees and sun azimuth 156.4167degrees. The second satellite data, which is called H16, was observed in October 13, 2004 at 11:07:58 am with sun altitude of 47.9316 degrees and sun azimuth of 160.1751 degrees. The images have four bands: band 1 (visible green, 0.50-0.59 µm), band 2 (visible red, 0.61-0.68 µ m), band 3 (near-infrared, 0.78-0.89 µm),
and band 4 (SWIR, 1.58-1.75 µm). The spatial resolution of band 1 to band 3 is 10 m, and band 4 is 20 m.
A 10-m grid digital map created by Hokkaido
Map Corporation was used for the digital elevation model (DEM). This DEM was produced based on digital 10 m contour map at scale 1:25000 published by the Geographical Survey Institute of Japan. This DEM was applied for the geometric registration of satellite data and for the calculation of the solar incidence angle and sensor existence angle in each pixel. The 1:25000 digital map was also used for geometric registration of the
SPOT imageries. ERDAS IMAGINE Version
9.1 software (Leica Geosystems Geospatial Imaging, Norcross, GA, USA) was used for preprocessing the satellite data. All data
were geometrically registered on a Tokyo
Transverse Mercator projection with datum
Figure 1. Study location at Hitotsuse area, Miyazaki prefecture, Kyushu, Japan
Methodology
Data Sampling Method
The empirical constants which were employed in all non-Lambertian methods i.e. Minnaert and C method were derived from the sampling areas which were chosen by criteria. The criteria for the sampling area was that the sampling area should represents the whole study areas in terms of topographic condition and vegetation coverage. Therefore, the selection process of the sampling areas could not be done by random sampling. They should be selected based on the terrain condition that may include: vegetation coverage, rough topographic condition and the existence of shadowed and sunny slopes. Over 10000 pixel samples from homogeneous, rugged areas with a broad range of different slope angles
and solar aspects were taken.
Once the sampling areas had been selected, these areas would be used for deriving Minnaert constants and C constants necessary for conducting topographic correction. For the subsequent evaluation of the performance of each correction method, random pixel samplings were chosen including more than 12000 pixel samples in regression analysis. This type of sampling mainly contains pixels of natural forested areas, as well as other types of land cover that contribute to the statistics.
Topographic Correction
In order to be able to see the topographic effect, the relationship between cosine angle, solar incidence angle and the local surface normal which is modeled in Eq. (1) can be used to achieve this purpose (Civco 1989).
) cos(
sin sin cos
cos
cosi= θ0 θn+ θ0 θn φn−φ0 (1) cosi is the cosine angle between solar incident angle and the local surface normal; θ0is the solar zenith angle; θnis the zenith angle of the normal to the surface; φ0is the solar azimuth angle; and φn is the topographic aspect angle. This relationship can be used to reduce the variance within land-cover classes (Civco
1989). Furthermore, the reflectance property of
the surface material is necessarily considered.
This is specified by the Bi-directional Reflectance Distribution Function (BRDF), a function defined in terms of incident and
exitance angles. According to Woodham and
Gray (1987) the BRDF can be analytically
inferred, but it cannot be measured. For a
Lambertian surface the BRDF is independent
of incident angles, or in other words, radiation
is reflected in all directions without preference.
The Lambertian assumption is formulated as (Woodham and Gray (1987):
i L Ln
cos =
where Lnis normalized radiance and L is measured radiance.
Cosine correction: In this method, the surface is assumed to have Lambertian behaviour, i.e.
to be a perfect diffuse reflector, having the same amount of reflectance in all view directions.
Thus, the Lambertian correction function attempts to correct only for differences in illumination caused by the orientation of the surface (Jones et al., 1988). For the Lambertian assumption, the most widely used correction is Cosine method using the equation LH is radiance for horizontal surface; LT is radiance observed over the inclined terrain; and i represents incidence angle with respect to surface normal.
Although this correction method is simple and convenient for topographic correction, there is a recognized problem in the corrected images. Thus when correcting the topographic effect under a Lambertian surface assumption, images tended to be over-corrected, with slopes facing away from the sun appearing brighter than sun-facing slopes due to diffuse
sunlight being relatively more influential on
the shady slope (Jones et al., 1988). Therefore, non-Lambertian topographic correction method has been developed.
C correction: This correction method is based on non-Lambertian assumptions which is to
weaken the effect of over-correction in cosine
correction when i(x, y) approaches 90°. For this purpose, a constant parameter (cλ) was proposed (Teillet et al., 1982), thus the Eq. (4) becomes (5). of the regression between LT(x,y) and cos(i). As Teillet et al. (1982) stated, Eq. (5) could be considered to emulate the effect of diffuse irradiance although the physical analogies are not exact.
Minnaert correction: In a non-Lambertian model, corrections are applied with respect to sun and sensor geometries, and equation (2) becomes:
original data value, i is the solar incidence angle, e is the sensor exitance angle, and k is the Minnaert constant. This is reduced to equation (2) if k=1, which is the Lambertian assumption. If the sensor is viewing at nadir, the exitance angle is equal to the slope angle. To utilize this relationship, equation (7) needs to be linearized (Jones et al., 1988).
The Minnaert constant k then represents the slope of the regression line if log(Lcos e) is plotted against log(cos i cos e), lies between 0 and 1. It is used to describe the roughness of the surface. When the surface has Lambertian behaviour, the value of the Minnaert constant is 1. Otherwise, it is less than 1. After the Minnaert constant, k, is determined, a
backwards radiance correction transformation
model can be developed (Jones et al., 1988).
) If we compare this method with the non-Lambertian cosine method mathematically, it can be seen that the Minnaert constant, k,
correction. In other words, it is used to describe the roughness of the surface of the terrain. As a result, the problem of overcorrection in the area facing away from the sun can be solved.
Results and Discussion
Statistical Analysis
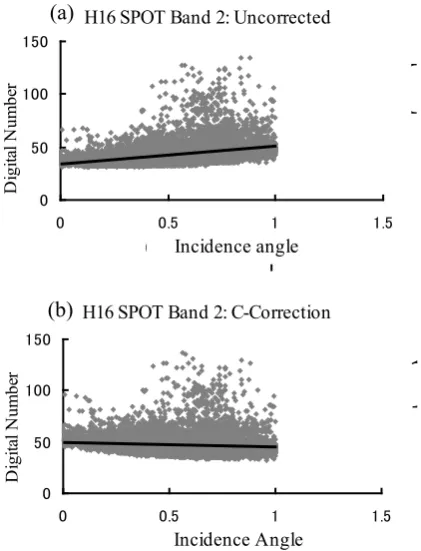
In order to be able to understand the impacts of the correction process towards the original data, statistical data was used to test the accuracy of the correction results. For this purpose, a training area which represents the terrain variations (i.e. covers the sunny and shady slopes of the images) was chosen. Linear regression method was used to compare the results of the pre-corrected and post-corrected data and for each subsequent illumination corrections. Figure 2 shows an example of
the relationship between H16 SPOT Band
2 digital number (DN) and incidence angle for both uncorrected and corrected data at a training area.
Figure 2 (a) shows the behavior of the digital
number of H16 SPOT Band 2 towards the
incidence angle. It shows positive linear relationship between the DN and the incidence angle. The linear regression equation parameter is shown in Table 1. The equation gives m slope of 16.843 and b intercept of 34.074 with
coefficient of determination of 0.192. Figure 2
(b) shows the effect of applying a C-Correction on the same dataset. The relationship between DN and the incidence angle is reduced from the dataset. As can be seen from Table 1, the equation for the trend line gives a m slope of -3.482 and b intercept of 50.115 with
coefficient of determination of 0.049. As the
purpose of applying an illumination correction is to reduce the effect of the incidence angle on the image digital number, Figure 2 (b) shows the success of the C-Correction as is indicated
by the decreasing value of coefficient of determinant from 0.192 to 0.049.
H16 SPOT Band 2: Uncorrected
150
H16 SPOT Band 2: Uncorrected
0
H16 SPOT Band 2: C-Correction
150
H16 SPOT Band 2: C-Correction
0
Figure 2. Linear regression of illumination versus
band 2 for uncorrected data (a), and C-corrected
data (b)
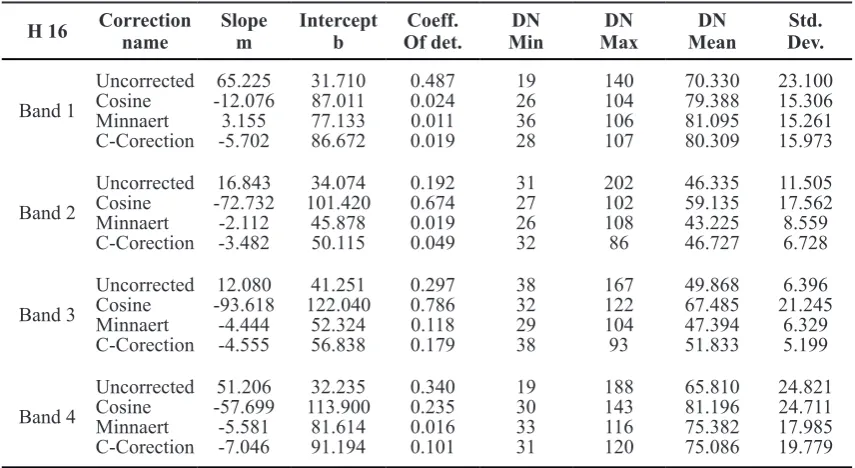
Table 1. Summary of statistical data of the uncorrected and corrected H16 data. determination values in table 1, it can be seen that Minnaert method gives the best results as is indicated by the lowest values of those parameters for all bands, regardless the fact that the standard deviation values for band 2 and 3 are not the lowest. In contrary, the Cosine method gives the worst results due to over-correction as is indicated by large increase of slope for band 2, 3 and 4 from 16.843, 12.080 and 51.206 to -72.732, -93.618 and -57.699 respectively.
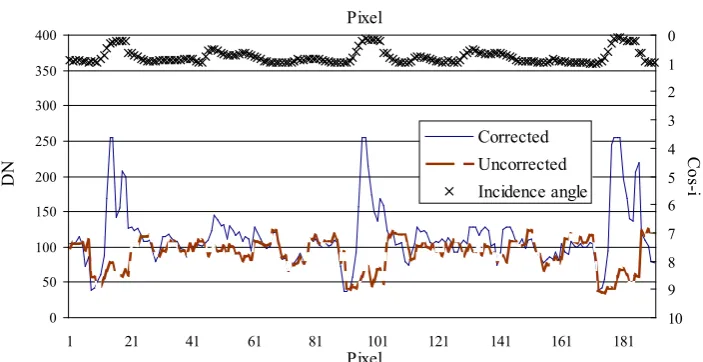
Figure 3 shows the relationship between pre-corrected image, post-pre-corrected image and
illumination. The figure reveals the effect of
too large Minnaert constants towards the H16
image Band 1 under existing illumination
intensity. When the illumination (Cos-i) decreases, the DN of the pre-corrected dataset at the respective areas also decreases. The effect of inappropriate Minnaert correction (which is supplied by too large Minnaert constants)
can be seen from the dramatic increase of the pixel DN at the respective locations. At those locations, the uncorrected dataset with pixel DN at around 50 to 90 change dramatically after correction as can be seen from its dramatic increasing values at maximum of 256. This phenomenon indicates the existence or over-correction. This happens in areas where the incidence angle approaches 90 degrees (that is, where cosi tends towards zero) the fraction becomes very large and when multiplied by the pixel DN it creates a disproportionate brightening effect. The suitable Minnaert constant for Minnaert correction as well as C constant for C correction should be able to eliminate these dramatic changes of the pixel DN at low illumination intensity. However
these suitable constants often difficult to find.
0
Figure 3. The behavior of H16 image Band 1 towards illumination for Minnaert correction.
Visual Analysis
Another effective way of evaluating the correction results is by investigating
the corrected images visually. By visual
interpretation, the effect of the correction can
be clearly seen. One key visual interpretation
to see the effectiveness of the correction is by comparing individual band between uncorrected and corrected images. An indication of the success of the correction is when the resulting band shows the similar grey level between the shadowed areas and
the sunny areas. Figure 4 (a) and figure 4 (b)
show visual interpretation of the uncorrected
and Minnaert corrected Band 2 of H16. The
shadowed areas in the uncorrected image
(figure 4 (a)) which is represented by dark color, looks brighter in the Minnaert corrected image (figure 4 (b)), result in similar grey
level between the shadowed and sunny areas. A comparison between the original band 2 and the Minnaert corrected band 2 shows a reduction of the relief effects. This leads to a lost of the three-dimensional impression of the corrected image caused by the illumination. As can be seen from the table 1, the Minnaert correction caused the decreases of linear regression slope m and coefficient of determination of uncorrected band from
16.843 and 0.192 to -2.112 and 0.019 in corrected band respectively. The corrected
image looks flatter than the uncorrected one
and more or less homogeneous in regions of identical objects. The appearance of forests, for instance, becomes much more independent from topography than in the original (uncorrected) bands.
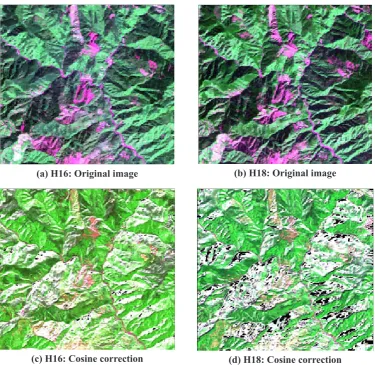
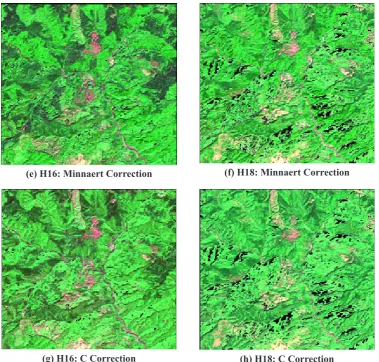
As visual effect is more impressive in true color composite than the single band, the true color composite of band 213 is carried out. Figure 5 presents this visual interpretation of original image, Cosine corrected, Minnaert corrected, and C corrected for H16 and H18 respectively. The result visualization was done by applying the same histogram stretch so that a visual comparison of the pre-corrected versus post-corrected data could be made. The
images in figure 5 are represented by Bands 1,
2 and 3 for green, red and blue respectively. The choice of this band combination is based on the statistical data results summary (table 1) that shows good improvement on these bands, especially for Minnaert correction and C correction methods; as well as the
more natural look resulted from this band
(a) H16 Band 2 image: Uncorrected (b) H16 Band 2 image: Minnaert Corrected
Figure 4. Comparison of uncorrected and Minnaert corrected Band 2.
(a) H16: Original image (b) H18: Original image
(c) H16: Cosine correction (d) H18: Cosine correction
(e) H16: Minnaert Correction (f) H18: Minnaert Correction
(g) H16: C Correction (h) H18: C Correction
Figure 5. (continued)
From Figure 5, by comparing the images visually, it can be seen that all of the images show a decrease in illumination effects when the correction was applied, except in the case
of the Cosine. Figure 5(c) and figure 5 (d)
which are Cosine corrected H16 and Cosine corrected H18 respectively, show the problem of overcorrection on the shadowed areas throughout the images. The corrected image appears to be too bright especially in the
sun-shaded slopes. Significant improvement of the correction can be seen in figure 5(e) and figure 5(f). We can see from these figures that the
visual effect on the slope facing away from the
sun has been improving significantly as a result of Minnaert correction method. Both the slope
facing to the sun and slope facing away from the sun with same cover type appear to have similar brightness. In comparison, the quality of the Minnaert corrected and C-corrected images for both H16 and H18 are visually
similar. However, Minnaert corrected images gives slightly better results as is indicated from statistical data summary in table 1, as well as from visual interpretation. From the visual interpretation, Minnaert correction method gave more natural impression of the surface texture than the C correction method.
One interesting fact that can be seen from
the figure 5 is the occurrence of cast shadow areas, as is indicated by the black areas in the
images. These areas have pixel DN of zero. The cast shadow areas in the H18 are much bigger than that of H16 due to different sun altitude and sun azimuth during the SPOT data acquisition. The H18 was acquisitioned with
sun altitude of 37.6175 degrees, significantly
occurs, leading to the creation of artifacts
in the data (Meyer, 1993). By employing
Minnaert constant and C constant in Minnaert method and C-method respectively, has
significantly reduced the large amount of
overcorrection which exists in Cosine method. However it should be noted that the problem of cast-shadow, where the incident angle i > 90 degrees, is not handled in this correction method and remains to be uncorrected. Cast-shadows are not handled with any correction
methods and appear dark. A special treatment
of these pixels would be necessary.
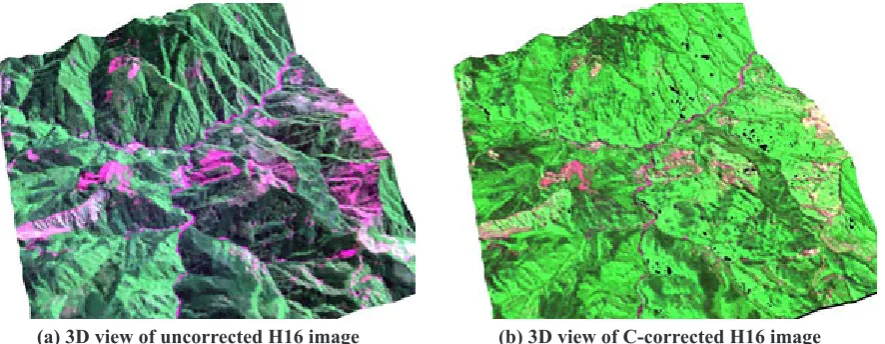
To better visualize the effect of the correction, 3D visualization of both uncorrected and
C-corrected is presented in figure 6. In figure 6 (a), the shadowed slope can be seen
clearly throughout the area. These shadowing artifacts give three dimensional impressions that represent terrain condition throughout the study area. However, by applying C-correction, those areas are represented with similar spectral values. This leads to the disappearance of the three dimensional impression of the corrected image, as seen in
figure 6 (b).
(a) 3D view of uncorrected H16 image (b) 3D view of C-corrected H16 image
Figure 6. 3D visualization of uncorrected and corrected h16 image by C-Correction method.
The more effective use of Minnaert method and C-method than Cosine method in conducting topographic correction for this image has been predicted earlier. Cosine method is based on
the Lambertian reflectance model that assumes the surface reflects incident solar energy
uniformly in all directions, and that variations
in reflectance are due to the amount of incident
radiation. This Lambertian assumption is not valid for the study area since its topography is dominated by rough terrains. On the other hand, the non-Lambertian assumptions seems to be suitable for this conditions since the study area is dominated by forested areas and very undulant terrain conditions, as is demonstrated by Minnaert correction and C correction methods.
Conclusion
Three topographic correction methods have
been tested on two SPOT 5/HRG images of H16
and H18, namely Cosine correction method, Minnaert correction method and C correction method. These three topographic correction methods had different degrees of effectiveness in reducing the dependence of image DN
values on the illumination geometry. Based on
Based on the statistical data and visual
interpretation, Minnaert correction method gave the best results. This method performed well for highly non-Lambertian surfaces, as well as C-correction method which showed good performance even though not as good as the Minnaert method. The inclusion of constants in Minnaert correction method and C correction method has successfully reduced the effect of overcorrection which experienced by the Cosine correction method.
Since the ultimate goal of the topographic correction is to improve the land cover
classification, the evaluation of the
effectiveness of the topographic corrections
for the land cover classification results will be
conducted in the next research. Furthermore, the cast shadows which occur during the topographic correction also need to be considered in order to be able to achieve better
land cover classification results.
References
Blesius, L. and Weirich, F. (2005). The use of the Minnaert correction for land-cover classification in mountainous terrain. International Journal of Remote Sensing, vo. 26, No. 17, 10 September 2005, 3831-3851.
Civco, D. L. (1989). Topographic normalization of Landsat Thematic Mapper digital imagery.
Photogrammetric Engineering and Remote Sensing, 55, pp. 1303-1309.
Giles, P. T. (2001). Remote sensing and cast shadows in mountainous terrain. Photogrammetric Engineering & Remote Sensing, vol. 57, no. 7, July 2001, pp. 833-839.
Jansa, J. (1998). A global topographic normalization algorithm for satellite images. International
Archives of Photogrammetry and Remote Sensing. Vol XXXII, Part 7, Budapest, 1998. Jones, A. R., Settle, J. J. and Wyatt, B. K. (1988). Use of digital terrain data in the interpretation
of SPOT-1 HRV multispectral imagery. International Journal of Remote Sensing, 9, pp. 669–682.
Leprieur, C. E., Durand, J. M. and Peyron, J. L. (1988). Influence of topography on forest reflectance using Landsat Thematic Mapper and digital terrain data. Photogrammetric
Engineering and Remote Sensing, 54, pp. 491–496.
McDonald, E. R., Wu, X., Caccetta, P. and Campbell, N. (2002). Illumination correction of
Landsat TM data in South East NSW. Environment Australia. Retrieved on February 5, 2008 from: http://www.environment.gov.au/land/publications/illumination/index.html
Meyer, P., Itten, K., Kellenberger, T., Sandmeier, S. and Sandmeier, R. (1993). Radiometric
corrections of topographically induced effects on Landsat TM data in an alpine environment. ISPRS Journal of Photogrammetry and Remote Sensing, 48(4):17-28.
Murakami, T. (2007). Comparison of Minnaert constants based on multi-temporal SPOT/HRV
data for three forest types. Bulletin Faculty of Agriculture, Niigata University, 60:83-90, 2007.
Riano, D., Chuvieco, E., Salas, J. and Aguado, I. (2003). Assessment of different topographic
corrections in Landsat-TM data for mapping vegetation types. IEEE Transactions on
Geoscience and Remote Sensing, vol. 41, No. 5, May 2003.
Teillet, P. M., Guindon, B. and Goodenough, D. G. (1982). On the slope-aspect correction of
multispectral scanner data. Canadian Journal of Remote Sensing, 8, pp. 84–106.
& GIS for Environmental Studies (Gottinger Geographische Abhandlungen) edited by
Stefan Erasmi, Bernd Cyffka and Martin Kappas, vol. 113, Gottingen, 2005.
Woodham, R. J. and Gray, M. H. (1987). An analytic method for radiometric correction of
satellite multispectral scanner data. IEEE Transactions on Geoscience and Remote
Sensing, GE-25, pp. 258–271.