LAMPIRAN 1
Perkembangan Laba Bersih (Rp. Milyar) yang Dihasilkan Perusahaan Sektor Industri Barang Konsumsi yang Terdaftar di BEI selama 2010-2012:
No. Nama Perusahaan Kode Tanggal
LAMPIRAN 2
Penentuan target populasi yang akan digunakan pada penelitian:
No. Nama Perusahaan Kode 1 2 3 Jumlah
16 Ultrajaya Milk Industry and TradingCompany Tbk
1. Perusahaan barang konsumsi terdaftar (listing) di Bursa Efek Indonesia (BEI) selama periode 2008-2012.
2. Perusahaan barang konsumsi tersebut telah mengeluarkan laporan keuangannya pada tahun 2008-2012.
LAMPIRAN 3
Data Variabel Dividend Payout Ratio (2009-2012), Laba Bersih Arus Kas Operasi, Current Ratio dan Debt to Equity Ratio (2008-2011) :
Data Variabel Dividend Payout Ratio (%) Tahun 2009-2012 Perusahaan Sampel Industri Barang Konsumsi yang Terdaftar di BEI:
No Kode 2009 2010 2011 2012
Data Variabel Laba Bersih (Rupiah/Lembar Saham) Tahun 2008-2011 Perusahaan Sampel Industri Barang Konsumsi yang Terdaftar di BEI:
Data Variabel Arus Kas Operasi (Juta Rupiah) Tahun 2008-2011 Perusahaan Sampel Industri Barang Konsumsi yang Terdaftar di BEI:
No Kode 2008 2009 2010 2011
1 DLTA 162.006,00 169.345,00 31.742,00 177327,00
2 DVLA 131.706,00 5.688,00 130.614,00 72.518,00
3 GGRM 2.260.895,00 3.265.201,00 2.872.598,00 -90.307,00 4 HMSP 4.745.113,00 4.305.596,00 7.059.975,00 11.088.270,00 5 INDF 2.684.806,00 2.314.507,00 6.909.950,00 4.968.991,00
6 KAEF 22.080,00 80.854,00 139.119,00 81.553,00
7 KLBF 807.700,00 1.363.583,00 1.253.907,00 1.473.495,00 8 TCID 2.872.598,00 188.221,00 157.211,00 73.141,00 9 MYOR 138.452,00 446.429,00 238.253,00 -607.939,00 10 MLBI 415.213,00 526.980,00 320.056,00 671.755,00
11 MRAT 30.430,00 2.437,00 4.613,00 1.143,00
12 TSPC 292.296,00 476.589,00 578.089,00 587.799,00 13 UNVR 2.785.785,00 3.280.710,00 3.619.189,00 5.461.876,00
Data Variabel Current Ratio (%) Tahun 2008-2011 Perusahaan Sampel Industri Barang Konsumsi yang Terdaftar di BEI:
Data Variabel Debt to Equity Ratio (%) Tahun 2008-2011 Perusahaan Sampel Industri Barang Konsumsi yang Terdaftar di BEI:
No Kode 2008 2009 2010 2011
1 DLTA 34,00 27,00 19,00 21,00
2 DVLA 26,00 41,00 33,00 28,00
3 GGRM 55,00 48,00 44,00 59,00
4 HMSP 100,00 69,00 100,00 89,00
5 INDF 311,00 245,00 134,00 70,00
6 KAEF 53,00 57,00 48,00 43,00
7 KLBF 38,00 39,00 23,00 27,00
8 TCID 12,00 13,00 10,00 11,00
9 MYOR 132,00 103,00 118,00 172,00
10 MLBI 173,00 844,00 141,00 130,00
11 MRAT 17,00 16,00 14,00 18,00
12 TSPC 29,00 34,00 36,00 40,00
LAMPIRAN 4
Hasil Statistik Deskriptif
Descriptive Statistics
N Minimum Maximum Mean
Std.
Deviation
DPR 52 13.40 144.65 53.1123 35.25660
Laba Bersih 52 10.00 24,074.00 2,392.2308 5,184.74201
AKO 52 -607,939.00 1.11E7 1.5587E6 2.32372E6
CR 52 65.89 1,174.29 341.5659 251.04030
DER 52 10.00 844.00 85.6923 124.42567
LAMPIRAN 5
Pengujian Hipotesis
Hasil Uji Statistik F
ANOVAb
Model
Sum of
Squares df Mean Square F Sig.
1 Regression 27802,847 4 6950,712 9,179 ,000a
Residual 35591,591 47 757,268
Total 63394,437 51
a. Predictors: (Constant), DER, AKO, Laba Bersih, CR
b. Dependent Variable: DPR
Hasil Uji Statistik t
Coefficientsa
a. Dependent Variable: DPR
Hasil Uji Goodness of Fit
Model Summaryb
a. Predictors: (Constant), DER, AKO, Laba Bersih, CR
LAMPIRAN 6
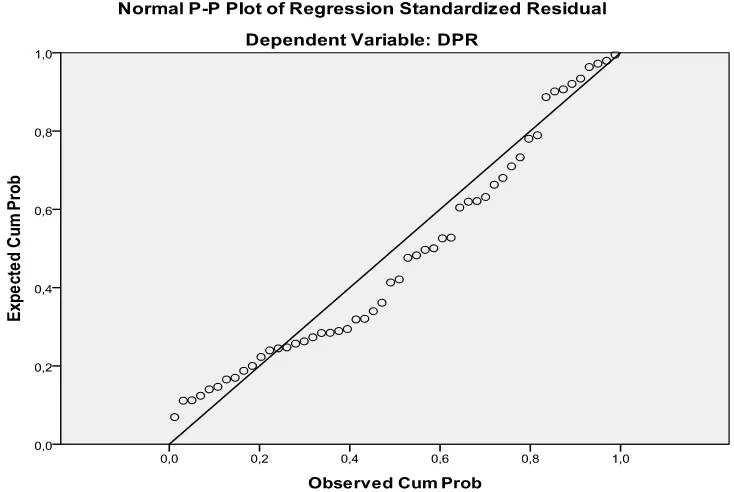
Hasil Uji Asumsi Klasik 1. Uji Normalitas
Grafik Histogram
Hasil Uji One-Sample Kolmogorov-Smirnov Test
One-Sample Kolmogorov-Smirnov Test
Unstandardize
d Residual
N 52
Normal Parametersa,b Mean ,0000000
Std. Deviation 26,41731112
Most Extreme
Differences
Absolute ,129
Positive ,129
Negative -,083
Kolmogorov-Smirnov Z ,929
Asymp. Sig. (2-tailed) ,354
a. Test distribution is Normal.
b. Calculated from data.
2. Uji Multikolinearitas
Hasil Uji Multikolinearitas
3. Uji Autokorelasi
Hasil Uji Runs Test
Runs Test
Unstandardize
d Residual
Test Valuea -5,75642
Cases < Test Value 26
Hasil Uji Durbin Watson Test
Model Summaryb
a. Predictors: (Constant), DER, AKO, Laba Bersih, CR
b. Dependent Variable: DPR
Hasil Uji Breusch Godfrey Test
Coefficientsa
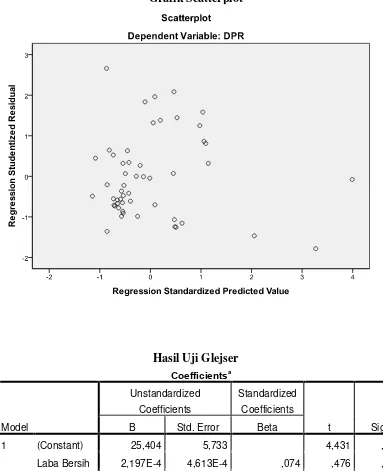
4. Uji Heteroskedastisitas
Grafik Scatterplot
Hasil Uji Glejser
Coefficientsa
Model
Unstandardized
Coefficients
Standardized
Coefficients
t Sig. B Std. Error Beta
1 (Constant) 25,404 5,733 4,431 ,000
Laba Bersih 2,197E-4 4,613E-4 ,074 ,476 ,636
AKO 1,096E-6 1,017E-6 ,165 1,078 ,287
CR -,015 ,010 -,242 -1,441 ,156
DER -,015 ,021 -,125 -,748 ,458