USING AEROSOL REFLECTANCE FOR DUST DETECTION
Shima Bahramvash Shams
1, Ali Mohammadzade
21
Master student of photogrammetry in K.N Toosi University of Technology, TEHRAN, [email protected]
2
Assistant professor of remote sensing department, K.N Toosi University of Technology, TEHRAN, IRAN- [email protected]
KEY WORDS: Dust detection, aerosol reflectance, surface reflectance, Rayleigh path radiance, MODIS L1B
ABSTRACT
:
In this study we propose an approach for dust detection by aerosol reflectance over arid and urban region in clear sky condition. In urban and arid areas surface reflectance in red and infrared spectral is bright and hence shorter wavelength is required for this detections. Main step of our approach can be mentioned as: cloud mask for excluding cloudy pixels from our calculation, calculate Rayleigh path radiance, construct a surface reflectance data base, estimate aerosol reflectance, detect dust aerosol, dust detection and evaluations of dust detection. Spectral with wavelength 0.66, 0.55, 0.47 μm has been used in our dust detection. Estimating surface reflectance is the most challenging step of obtaining aerosol reflectance from top of atmosphere (TOA) reflectance. Hence for surface estimation we had created a surface reflectance database of 0.05 degree latitude by 0.05 degree longitude resolution by using minimum reflectivity technique (MRT). In order to evaluate our dust detection algorithm MODIS aerosol product MOD04 and common dust detection method named Brightness Temperature Difference (BTD) had been used. We had implemented this method to Moderate Resolution Imaging Spectroradiometer (MODIS) image of part of Iran (7 degree latitude and 8 degree longitude) spring 2005 dust phenomenon from April to June. This study uses MODIS LIB calibrated reflectance high spatial resolution (500 m) MOD02Hkm on TERRA spacecraft. Hence our dust detection spatial resolution will be higher spatial resolution than MODIS aerosol product MOD04 which has 10*10 km2 and BTD resolution is 1 km due to the band 29 (8.7μm), 31 (11μm), and 32 (12μm) spatial resolutions.
1. INTRODUSTION
Dust is one of the most important aerosol in earth atmosphere and it has massive impact on different aspect of life on earth ecosystem and Dust cycle affects energy, water and carbon cycles (Shao et al., 2011). An annual estimation indicate that 2000 Mt dust emitted which 75% deposited to the land and reminder to the ocean (Shao et al., 2011). Absorption and scattering of solar radiance cause dust loading affects air temperature, cloud shape and air transmission (Goudie, 2009). According to WMO (World Meteorological Organization) protocol dust event divided to four groups due to their visibility and wind speed: Dust-in-Suspension, Blowing Dust, Dust Storm and Severe Dust Storm. So dust storm is type of dust event that is result of turbulent winds and contain large desert soil particle and reduced visibility under 1 km (Goudie, 2009; Shao and Dong, 2006).
Dust events have abundant influence on earth system. Dust plumes transmit huge distance and hence dust outbreaks have global impact on earth ecosystem (Goudie, 2009). Dust influence different aspect of human life: civilian and military accidents, various disease which is due to salt (originated from dried lake basins) and chemical particle
mixed with dust. There is lots of environmental parameter that affect dust events: wind speed (which is main activation factor), soil structure and its particle size, vegetation cover, land use and topography. In different studies each of mentioned parameter and their influence had been discussed (Engelstaedter et al., 2003; Schepanski et al., 2009; Zender et al., 2004). In recent decade frequency of dust storm occurrence has increase in most part of the world where desertification and lake desiccation occur (Goudie, 2009) and that is one of reason that cause focus on the dust detection studies increased.
Owing to this dust detection is key factor to prevent dust damages and remote sensing had been one of the basic methods for dust detection studies, different sensor with various spatial and temporal resolutions had been used for this purpose. Most studies focus on determination of dust transmittance path, dust impact on human and ecosystem, dust sources location, dust storm frequency and reasons of dust frequency change (Goudie, 2009). In the following lines some of methods that have been used for dust detection will be mentioned.
discrepancy between measured scattered reflectance and calculated reflectance due to atmospheric model with assumption pure gases (Rayleigh scattering) and use ultraviolet wavelength. positive value of AI indicate absorbing aerosols and named absorbing aerosol index (AAI), researches indicate that AAI is correlated with dust optical thickness and concentration (Prospero et al., 2002). Moreover this method has been used in OMI sensor studies which is replacement for TOMS and AI has been substituted by ultraviolet AI (UVAI) (Torres et al., 2007). Main limitation of this method is being sensible to all absorbing aerosol hence it is unable to distinguish between biomass burning smoke and dust (Ginoux et al., 2010; Hsu et al., 2004), another limitations that can be mentioned is correlation between aerosol height and AI that cause incapability of AI to detect low aerosols (height less than 500-1000 m) (Prospero et al., 2002).
Brightness Temperature Difference (BTD) is simple method based on discrepancy between brightness temperatures of different infrared wavelengths thus it could detect absorbing aerosol by computing each aerosol threshold (dust and smoke) (Ackerman, 1997; Baddock et al., 2009; Legrand et al., 2001). All of the sensors that cover infrared spectral can use this method. Based on this method other algorithms has been developed such as study that was Conduct by Zhao et al (Zhao et al., 2010) that by determination of parameter that could discern thick aerosol from fine aerosols. Outputs of all these methods are binary and being executable just during the daytime is one of its limitation, Bitemporal Mineral Dust Index (BMDI) algorithm had been carried out by Klüser et al (Klüser and Schepanski, 2009) to overcome this problem by means of using difference of BTD in day and night time that in present of dust will be negative. This algorithm had been executed through Meteosat Second Generation (MSG-SEVIRI) because it has high temporal resolution (15 min). All of these methods are sensitive to threshold value which is related to metrological situation of study area, other weaknesses of these methods: inexecutable in high humidity area such as coastal region (Klüser and Schepanski, 2009; Legrand et al., 2001), provide no information about aerosol particles properties (Zhao et al., 2010).
Visible red and infrared radiance from urban areas are high and bright so just using infrared spectrum for dust detection in these regions is not feasible however in blue spectrum the backscattered radiance are dark and if dust aerosol was presented blue backscattered radiance increased and red and infrared radiance decrease (Hsu et al., 2004) . In this algorithm by applying a radiative transfer model and satellite geometry and surface reflectance data base a look up table (LUT) is made and by comparing received radiance and radiances of LUT and using maximum likelihood method aerosol optical thickness (AOT) and
single scatter albedo ( ) will be retrieved. All of the absorbing aerosols had been detected in this algorithm hence it limit study area to arid region that no smoke is presented (Hsu et al., 2004), using frequency of occurrence (FOO) is another way to solve this problem (Ginoux et al., 2010; Prospero et al., 2002). Estimation of surface reflectance from top of atmosphere (TOA) radiance is one the most challenging step of this method (Levy et al., 2007).
In this study we focus on aerosol reflectance to identify dust phenomena but not in a binary way such as BTD and so we should decompose top of atmosphere (TOA) reflectance to Rayleigh path radiance and surface reflectance to obtain aerosol reflectance. Further discuss on method will be in following section. We apply our method to MODIS L1B calibrated reflectance high spatial resolution (500 m) MOD02Hkm on TERRA spacecraft. MODIS has global cover and contain 36 band and its temporal resolution is between 1_ 2 day which is motive for lots of cloud and aerosol researches (King et al., 2003). Our case study is 7 degree latitude (30 _37 ) and 8 degree longitude (46 _54 ) of Iran which contain several states.
2. METHOD DESCRIPTION
Radiance that received to sensor is mixture of solar radiance that reflected by surface and part of solar radiance that reflected by atmosphere without reaching that ground surface (path radiance). Koufman et al (Kaufman et al., 1997) by assuming uniform Lambertian surface express TOA reflectance by equation 1:
R (ϻ,ϻ0,Ф)= R0 (ϻ,ϻ0,Ф)+ (T*As)/ (1-s*As) (1)
Where R is TOA reflectance, R0 is atmospheric path
radiance which is combination of Rayleigh and aerosol path radiance, As is surface reflectance, T is total transmittance
upward and downward radiance, s is hemispheric atmospheric reflectance, ϻ and ϻ0are cosine solar, sensor
zenithandФ is relative azimuth angle.
Figure 1. Schematic algorithm steps
2.1. Cloud masking
In most of the dust detection method first step is excluding cloudy pixels and work with clear sky and aerosols Contamination pixels. As we want to work MOD02Hkm data and it just included band 1_7 MODIS, using infrared base algorithm(Ackerman et al., 1998) for cloud masking is not possible hence we use methods that pixels with TOA spectral reflectance higher than 0.2 for band 2 MODIS indicate cloud Contamination (Kokhanovsky, 2001) as most of threshold value are related to the climatology of case study region we test range of [1.5 3] for this parameter and best result had been achieved by 0.2. Another condition that had been used for could masking was NDVI less than zero.
2.2. Rayleigh path radiance
For Rayleigh path radiance two main elements should be calculated, Rayleigh optical depth and Rayleigh phase function. Rayleigh optical depth can be obtained according to spectral wavelength and pixel elevation(Bucholtz, 1995). By pixel elevation we retrieve pixel pressure and try to overcome its effects on Rayleigh path radiance. Digital elevation model (DEM) can prepare the height information which had been provided by MODIS geolocation data MOD03. Phase function is estimated due to scatter angle and Rayleigh polarization factor.
2.3. Surface reflectance
Estimating surface reflectance is the most challenging step of obtaining aerosol reflectance from top of atmosphere (TOA) reflectance (Hsu et al., 2004; Koelemeijer et al., 2003). Hence for surface estimation we had created a surface reflectance database of 0.05 degree latitude by 0.05
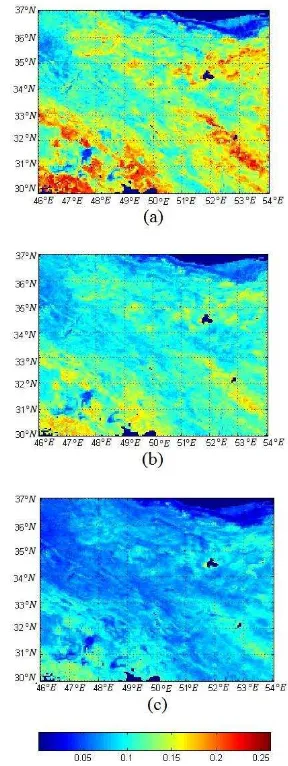
degree longitude resolution. As surface reflectance change during each season it should be calculated due to each season separately. The selected method for this estimation is minimum reflectivity technique (MRT) which is the minimum reflectance of image collection (Koelemeijer et al., 2003). Another important problem in surface reflectance is minimizing bidirectional reflectance distribution function (BRDF) effect; with this intention sensor zenith more than 35 degree should be excluded from data set. Cloud shadow made false minimum reflectance decision and affect longer wavelength more than shortwave hence we find the minimum for the shorter wavelength and put exact same day value for minimum of longer wavelength (Hsu et al., 2004) another issue that we apply for we select second minimum reflectance which its disparity to first minimum reflectance is less than 0.03(Wong et al., 2010). MRT surface reflectance of our case study in spring 2005 is shown in figure 2.
2.4. Aerosol reflectance
After creating a surface data base we can estimate aerosol reflectance of each image. For this process, after excluding cloudy pixels in the described way and by using equation 1 and each image Rayleigh path radiance and surface data base we can obtain aerosol reflectance.
2.5. Indexing
Final result of our dust detection will be clustered into 5 groups according to their aerosol reflectance: clear condition, lower, median, high and very high dust load. We have this indexing for three spectral bands of MODIS separately, bands 1, 3, 4.
3. EVALUATION
MODIS aerosol product, MOD04 provide aerosol optical thickness (AOD) in 10 km resolution, which is reliable variable especially for AOD>0.2. Challenging issue in using this product is its course resolution hence small area aerosols will be neglect. We had been used AOD in band 1, 3, 4 MOD04 for our validation of same band dust index.
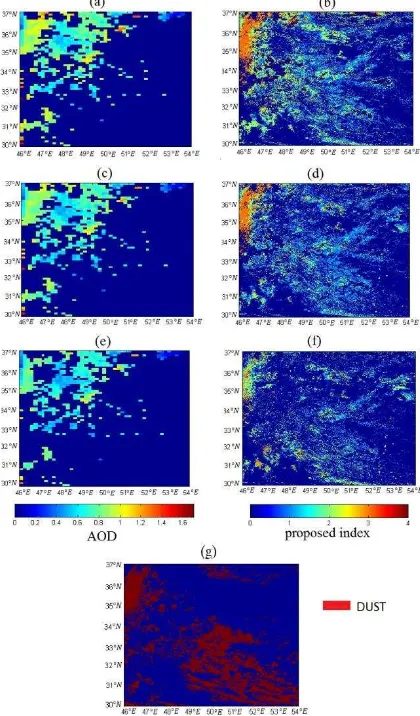
As mentioned before BTD in another way to distinguish dust phenomena. We use BTD 12 and 10.8 μm and BTD 10.8 and 8.7 μm and BT 8.7 for dust detection. We had been used trial and error approach to find thresholds. In figure 3 our dust index result and other methods had been shown.
There is a concept difference between BTD method and AOD MOD04 hence their results have disparity according to size and dust characteristic (Klüser and Schepanski, 2009). To overcome disparity in resolutions of MOD04 (10 km) and BTD (1 km) and our method (500 m) we resample our result to each of two mentioned results resolution in order to compare with them. Our proposed algorithm has more than 70% correlation with BTD and 60% correlation with MOD04 AODs.
4. CONCULUSION
A new algorithm for dust detection has been proposed which is based on aerosol reflectance of MODIS L1B 500m images of part of Iran. Estimating aerosol reflectance is according to calculated seasonal MRT surface reflectance data base (0.05 degree latitude and 0.05 degree longitude) and Rayleigh path radiance. We had indexed Obtaining dust reflectance in 5 clusters according to pixel aerosol reflectance value hence our final result are not binary and provide information about dust load. Our result has been evaluated with BTD and MOD04 AODs.
Proposed algorithm was correlated over 70% with BTD and 60% with MOD04 optical depth. Our dust detection resolution is 500 m, BTD resolution is 1 km and MOD04 resolution is 10 km hence our result have high spatial resolution.
Figure 3. comparing our algorithm result and MOD04 and BTD of dust phenomena in 15 may of 2005. (a) MOD04
AOD 0.47 μm, (b) our proposed index for 0.47 μm, (c)
MOD04 AOD 0.55 μm, (d) our proposed index for 0.55
μm, (e) MOD04 AOD 0.66 μm, (f) our proposed index for
0.66 μm, (g) BTD result.
ACKNOWLEGMENT
The authors appreciate the NASA's Goddard Space Flight Center's Level 1 and Atmosphere Archive and Distribution System (LAADS) for the online distribution of the MODIS data.
Ackerman, S. A., 1997, Remote sensing aerosol using satellite infrared observations: Journal of Geophysical
Research, v. 102, no. D14, p. 17069−17079.
Ackerman, S. A., Strabala, K. I., Menzel, W. P., Frey, R. A., Moeller, C. C., and Gumley, L. E., 1998, Discriminating clear sky from clouds with MODIS: Journal of Geophysical Research, v. 103, p. 141-157.
Baddock , M. C., Bullard , J. E., and Bryant , R. G., 2009, Dust source identification using MODIS: A comparison of techniques applied to the Lake Eyre Basin, Australia: Remote Sensing of Environment, v. 113, p. 1511–1528.
Bucholtz, A., 1995, Rayleigh-scattering calculations for the terrestrial atmosphere: Applied Optic, v. 34, p. 2765_2773. Engelstaedter, S., Kohfeld, K. E., Tegen, I., and Harrison, S. P., 2003, Controls of dust emissions by vegetation and topographic depressions: An evaluation using dust storm frequency data: Geophysical Research Letters, v. 3.
Ginoux, P., Garbuzov, D., and Hsu, H. J., 2010, Identification of anthropogenic and natural dust sources using Moderate Resolution Imaging Spectroradiometer (MODIS) Deep Blue level 2 data: Journal of Geophysical Research, v. 115.
Goudie, A. S., 2009, Dust storms: Recent developments: Journal of Environmental Management, v. 90, p. 89–94.
Hsu, H. J., Tsay, S.-C., King, M. D., and Herman, J. R., 2004, Aerosol Properties Over Bright-Reflecting Source Regions: IEEE Transactions on Geoscience and Remote Sensing, v. 42, no. 3, p. 557–569.
Kaufman, Y. J., Tanre, D., Gordon, H. R., Nakajima, T., Lenoble, J., Frouins, R., Grassl, H., Herman, B. M., KING, M. D., and Teillet, P. M., 1997, Passive remote sensing of tropospheric aerosol and atmospheric correction for the aerosol effect: Journal of Geophysical Research, v. 102, no. D14, p. 16,815-816,830.
King, M. D., Menzel, W. P., Kaufman, Y. J., Tanré, D., Gao, B. C., Platnick, S., Ackerman, S. A., Remer, L. A., Pincus, R., and Hubanks, P. A., 2003, Cloud and aerosol properties, precipitable water, and profiles of temperature and water vapor from MODIS: IEEE Trans.Geosci.Remote, v. 41, p. 442–458.
Klüser, L., and Schepanski, K., 2009, Remote sensing of mineral dust over land with MSG infrared channels: A new Bitemporal Mineral Dust Index: Remote Sensing of Environment, v. 113, p. 1853–1867.
Koelemeijer, R. B. A., de Haan, J. F., and Stammes, P., 2003, A database of spectral surface reflectivity in the range 335–772 nm derived from 5.5 years of GOME observations: Journal of Geophysical Research, v. 108, no. D2, p. 4070.
Kokhanovsky, A. A., 2001, Reflection and transmission of polarized light by optically thick weakly absorbing random media: J. Opt. Soc. Am, v. 18, p. 883–887.
Legrand, M., Plana-Fattori, A., and N'doumé, C., 2001, Satellite detection of dust using the IR imagery of Meteosat: 1. Infrared difference dust index: Journal of Geophysical Research, v. 106, no. D16, p. 18,251-218,274.
Levy, R. C., Remer, L. A., Mattoo, S., Vermote, E., and Kaufman, Y. J., 2007, Second-generation operational algorithm: Retrieval of aerosol properties over land from inversion of Moderate Resolution Imaging Spectroradiometer spectral reflectance: J. Geophys. Res, v. 112, no. D13211.
Prospero, J. M., Ginoux, P., Torres, O., Nicholson, S. E., and Gill5, T. E., 2002, Envirmental Characterization Of Global Sourses Of Atmospheric Soil Dust Identified With The NIMBUS7 Total Ozone Mapping Spectrometer (TOMS) Absorbing Aerosol Product: Geophysics, v. 40.
Schepanski, K., Tegen, I., Todd, M. C., Heinold, B., Bonisch, G., Laurent, B., and Macke, A., 2009, Meteorological processes forcing Saharan dust emission inferred from MSG-SEVIRI observations of subdaily dust source activation and numerical models: Journal of Geophysical Research, v. 114.
Torres, O., Tanskanen, A., Veihelmann, B., Ahn, C., Braak, R., Bhartia, P. K., Veefkind, P., and Levelt, P., 2007, Aerosols and surface UV products from Ozone Monitoring Instrument observations: An overview: Journal of Geophysical Research, v. 112, no. D24S47.
Wong, M. S., Lee, K.-H., Nichol, J. E., and Li, Z., 2010, Retrieval of Aerosol Optical Thickness using MODIS 500 x 500m2, a study in Hong Kong and Pearl River Delta region: IEEE Transactions on Geoscience and Remote Sensing, v. 48.
Zender, C. S., Miller, R. L., and Tegen , I., 2004, Quantifying mineral dust mass budgets: Terminology, constraints, and current estimates: Eos Trans, v. 85, p. 509– 512.