Suhaimi Tegamuni, 2012
Performance Based Assessment On Young Learners’ Speaking Skill Universitas Pendidikan Indonesia | repository.upi.edu
58 CHAPTER III
RESEARCH METHODOLOGY
This chapter will outline the design of the research, site and participants of the
study, and data collection techniques. The method presented is expected to serve
supporting and valid data in order to help the researcher to directional to the study.
The maximum result is expected to be able in answering the research questions.
3.1 Design of the Research
The researcher plans to do the research based on principal quantitative and
qualitative research. To answer the research question number one, the study will
focus on an experiment design as long as researcher will conduct the research more
than just observing the subject but measuring the performance of students This study
attempts at testing an idea (practice or procedure) to determine whether it influences
an outcome or dependent variable (Creswell, 2008: 299). The type of experimental
design of this research will be a quasi-experimental assignment because of inability
of the experimenter to randomly assign the existing class. Randomly assigning
students to the new group will disrupt classroom learning (Creswell, 2008: 134). To
answer the research question number two, the study will descriptively analyze how is
the teacher’s perception towards students speaking skill achievement after using
Suhaimi Tegamuni, 2012
Performance Based Assessment On Young Learners’ Speaking Skill Universitas Pendidikan Indonesia | repository.upi.edu
59 questions above, some data collection techniques with research tools are delivered to
obtain the appropriate data. There were pre-test and post-test and also questionnaire
will be employed in order to answer the research questions. Through this
methodological and some additional aspect within hopefully will support the research
finding more reliable.
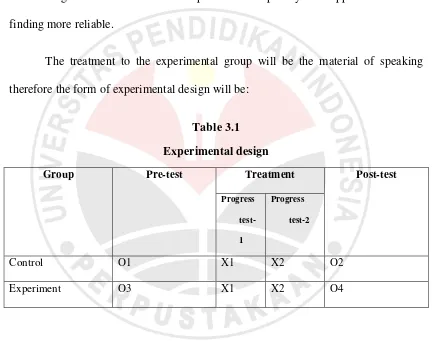
The treatment to the experimental group will be the material of speaking
therefore the form of experimental design will be:
Table 3.1
Experimental design
Group Pre-test Treatment Post-test
Progress
test-1
Progress
test-2
Control O1 X1 X2 O2
Experiment O3 X1 X2 O4
Explanation:
O : Pretest and posttest of speaking skill material
X1 : Progress test
Suhaimi Tegamuni, 2012
Performance Based Assessment On Young Learners’ Speaking Skill Universitas Pendidikan Indonesia | repository.upi.edu
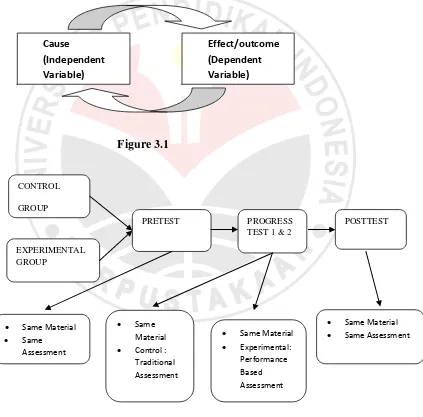
60 The experimental design used in this study is in the form of
quasi-experimental. The participant firstly will be pre tested both control and experimental
61 3.2 Site and Participant
The researcher plans to conduct this research in one RSBI elementary school
in Ternate. This site is chosen because this school was one of popular school in
Ternate, and located in researcher’s hometown. Therefore it is possible for the
researcher to gain more information related to this research. Other interest coming
from the researcher’s problem stated in this research problem that researcher wants to
find out the performance based assessment on young learner’s speaking skill. The
participants will be students from the forth and fifth grade of that school. Because
students at this stage are already familiar with English teaching and for the extent that
at this stage it is proper to assess their performance, and the second participant will be
the English teacher from that school. In this research, the researcher will observe how
is teacher’s perception toward the effect of performance based assessment to young
learners’ speaking skill achievement. To get more information on young learners’
speaking skill achievement in English after treatment especially in their performance
assessment, researcher will give questioners for teachers.
In this study there will be two classes, grade 5 will be the control group and
grade 4 will be the experimental group, under consideration that grade 5 is one level
higher in learning English, so it is possible to set the students as control group. The
participants will be at least 35 students which has the same material to be treated, it is
speaking subject. From the two groups, the control group will be assessed using non
62 will be assessed using performance based assessment. In pretest both two group will
be served same material and assessed in same way. In progress test and posttest there
will be different assessment but still given the same material. The control group will
be assessed using non performance based assessment (traditional assessment) and
experimental group will be assess using performance based assessment.
3.3 Techniques of collecting the data
To collect the data, some possible techniques will be used in this research, for
example test and delivering a questionnaire. But the supplementary tools also take
into account in order to get more specific information.
3.3.1 Test
Test is a group of questions or exercises or other instrument that used to
measure skill, intelligence development or achievement of an individual or group.
Test may be constructed primarily as devices to reinforce learning and to motivate the
students or primarily as a means of assessing the young learners’ performance in the
language (Heaton, 1995: 5).
Testing the ability to speak is a most important aspect of language testing.
However, at all stages beyond the elementary level of mimicry and repetition it is an
extremely difficult to test (Heaton, 1995: 88). The speaking test will be gathered from
textbook for students in grade 4. In order to meet the validity and reliability, the test
63 3.3.1.1 Pre-test
The pretest is carried out to detect the starting skill of the student before the
trial test of the appointed teaching model is conducted. The data taken from the result
of pre-test represents the controlled variable to see the speaking skill equity in the
control class as well as experimental class through the matching test. Both the
material and assessment given to control and experimental group are the same.
3.3.1.2 Progress-test
The progress test is given to both control and experimental group in order to
examine the assessment. The material given is still the same, but the treatment it self
then differ from other treatment model because this experiment is willing to test the
effectiveness of performance based assessment. Under the consideration that the
performance based assessment is an assessment that has positive effect on learning
(Moskal: 2003 ), so the treatment to the groups will be based on the assessment. The
control group will be assessed using traditional assessment (paper and pencil test) and
the experimental group will be assessed using performance based assessment (PBA).
3.3.1.3 Post-test
The post-test is principally conducted similarly as the pre-test. The difference
lays only the test conducted on posttest. Both groups are tested using the same
assessment, for example the paper and pencil test. The data in this post-test is used to
64 after the treatment on performance has been completed. This is intended to find out
the extent of the performance based assessment implementation and its contribution
to young learners’ speaking skill. The control group and the experimental group will
be assessed using traditional assessment (paper and pencil test). The differentiation of
the test is aiming at finding how well the performance assessment will contribute to
young learners’ speaking skill achievement as they have tested in progress test 1 and
2.
3.3.1.4 Scoring
The instruments use in the research is intended to find and elicit the whole
relevant data. The instruments are the speaking test and questionnaire form. The
speaking test made in this research based on the principles of performance based
assessment which requires young learners’ to produce their skill naturally. In order to
avoid the bias, some reflection of document analysis will be conducted, for example
the researcher will study the lesson plan and the textbook used by the teacher and
how the standardized assessment criteria usually used in order to avoid young
learners’ confuse.
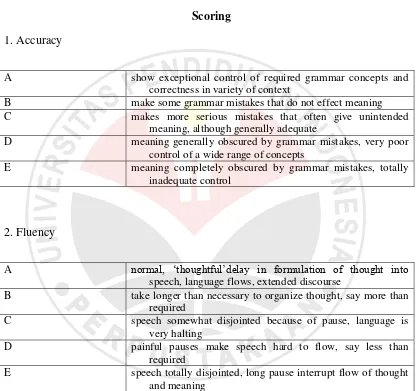
The component scoring of young learners’ ability in speaking as suggested by
65 Table 3.2
Scoring
1. Accuracy
A show exceptional control of required grammar concepts and correctness in variety of context
B make some grammar mistakes that do not effect meaning
C makes more serious mistakes that often give unintended
meaning, although generally adequate
D meaning generally obscured by grammar mistakes, very poor control of a wide range of concepts
E meaning completely obscured by grammar mistakes, totally
inadequate control
2. Fluency
A normal, ‘thoughtful’delay in formulation of thought into speech, language flows, extended discourse
B take longer than necessary to organize thought, say more than
required
C speech somewhat disjointed because of pause, language is very halting
D painful pauses make speech hard to flow, say less than required
E speech totally disjointed, long pause interrupt flow of thought and meaning
3. Vocabulary
A very conversant with vocabulary required by given context(s),
excellent control and resourcefulness
66
C adequate, although more serious mistakes give unintended
meaning (wrong preposition, incorrect word choice, mangled word, etc)
D meaning frequently obscured by minimal/inadequate of
vocabulary
E meaning totally obscured, inadequate vocabulary
4. Pronunciation
A correct pronunciation and intonation, very few mistakes,
almost native-like
B some mispronunciation, meaning still clear
C pronounced foreign accent requiring
extra-symphataetic-listening comprehensible
D meaning frequently obscured by poor pronunciation,
minimally comprehensible
E no effort at all and sound often incomprehensible
Weighting of Grades
A = 4,5 – 5,0 Accuracy_____________x6 =
B = 4,0 – 4,4 Fluency______________x3 =
C = 3,5 – 3,9 Pronunciation_________x4 =
D = 3,0 – 3,4 Vocabulary ___________x7 =
E = below 3,0
For this kind of appraisal it is determined that the highest grade is 100 and the
lowest is 0. The grading formula mentioned above is sufficient for the collecting of
67 3.3.2 Questionnaire
Questionnaires are an inexpensive way to gather data from a potentially large
number of respondents. Often they are the only feasible way to reach a number of
large enough reviewers and the result being analyzed statistically. There are two types
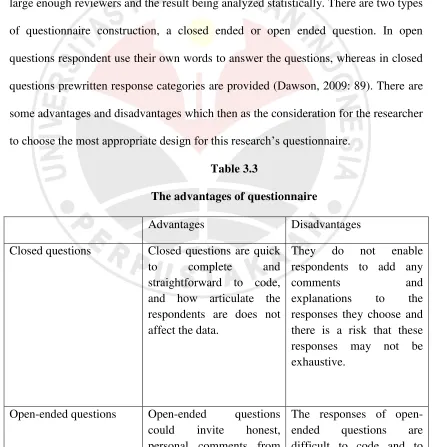
of questionnaire construction, a closed ended or open ended question. In open
questions respondent use their own words to answer the questions, whereas in closed
questions prewritten response categories are provided (Dawson, 2009: 89). There are
some advantages and disadvantages which then as the consideration for the researcher
to choose the most appropriate design for this research’s questionnaire.
Table 3.3
The advantages of questionnaire
Advantages Disadvantages
Closed questions Closed questions are quick
to complete and
straightforward to code, and how articulate the
Open-ended questions Open-ended questions could invite honest, personal comments from
68 the respondents in addition
to simply ticking boxes in the given options
classify.
However, some experts proposed to use the combination of the two
approaches such as (Stone, 1993; Leung, 2001), but on researcher’s opinion, it will be
appropriate to use the close-ended question. Related to this research, Likert scale was
used to measure the teacher’s perception toward young learners’ speaking skill
achievement after treated by performance based assessment method and it based on
three factors such as (1) the sensory of nature stimulus, (2) personal feelings,
attitudes, drives and goals (3) previous related sensory experience (Sperling: 1987 in
Fransisca: 2000). The first factor was related to teacher’s response towards students
behavior in using spoken language, the second factor was focused on teacher’s
feeling whether or not those students have used the spoken language in the classroom
(concerning the opinion on ‘happy’, not ‘happy’) listening and seeing students
performing the language, attitudes (concerning her opinion on ‘motivated’ or ‘not
motivated’) listening and seeing the students performing the language, drives
(concerning the teacher’s opinion on ‘excited’ and ‘not excited’) listening and seeing
the students performing the language, goals (focusing on teacher’s opinion on
‘facilitated’ or not ‘facilitated’). The last factor was associated with the teacher’s
opinion on the previous young learners’ use of English Language. In order to make
69 questionnaire to some of friends do research on Magister degree with different
subject with researcher.
3.3.2.1 Questionnaire’s scoring criteria
In order to understand how the scoring criteria of the questionnaire being
applied, here is the presentation of questionnaire’s scoring criteria which will be used
in analyzing the teacher’s perception in this research;
Questionnaire’s Scoring Criteria
A. Sensory of the stimuli Hearing
70
C. Previous related sensory experience
---100%
This study will firstly analyze the literature and site of the research object, for
example the syllabus and the lesson plan used in the teaching and learning process.
The purpose of reviewing the lesson plan is, it will shape the understanding of how
far do the students have learn by using the current assessment model especially for
71 will best require to students and researcher could find the best solution relevant to the
research. The use of textbook will be very important to learning process in the
classroom, but it won’t if the textbook material is not relevant to current regulation
set by the government as it mentioned on the syllabus and the content standard, so the
researcher will also reviewing the textbook. The last two materials will be reviewed
are the test and questionnaire.
As mentioned before that this experimental research will be divided into two
groups, the control and experimental group. Both groups will be served the pretest
and the same speaking material subject. The experimental group will be assessed
using the performance based assessment. After the treatment both two groups will be
tested in posttest and later questionnaire will be delivered to the teacher in order to
discover teacher’s response of whether or not the performance based assessment will
affect students speaking skill achievement.
3.5. Research Instruments
The instruments used to get the data were test (pretest and posttest) and
questionnaire. The questionnaire is used only to get the information from the teacher.
It is important to test the instrument before being delivered to the subject of research.
3.5.1 Validity
It is important to note that the good data and instrument will provide a good
72 (Arikunto: 2010). The most simplistic definition of validity is that it is the degree to
which a test measured what it is supposed to measured (Gay, 1983: 110) or in general
we could understand the meaning of validity by asking does the instrument measure
what it is supposed to measure? (Kerlinger, 2000: 189) in Arikunto (2010).
There are two important concepts in interpreting the validity, those are
accuracy and relevancy. The concept of accuracy dealing with how accurate the
instrument is to identify the measuring aspects or in other words how accurate the
instrument is in describing the real condition. While the concept of relevance dealing
with how the instrument is able to use as it intended to measure.
The validity of this research will be the content validity of the test. Before the
test is delivered to the students of control and experimental group, first it has been
recheck whether or not the test is suitable for students at that stage. Researcher takes
the experimental group as sample base which its test and criterion should be
compatible with the curriculum stated. This test first will be delivered to student in
other higher classes, under the assumption that those higher classes have taken up
with this material and English subject.
The test itself has been taken from the textbook and rematch with the
curriculum and syllabus stated of the institute. In order to avoid biases, the
73 made by the teacher. Based on the given statement, form of the test is attached in
attachment page.
There are two important points to note on content validity: the validity of the
grain, and the validity of the sampling. The validity of items related to the question
how far the instrument items reflect the entire contents of the aspects or domains to
be measured. The validity of sampling related to the question how far the instrument
items are become a representative sample of the whole or a material aspect or domain
being measured.
In order to make sure that the item of the test is valid or not, this research will
apply an item analysis. Item analysis is aiming at identifying the good and bad items
of the test. By applying this method, it will gives us information on how bad is the
item test so as a testee or teacher we could fix it. The item test analysis will use
Pearson Product Moment formula. To obtain the data, researcher will use Microsoft
Excel as the tool to compute the item analysis using Pearson Product Moment
formula in t Microsoft Excel. The formula will be
� = � XY –
[� X2−( X)2][N Y2 − ( Y)2]
� = correlation coefficient
74 = total of the item score
N = Subject
The value of r will be confirmed to the Pearson product moment table correlation
coefficient with level of significance α = 0,05 and the df = N-2
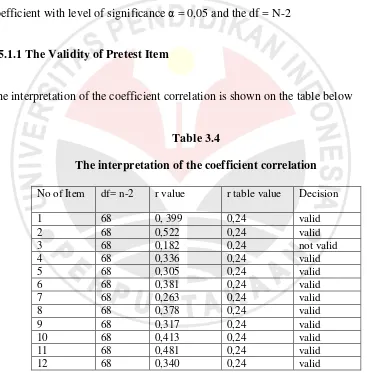
3.5.1.1 The Validity of Pretest Item
The interpretation of the coefficient correlation is shown on the table below
Table 3.4
The interpretation of the coefficient correlation
No of Item df= n-2 r value r table value Decision
1 68 0, 399 0,24 valid
2 68 0,522 0,24 valid
3 68 0,182 0,24 not valid
4 68 0,336 0,24 valid
5 68 0,305 0,24 valid
6 68 0,381 0,24 valid
7 68 0,263 0,24 valid
8 68 0,378 0,24 valid
9 68 0,317 0,24 valid
10 68 0,413 0,24 valid
11 68 0,481 0,24 valid
12 68 0,340 0,24 valid
Based on the table shown above item number 3 is not valid because r value is 0,182 <
0,25 of r table. Item number 1,2, 4,5,6,7,8,9,10,11, and 12 are valid. So the invalid
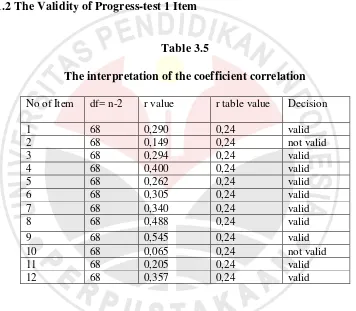
75 3.5.1.2 The Validity of Progress-test 1 Item
Table 3.5
The interpretation of the coefficient correlation
No of Item df= n-2 r value r table value Decision
1 68 0,290 0,24 valid
2 68 0,149 0,24 not valid
3 68 0,294 0,24 valid
4 68 0,400 0,24 valid
5 68 0,262 0,24 valid
6 68 0,305 0,24 valid
7 68 0,340 0,24 valid
8 68 0,488 0,24 valid
9 68 0,545 0,24 valid
10 68 0,065 0,24 not valid
11 68 0,205 0,24 valid
12 68 0,357 0,24 valid
Based on the table shown above item number 2 and 10 is not valid because r value is
0,149 and 0,065 < 0,25 of r table. Item number 1,3,4,5,6,7,8,9,,11, and 12 are valid.
So the invalid item will be ignored.
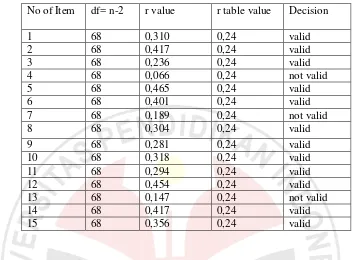
3.5.1.3 The Validity of Progress test 2 Item
Table 3.6
76
Based on the table shown above item number 4,7 and 13 is not valid because r value
is lower than the r table. Item number 1,2,3,5,6,8,9,11, 12, 14and 15 are valid. So the
invalid item will be ignored.
3.5.1.4 The Validity of Posttest Item
Table 3.7
The interpretation of the coefficient correlation
77
11 68 0,175 0,24 not valid
12 68 0,213 0,24 valid
13 68 0,414 0,24 valid
14 68 0,250 0,24 valid
15 68 0,120 0,24 not valid
3.5.2 Reliability
Reliability of the data is an assumption behind all statistical procedures to
inform the readers or researchers about how reliable the data are (Hatch and
Lazaraton, 1991:529). The reliability of test in this research will include the difficulty
index and distracter analysis.
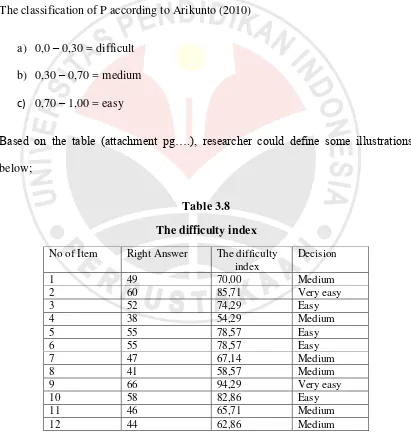
3.5.2.1The Difficulty Index of Pretest
It is important to note that the good test item isn’t depending on how easy and
difficult the test is. So teachers should able in arranging those test items
appropriately. The difficulty index is marked between the number 0,00 --- 1,0.
Items with the difficulty index 0,00 show that the items is too difficult and items with
the difficulty index of 1,0 means that the items is too easy.
Here is the illustration
0,0 --- 1,0
The formula will be used is
�= �
78 P = index of difficulty
B = students who answer the right items
JS = amount of students
The classification of P according to Arikunto (2010)
a) 0,0 – 0,30 = difficult
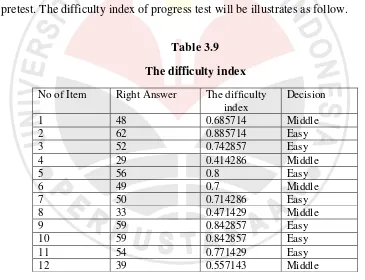
79 3.5.2.2The Difficulty Index of Progress test 1
The formula used in analyzing the difficulty index of progress-test is the same
as pretest. The difficulty index of progress test will be illustrates as follow.
Table 3.9
The difficulty index
No of Item Right Answer The difficulty index
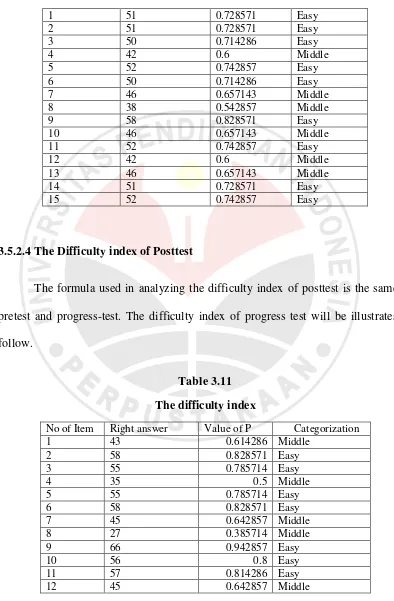
3.5.2.3The Difficulty index of Progress test 2
Table 3.10
The difficulty index
No of Item Right Answer The difficulty index
80
3.5.2.4The Difficulty index of Posttest
The formula used in analyzing the difficulty index of posttest is the same as
81
13 40 0.571429 Middle
14 44 0.628571 Middle
15 54 0.771429 Easy
3.5.2.5Discrimination index of Pretest
Generally, students who did well on the exam should select the correct answer
to any given item on the exam. The Discrimination Index distinguishes for each
item between the performance of students who did well on the exam and students
who did poorly. For each item, researcher subtracts the number of students in the
lower group who answered correctly from the number of students in the upper group
who answered correctly. The result will be divided by the number of students in one
group. The Discrimination Index is listed in decimal format and ranges between -1
and 1. The classification of discrimination index is based on Arikunto (2010:213)
0,0 - 0,20 : poor
0,20 – 0,40 : satisfactory
0,40 – 0,70 : good
0,70 – 1,00 : excellent
Based on the table on attachment (appendix…) the illustration will be as follows:
Table 3.12
Discrimination index
82
3.5.2.6Discrimination index of Progress test 1
Table 3.13
3.5.2.7Discrimination index of Progress test 2
Table 3.14
83
3.5.2.8Discrimination index of Posttest