Anatomy of a physics test: Validation of the physics items on the Texas Assessment of Knowledge
and Skills
Jill A. Marshall
Science and Mathematics Education, University of Texas at Austin, Austin, Texas 78712-0382, USA
Eric A. Hagedorn
Department of Physics, University of Texas at El Paso, El Paso, Texas 79968, USA
Jerry O’Connor
Physics/Engineering/Architecture, San Antonio College, 1300 San Pedro Avenue, San Antonio, Texas 78212, USA 共Received 29 July 2008; published 4 March 2009兲
We report the results of an analysis of the Texas Assessment of Knowledge and Skills共TAKS兲designed to determine whether the TAKS is a valid indicator of whether students know and can do physics at the level necessary for success in future coursework, STEM careers, and life in a technological society. We categorized science items from the 2003 and 2004 10th and 11th grade TAKS by content area共s兲covered, knowledge and skills required to select the correct answer, and overall quality. We also analyzed a 5000 student sample of item-level results from the 2004 11th grade exam, performing full-information factor analysis, calculating classical test indices, and determining each item’s response curve using item response theory. Triangulation of our results revealed strengths and weaknesses of the different methods of analysis. The TAKS was found to be only weakly indicative of physics preparation and we make recommendations for increasing the validity of standardized physics testing.
DOI:10.1103/PhysRevSTPER.5.010104 PACS number共s兲: 01.40.⫺d
I. INTRODUCTION
Beginning in 2003, the Texas Assessment of Knowledge and Skills共TAKS兲 for science has been administered annu-ally to 10th and 11th grade students in Texas. The test has very high stakes for students, who must pass the 11th grade 共exit-level兲test to graduate, and for schools, which risk sanc-tions based on their students’ passing rates. The TAKS is currently the only broadly administered standardized test covering physics in Texas. As such, it provides our best op-portunity to measure how well students in Texas understand and can “do” physics prior to high school graduation.
The science portion of the TAKS is designed to assess a subset of the Texas Essential Knowledge and Skills,1 the learning standards for Texas students. The process of design-ing the annual test begins with invitdesign-ing science educators in Texas to propose items. A commercial testing organization then creates a prospective set of items which are vetted by a large committee of educators both before they are field tested—a process in which some items are eliminated—and after field testing. The test items then undergo a content vali-dation review by a panel of recognized science experts. The Texas Education Agency 共TEA兲 considers this step to be critical at the high school level because of the “advanced level of the content being assessed.”2However, only a lim-ited number of physics experts are included in this review panel and its deliberations 共beyond the released items from the TAKS itself兲are not made public.
Despite this extensive review and development process, there were concerns prior to the first administration of the test about how valid a measure the science TAKS would be. First, the exam would be almost exclusively multiple choice, limiting its applicability as a practicum test of experimental
design and implementation. Second, it would cover multiple subject areas, sometimes more than a year after the students had engaged with them in course work. It was uncertain how well the items would assess physics knowledge or how the results might be used to inform instruction in physics classes. Finally, even within the content area of physics, the exam was limited to a subset of the standards for the introductory integrated physics and chemistry 共IPC兲 course. Some areas of physics, such as electricity and magnetism 共other than electric circuits兲, thermodynamics, optics, and vector rela-tionships of any kind, were not slated to be covered at all.
In January 2003 these concerns were raised at a confer-ence organized by the Texas Section of the American Asso-ciation of Physics Teachers共TSAAPT兲and the Texas Section of American Physical Society共TSAPS兲. TEA science direc-tor Chris Castillo Comer described the upcoming exam in a keynote address and invited additional input from the profes-sional physics community. In response, interested volunteers from the TSAAPT and TSAPS formed the Texas Physics Assessment Team 共TPAT兲, with the expressed purpose of performing an independent content validation review of TAKS’s physics and physical science items.
in addition to determining what TAKS results tell us about students’ knowledge and skills in physics, TPAT sought to evaluate whether students’ responses on the TAKS can tell us whether they know and can do physics at the level necessary for success in future coursework, careers, and life in a tech-nological society. To that end, we not only sought to deter-mine specifically what content areas the items covered and what knowledge and skills were required to answer them correctly, but also made a composite judgment about whether each item was a good indicator of physics preparation.
II. APPROACH
TPAT assessed the validity of the TAKS through two prin-cipal avenues: review of the items by physics content experts and statistical analysis of a large 共5000 student兲 random sample of item level responses. A third approach, interview-ing students about their responses to individual items, has been pursued to a very limited extent by team members, but a systematic study employing talk-aloud protocols in an in-terview situation remains to be done.
For the expert analysis, TPAT members first reviewed re-leased science items from the 2003 10th and 11th grade TAKS exams, for which TEA had released all the items. The science portion of the exam共biology, chemistry, and physics兲 comprised 55 questions. Subsequent to 2004, TEA has only released the items from the exams in alternating years. To date, only the 2003, 2004, and 2006 exams have been re-leased. Team members first evaluated each item with regard to the content area it covered. For items that were classified as either physics 共PH兲 or physical science 共PS兲, we made notes on the specific content focus of the question as follows: whether the question was clear and whether the answer choices were appropriate, what knowledge and skills were needed to answer the question, an overall impression of the value of the question, and any additional comments. Six team members, including physics and science education fac-ulty members from a variety of two- and four-year institu-tions, participated in the open-ended process.
The team then met and discussed the results of the indi-vidual evaluations and developed a composite evaluation and rubric for analyzing future tests. Team members used the rubric to analyze the 2004 10th and 11th grade exams indi-vidually and then met in the summer of 2004 to review and refine the rubric and develop a composite evaluation of the 2004 exams. A final pass was made of both years’ exams by a subset of the team using the refined rubric.
For the statistical analysis, TPAT obtained item responses from a random sample of 5000 students selected by the TEA from all the students who took the 2004 11th grade science TAKS, with student names removed. Notably, over 12%共630 tests兲were entirely blank. Some were blank because, in order to preserve students’ privacy, TEA is required to remove the data pertaining to any student from a demographic group small enough to make individual identification possible. This process is known as “masking” and it was applied to 3.3% of the 5000 exams. The other 9.3% missing were presumably absences, students who became ill during the test, or students who did not answer any items.
The blank tests were omitted from the analyses. The re-mainder was subjected to a suitable type of factor analysis, as well as item analysis, both classical and using item re-sponse theory, or IRT共discussed in more detail below兲.
A. Content coverage
Our primary mechanism for determining the content ad-dressed by each item was the face-value evaluation by TPAT members. In our final round of coding, we categorized each item as PH, PS, chemistry共CH兲, meteorology 共MET兲, geol-ogy共GEO兲, biology共BIO兲, nature of science or experimental design 共NOS兲, or data analysis 共DAT兲. Some items in the final category were also classified as PH or PS. Additionally, the PH and PS items were classified according to the subcat-egory with the discipline共i.e., energy, motion, work, forces, waves, electric circuits, etc.兲. PH and PS items were also classified as LAB共laboratory safety, laboratory procedure, or measurement skills兲where appropriate.
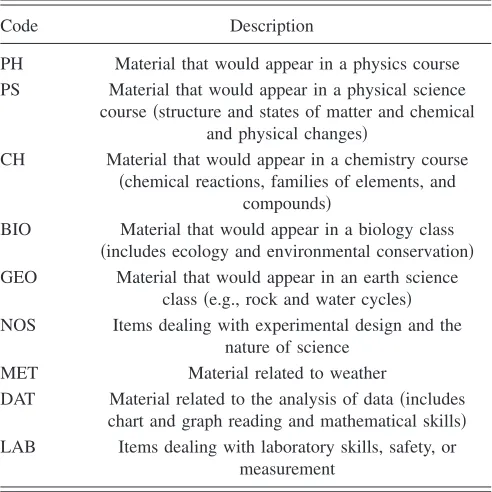
TableIdescribes each of these codes. The codes are not mutually exclusive in all cases. For example, some materials that would be taught in a physics class might also appear at a more basic level in a physical science class. Likewise there is some overlap between introductory physics and chemistry classes; characteristics of the periodic table, for example, ap-pear in both.
The final round of independent coding resulted in greater than 80% agreement between reviewers for item content classification. Differences were due either to “double classi-fication” items, where an item dealt with, for example, data analysis in a physics context, material共primarily with regard to the periodic table兲 that might appear in a chemistry or physics class, or items that dealt with laboratory skills that TABLE I. Codes resulting from the primary round of open cod-ing for the content area of items from the 2003 and 2004 TAKS administration.
Code Description
PH Material that would appear in a physics course PS Material that would appear in a physical science
course共structure and states of matter and chemical and physical changes兲
CH Material that would appear in a chemistry course 共chemical reactions, families of elements, and
compounds兲
BIO Material that would appear in a biology class 共includes ecology and environmental conservation兲 GEO Material that would appear in an earth science
class共e.g., rock and water cycles兲 NOS Items dealing with experimental design and the
nature of science MET Material related to weather
DAT Material related to the analysis of data共includes chart and graph reading and mathematical skills兲 LAB Items dealing with laboratory skills, safety, or
might apply equally well to multiple areas共the ability to read the volume of a liquid in a cylinder or measure the length of a line for example兲. All discrepancies were discussed and resolved. At the end, the team decided to retain LAB as a subclassification of other disciplines but to use DAT as a major classification.
The statistical analysis provided another perspective on content coverage. In the expert analysis, TPAT team mem-bers evaluated the content covered by each item according to its face value as seen by physics experts. In the statistical analysis, we used a factor analysis of the student response data to determine which of the items seemed to be related to each other, considering only the student responses to each item.
Factor analysis is analogous to determining eigenvectors or basis states. This methodology has been used, notably, to analyze the Force Concept Inventory.4The analysis identifies items that appear to be related to each other and associates them with “factors” in explaining student results. On the TAKS, for example, one might see factors related to the dif-ferent content areas of the exam, i.e., biology, chemistry, and physics, possibly subdividing into different content objec-tives such as force and motion, energy transformation, and so on. Alternatively, items might cluster into factors represent-ing knowledge of memorized facts as opposed to those that required logical reasoning, conceptual understanding, or mathematical calculation. Often, however, test makers strive to achieve a test that is unidimensional, that is, one where all items align with one factor representing the generic ability of interest. If the test is designed such that it primarily probes an ability such as logical thinking or reading skills that is acquired over a span of years and likely developed both within and outside the school, results may provide little in-formation about what students have learned from the instruc-tion received on a specific topic.
In our analysis, we employed full-information factor analysis共FIFA兲,5which extends traditional factor analysis to cases in which item difficulties are not uniform and ad-dresses issues that arise in other methods applied to cases of dichotomously scored results.6This method is based on item response theory 共IRT兲 共discussed below兲 and does not use interitem correlation coefficients. The software used to carry out the full-information item factor analyses in this study wasTESTFACT, version 4.7
The approach to determining test dimensionality can be either exploratory or confirmatory. This study presents re-sults from both approaches. The exploratory methodology of FIFA is a bit different from traditional exploratory factor analysis 共such as choosing factors with eigenvalues greater than 1 or examining a scree plot兲. Using FIFA, one must choose a specific number of factors, beginning with 1, and monitor the changes in chi square as subsequent factors are added. Although there are better and far more sophisticated methods of assessing the contributions of additional factors in dimensionality assessment,8these were beyond the scope of our study.
The confirmatory analysis done in this study uses the “bi-factor” command available in TESTFACT, version 4. This command requests “full-information estimation of loadings on a general factor in the presence of item-group factors.”6
The item-group factors to be tested are based on the classi-fications assigned by TPAT members, i.e., physics-related versus nonphysics-related 共chemistry and biology兲 items. The “bifactor” routine allows for the inclusion of probabili-ties of chance success on items共guessing兲. In our case, we estimated this pseudochance parameter using a three-parameter logistic model. The pseudochance three-parameter is an attempt to estimate performance共percent probability of get-ting an item correct兲at the low-ability end of the spectrum. Because students of lower ability will often guess, this pa-rameter is sometimes 共inappropriately兲 called the guessing parameter. “Guessing” is not an accurate way to describe these parameters because they are often, in fact, less than the likelihood of randomly guessing. The three-parameter logis-tic model is described in detail in Sec.II C.
B. Knowledge and skills needed for correct response
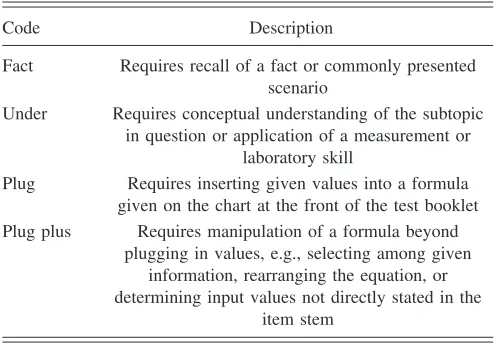
As part of the expert analysis, the TPAT team classified items previously categorized as physics and physical science according to the knowledge and skills needed to answer them. Codes that were used are given in TableII. In this case there was agreement 80% of the time. Disagreement was primarily due to double assignments, i.e., questions that could be answered based on a conceptual understanding or based on memory of a commonly presented fact or scenario, and all discrepancies were discussed and resolved to deter-mine a final rating.
Our statistical analysis addressed this issue by deriving classical test indices共difficulty and point-biserial correlation兲 for each item. These analyses were complementary to the expert analysis in that they did not characterize items accord-ing to thespecificknowledge and skills required for a correct response共i.e., memorized fact versus conceptual understand-ing兲, but rather according to thelevelof knowledge and skills required.
Classical item difficulty analysis provides insight into how difficult a group of examinees found a particular item. Item difficulty is simply 1 minus the ratio of correct re-sponses to total rere-sponses for a given item. Finally, the point-TABLE II. Codes resulting from the primary round of open coding for the knowledge or skills needed to answer physics and physical science items on the TAKS.
Code Description
Fact Requires recall of a fact or commonly presented scenario
Under Requires conceptual understanding of the subtopic in question or application of a measurement or
laboratory skill
Plug Requires inserting given values into a formula given on the chart at the front of the test booklet Plug plus Requires manipulation of a formula beyond
plugging in values, e.g., selecting among given information, rearranging the equation, or determining input values not directly stated in the
biserial correlation is the Pearson correlation between a di-chotomously scored 共right/wrong兲 item and the total test score共includes all items兲. As such, it provides insight into how well success on an item predicts success on the entire test and provides a measure of item discrimination. The higher the point-biserial correlation, the better an item differ-entiates between examinees with high and low levels of the measured ability. We felt that the classical item indices could provide a valuable added dimension to the expert character-izations for comparison between items, despite its limitation of being “group dependent.”9Group dependency is the rela-tionship between item difficulty and the abilities of the ex-aminees. If one group of examinees is weaker than the other, the items appear more difficult to the weaker group共and will be indicated as such in the classical item statistics兲and vice versa.
C. Item quality
The TPAT experts first rated all items that were classified as physics or physical science共PH or PS兲according to the availability of a correct answer among the response choices. Codes that were used to rate individual items in this respect included A共single correct answer兲, AA共correct answer that can be chosen with one or more assumptions兲, MA 共more than one correct answer兲, and NA 共no acceptable answer listed among the choices兲. The percent agreement for the final round of question quality evaluation was extremely high共over 95%兲 with regard to rating the availability of a single correct answer.
Next, the TPAT coding team assigned an overall judgment of quality to each of the PH and PS items. Codes that were used to rate overall question quality are given in TableIII. Agreement for this aspect of the coding was over 70%, which is high given the subjective nature of the codes. There were very few cases in which ratings spanned more than two categories, and these were discussed and a consensus ob-tained. For other items, a composite of the individual ratings was used as the final rating. Raters rarely used the “excel-lent” rating, indicating considerable room for improvement. On the other hand, the only code for which there was
uni-form agreement was the “bad” classification. Any item which was coded as “bad” by any reviewer was coded that way by all, indicating that this is a meaningful, if rarely used, code. Our statistical approach to item quality employed IRT to characterize individual items. This approach uses the entire data set of student responses共to the item under consideration as well as all the others兲to evaluate the quality of a particular item: the likelihood that it can be answered by guessing, the difficulty of the item, and its ability to discriminate between those possessing the trait the item is designed to test共in this case, knowledge and skills in physics兲and those who do not. Item response theory, albeit in a simplified form, has also been used to evaluate the Force Concept Inventory.10 This technique, which Morriset al.10 seem to have developed in-dependently, is called “item-observed score regression” in earlier work.11 In analyzing the Force Concept Inventory 共FCI兲, Morriset al.simply created “item response curves” by plotting the cumulative percentage of students who selected a given response versus a given total score in the test. In this representation, the curves for correct responses will necessar-ily reachy values of 100% atxvalues which correspond to the maximum score on the entire test. Curves for incorrect responses will reach 0% at the maximum score. In other words, to have a perfect score, students must have selected the correct response for any given item.
A more sophisticated item response analysis, on the other hand, creates a single response curve for each item 共as op-posed to each possible response兲, in which the probability of achieving a correct response is plotted against , an esti-mated parameter measuring ability within the specified do-main, and not the simple raw score. For the TPAT analysis, we fit the student responses to each item to a three-parameter logistic model in which the cumulative probability of a cor-rect response to a given item as a function of ability is given by
TABLE III. Descriptions of codes used to assign an overall rat-ing to each physics and physical science item on the TAKS.
Code Description
Excellent An outstanding question that should be used as a model
Good A good question that measures what it should without issues
OK A reasonable question without “show stopper” issues but not the best it could be for some reason,
poor wording, for example
Poor Question has serious problems but still valuable in some respect
Bad Question is unacceptable and should not have been used共includes questions for which the answer indicated is wrong regardless of assumptions兲
P共兲=c+共1 −c兲/关1 + exp共− 1.7a共−b兲兲兴, 共1兲
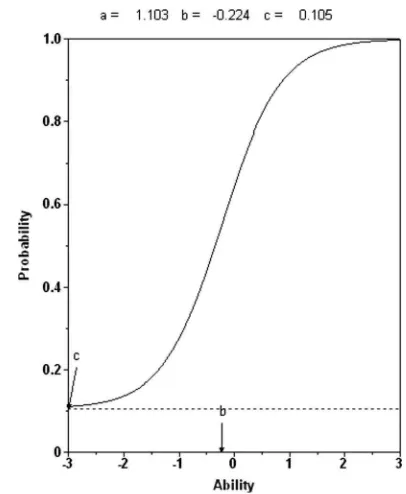
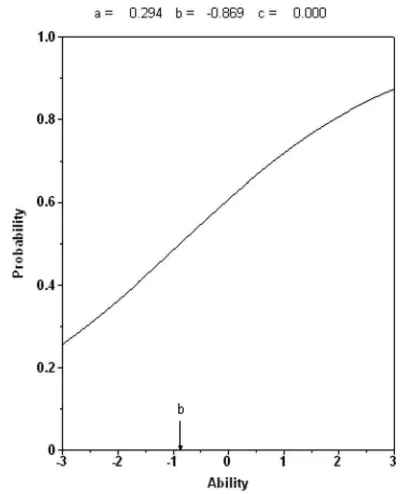
where “a” is the item discrimination共the slope of the curve at “b”兲, “b” is the ability level corresponding to the probabil-ity half way between the minimum and the maximum 共 re-lated to the difficulty of the item兲, “c” is the pseudochance parameter共giving the probability of correctly answering an item by guessing兲, and is a measure of ability level.12 Fig-ure1shows a plot of the fitted probability function vsfor item 45 of the 2004 11th grade science TAKS.13 For this item, the minimum fitted probability of correctly answering this item is 0.105 and the maximum共cumulative兲probability is 1.0. The ability level corresponding to the cumulative probability half way between these two values共indicated on the graph as “b”兲 is −0.224 or very nearly zero. The item discrimination “a” is the slope of the curve at “b” or 1.103 in this case. Finally, the pseudochance parameter “c” is given by the value asymptotically approached by the curve where it intercepts theyaxis or 0.105 for this item.
The estimation software we used 共MULTILOG, version 7.03兲 employs a marginal maximum-likelihood algorithm that assumes the underlying ability distribution to be nor-mally distributed. As parameter identification constraints, the mean and standard deviation 共SD兲 of the distribution are typically constrained to be 0 and 1, respectively. This typi-cally leads to ability estimates共in logits兲 ranging from −3 共low ability兲to +3 共high ability兲. The probability of getting an item right is equal to the probability of guessing plus a fraction of the remaining probability. For a given item, the higher the value of “a”共steeper the slope of the characteristic curve兲, the better the item discriminates between students who have and have not acquired the knowledge and skills necessary to get a correct answer.
It is important to note two assumptions of IRT models such as this one:共1兲unidimensionality and共2兲local dence. Local independence implies that items are indepen-dent of one another at a given level of ability and are only
related through ability when considering different levels. Unidimensionality implies that the items are measuring one ability. An example of unidimensionality that is being vio-lated would be a mathematics test that had items which were highly dependent on reading level. In the context of the whole TAKS test, the hypothesized latent variable ability might be called “science ability.” In the context of just the physics items, the latent variable might be called “physics ability.”
III. RESULTS
A. Content coverage
The TPAT team found good coverage of the targeted con-cepts for physics and physical science in the tests at both grade levels for both years. It is important to remember, however, that these represent only a subset of the knowledge base associated with physics. TableIVshows the numbers of items in each identified content area at each grade level for each year, with the exception of MET and GEO which had a combined total of one identified item each year. The distri-bution shown in TableIVis fitting given that students taking tests in the 10th grade will probably either have taken or be enrolled in IPC and biology, and students in the 11th grade will usually have taken both and be currently enrolled in chemistry.
The combined number of items dealing strictly with the nature of science or experimental design and data analysis remained essentially the same at both grade levels over the 2 years. Likewise, a significant number of problems dealt with laboratory safety or skills. Again, this coverage is appropri-ate, given the emphasis placed on these skills in the Texas state standards 关the Texas Essential Knowledge and Skills 共TEKS兲兴and especially considering the difficulty of design-ing multiple choice items to assess these skills, all of which are more appropriately tested in open-ended or practicum situations.
TABLE IV. Number of items with each content area code by year and grade level. Items classified as LAB also received a content area classification.
PH PS BIO CH NOS DAT LAB Total
2003 10th 9共16%兲 5共9%兲 24共41%兲 7共12%兲 7共12%兲 2共3%兲 4共7%兲 58 2003 11th 14共24%兲 6共10%兲 16共27%兲 6共10%兲 7共12%兲 6共10%兲 4共7%兲 59 2004 10th 12共20%兲 5共8%兲 24共40%兲 7共12%兲 4共7%兲 3共5%兲 5共8%兲 60 2004 11th 13共23%兲 6共10%兲 16共28%兲 10共18%兲 4共7%兲 5共9%兲 3共5%兲 57
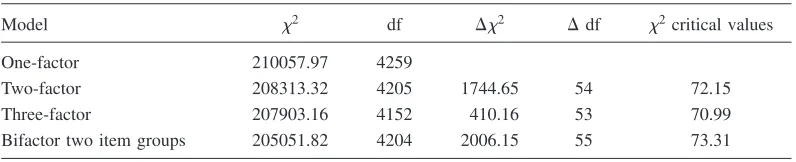
TABLE V. Comparisons between one-, two-, and three-factor models and a bifactor model with guess estimates.
Model 2 df ⌬2 ⌬df 2critical values
One-factor 210057.97 4259
Two-factor 208313.32 4205 1744.65 54 72.15
Three-factor 207903.16 4152 410.16 53 70.99
In regard to questions that required conceptual under-standing or application of a formula, our designations gener-ally agreed with those assigned by TEA to these items, but there was a surprising number of disagreements in specific cases. For example, item 6 asked students to select the best procedure for determining the density of a rock.13The TPAT experts placed this item firmly in the physical science cat-egory. TEA classified this as a biology question because it satisfied one of the TAKS objectives from the biology course, i.e., that students should be able to “plan and imple-ment investigative procedures including asking questions, formulating testable hypotheses, and selecting equipment and technology.”14Although this is also an objective for the IPC course 共and the portion of the TAKS related to IPC兲, classifying it as a biology item allowed it to contribute to the mandated percentage of biology items on the test.
There was also frequent disagreement on problems that we had classified as covering physics or physical science but also involving data analysis or laboratory skills.Everyitem in the 2004 exit-level exam that we classified as a physics question requiring data analysis was classified by TEA as a biology item, satisfying the biology objective that students will “organize, evaluate, make inferences, and predict trends from data”共also an IPC objective.兲. Items that we classified as physics or physical science items involving laboratory skills were also classified by TEA as biology items in all but one case.
For example, item 5 provided students with a data table relating the force on a spring to the change in its length and asked them to extrapolate from the given data to predict how far the spring would be stretched with 3.92 N of force ap-plied to it. Although item 5 could possibly be solved by the exclusive application of mathematical共proportional兲 reason-ing, with no knowledge of the behavior of springs, the con-text involved certainly relates to physics. Hooke’s law is covered in most introductory physics courses, and the linear relationship between the applied force and the deformation is a critical foundation for analyzing an entire class of prob-lems. Still, TEA was able to classify it as a biology item because it met the biology standard for data interpretation noted above 共although not, arguably, in the context of biol-ogy.兲
From the statistical side, we addressed the issue of item classification with factor analysis. In our exploratory full-information factor analysis,6 a single extracted factor ex-plained 20.3% of the variance in the item response data共see
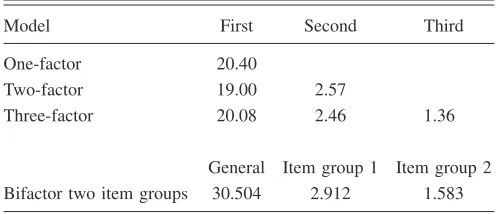
TableVI兲. An added second factor decreased the chi-squared value by 1678, which for 54 degrees of freedom共number of items minus 1兲 is significant, and implies a substantive im-provement. Adding a third factor decreased the chi square by 402, which for 53 degrees of freedom is also significant. See Table V for the model comparisons and Table VI for the amounts of variance explained by each of the factors. When using full-information factor analysis, one chooses the num-ber of factors in the model using this chi-square methodol-ogy. One does not use an a priori selection law such as eigenvalues greater than 1 or an empirical selection rule such as examining a scree plot. The extracted factors were then Promax rotated.
The data in TablesVandVIindicate that one factor, most likely what might be labeled “generic test-taking ability,” accounts for the largest identified portion of the variance in the students’ responses for all three models. In trying to de-termine what the other factors might represent, we examined how each of the items “loads” onto the additional 共second and third兲factors.
In the two-factor model, only two items load on the sec-ond factor: items 23 and 38. Item 23 refers to determining the formula for aluminum sulfate from ionic charge charac-teristics and item 38 similarly for calcium chloride. Two other items, 32 and 29, cross load, meaning they load on both the first and second factors. Item 32 requires students to identify the chemical equation which supports the law of conservation of mass and item 29 requires describing the mass of the products in a reaction in which CaCO3is heated. The three-factor model is empirically the most justifiable. In it, 25 items load on the primary factor and 21 items load on the third factor. Only two items, items 23 and 38, load on the second factor. The remaining seven items cross load on more than one factor. To better interpret what factors 1 and 3 might mean, the six highest loading items on each of these two factors were identified. All six of the items loading on the first factor were factual questions or questions requiring some reasoning in addition to knowing the facts. These ques-tions were entirely verbal—no pictures and no numerical in-formation. The six items loading on the third factor were all quantitative questions requiring numerical reasoning from tabulated or graphed data or actual calculation. Again, the second factor is clearly related to chemical reactions.
The confirmatory factor analysis, using the “bifactor” command, conclusively disproved that the item responses fit to factors specifically relating to physics, chemistry, or biol-ogy. This is entirely consistent with the exploratory factor analysis.
B. Knowledge and skills needed for a correct response
Table VII lists the numbers of PS and PH items 共 com-TABLE VI. Variance explained by each factor in one-, two-, and
three-factor models and a bifactor model with guess estimates, respectively.
Model First Second Third
One-factor 20.40
Two-factor 19.00 2.57
Three-factor 20.08 2.46 1.36
General Item group 1 Item group 2 Bifactor two item groups 30.504 2.912 1.583
TABLE VII. Numbers of physics and physical science items with each knowledge or skills code by year and grade level.
Fact Under Plug Plug plus
2003 10th 1 7 6
2003 11th 2 13 3 2
2004 10th 3 9 1 4
bined兲that were assigned to each of the codes used to clas-sify the skills and knowledge needed to respond correctly to a given item. From the perspective of classical item statistics, the item difficulties we calculated ranged from 0.561 to 0.125, indicating that the items ranged from fairly easy to only moderately difficult. An examination with a wider range of difficulties would clearly be more useful in evaluating student preparation for pursuits beyond high school. In this analysis, item 8共identify the predominant heat transfer pro-cess during the lunar day兲stood out because it had a point-biserial correlation coefficient of below 0.20, which is sig-nificantly below all the others. This coefficient indicates that getting the correct response on this question was not signifi-cantly correlated with overall test score. This item also dis-played an anomalous item response curve, indicating that the probability of a correct response did not vary from guessing except at the very high end of the ability range.
Three of the four items that we found to have the lowest classical item difficulties also had noticeably low “b” values when we fitted their item response curves to the three-parameter logistic model given in Eq. 共1兲, which is to be expected. Only one of the four items with the highest difficulty—item 36, a biology item that dealt with heredity— also had a significantly high “b” parameter, indicating diffi-culty in its item response curve. Keep in mind that classical item difficulty is directly related to how many respondents missed the item. The “b” parameter is an estimate of the ability level required to have a 50% chance of getting an item correct. As such, it is not simply and directly related to the number of respondents missing the item. Biology items were equally represented among the hard and easy questions, but no physics or physical science items were among the hardest, limiting what the test can tell us about students’ preparation in physics.
C. Item quality
TableVIIIshows the numbers of items that received each
answer rating 共A for a unique correct answer, AA for a unique correct answer with some assumptions, MA for mul-tiple correct answers, and NA for no acceptable answer兲 at each grade level for each year. The TPAT team almost always agreed that there was only one correct answer among the choices offered. Only one item was found with multiple clearly correct responses from which it was not possible to select a best response, even with assumptions. Likewise, only one item was identified with no acceptable answer. In a few cases, some assumptions were required to select the best option among several possibly correct responses. For ex-ample, one item from the 2004 11th grade exam showed a Bunsen burner heating a liquid in a beaker supported by a ring stand. The stem for the problem stated that “all of these procedures must be followed when using the setup shown above except….” Three of the four procedures 共putting on safety goggles, handling the beaker with tongs, and securing loose clothing兲are mandated by safety requirements in Texas chemistry classes. The fourth option, wearing rubber gloves, is also required when toxic materials are present. Thus, iden-tifying the use of rubber gloves as an optional procedure required the assumption that the liquid was not toxic. This is not generally a reasonable assumption in a chemistry labora-tory.
TableIXlists the numbers of items that fell in each over-all rating bin. Items that received two different ratings appear in the split category bins, with the category receiving the TABLE VIII. Numbers of physics and physical science items
with each answer classification code by year and grade level.
A AA MA NA
2003 10th 13 1
2003 11th 17 1 1 1
2004 10th 16 1
2004 11th 15 4
TABLE IX. Numbers of physics and physical science items receiving each overall rating共or combination thereof兲for each grade level in each year.
B P OK/P OK OK/G G/OK G G/E
2003 10th 1 6 5 2
2003 11th 2 1 1 4 7 4 1
2004 10th 1 4 9 1 2
2004 11th 3 2 4 4 4 2
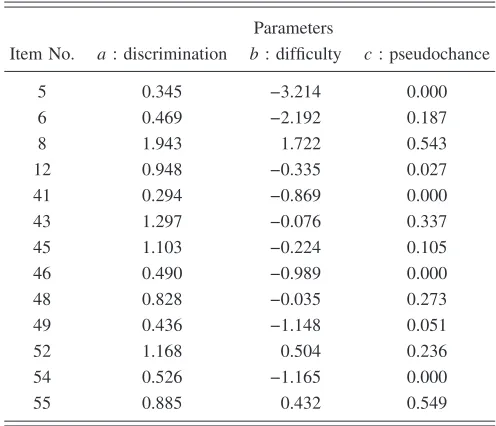
TABLE X. IRT parameter estimates for physics items from the 2004 11th grade TAKS.
Parameters
Item No. a: discrimination b: difficulty c: pseudochance
5 0.345 −3.214 0.000
6 0.469 −2.192 0.187
8 1.943 1.722 0.543
12 0.948 −0.335 0.027
41 0.294 −0.869 0.000
43 1.297 −0.076 0.337
45 1.103 −0.224 0.105
46 0.490 −0.989 0.000
48 0.828 −0.035 0.273
49 0.436 −1.148 0.051
52 1.168 0.504 0.236
54 0.526 −1.165 0.000
highest number of ratings leading. For example, an item that received more “good” ratings than “OK” ratings is counted in the “good/OK” column.
As is reflected in TableIX, the median item rating for the 10th grade test fell in the “good/OK” category for both 2003 and 2004, although the mode score moved from “OK/good” to “good/OK” in the second year. Note that TableVII indi-cates a shift from “plug and chug” items to items requiring conceptual understanding. There was improvement on the 11th grade exam also from 2003 to 2004 insofar as the num-ber of bad and poor items was reduced to zero. The median score at this level also approached the “good/OK” category in 2004, up from “OK” in 2003.
Item response analysis fitting the physics items only to a three-parameter logistic model as described above yielded the values listed in Table X. Recall that the specific IRT model being employed in this analysis assumes that the abil-ity being measured, in this case presumably physics prepara-tion,is unidimensional. Results for the items varied consid-erably, but the majority of the items had “a” values 共discrimination indices兲lower than 1.0, the lowest being 0.27 for item 41, indicating that the probability of getting this item right varied very little with the ability parameter.
Seven items had “a” values above 0.9, indicating a rea-sonably high value for the slope of the item response curve at the ability level with the median probability of getting the item right. In most cases, the TPAT experts supported this assessment, giving these items high overall ratings. We con-curred with the IRT analysis that these were good items on which to judge student preparation. In two of the high “a” cases, however, the TPAT ratings did not align with the IRT results.
The first of these, item 45, asked students to select one advantage that “wind energy has over energy generated from solar cells.” As discussed above, Fig.1 shows the item re-sponse curve generated for this item. TPAT experts did not feel that the answer designated as correct, i.e., “that wind energy can be generated at night,” was useful in separating students who were ready to do physics from those who were not. It required only the knowledge that solar energy requires sunlight and thus cannot be generated at night. This basically amounted to understanding the meaning of the term “solar.” Although knowledge of such terms, and other common sense knowledge, is indeed a component of readiness to do and use physics beyond the high school level, it is not likely to have been acquired in high school physics classes. Therefore such items tell us little about the quality of instruction.
Nevertheless, the IRT analysis identified this item as hav-ing a fairly high ability to discriminate among students. Even though the “a” parameter was only 1.10, it was still in the third highest of the items in this regard. Preliminary student interview results indicate that items such as this did not throw well-prepared students off because they knew not to “overthink” them. On the other hand, some students who scored lower on the test overall are likely to have been mis-led by the distractors in this case共and perhaps unfairly兲. This item had been close to the median difficulty for the entire test, belying the ease with which students should have been able to identify the ability to generate wind energy at night as a correct answer.
The TPAT team actually disagreed with the IRT analysis in more of the cases in which the latter indicated that the items did not discriminate according to ability parameter, i.e., those with low “a” values. For example, the TPAT team rated item 41 as a good indicator of physics conceptual un-derstanding. It asks students to identify “the action-reaction force pair when the space shuttle lifts off from the launch pad.” Problems involving Newton’s third law are notoriously difficult for students,15but a robust conceptual understanding makes identification of action-reaction pairs straightforward, if not trivial. If the TPAT experts were correct in indicating that selecting the correct answer required significant concep-tual understanding, then this problem should have had a much higher discrimination value. The “a” parameter for this item was only 0.294共see Fig.2兲. A closer examination of the distractors for this item reveals a likely reason why this was not the case. Of the four possibilities, the correct answer was the only one that mentioned apair of items; the others all listed at least three agents. Since the problem asked for the force pair, only minimal logical, rather than a deep under-standing of physics, was required to select the correct re-sponse.
IV. DISCUSSION
A. Content coverage
since the test was designed to cover the standards for the IPC course, which did not include these areas. On the other hand, there were instances in which TEA characterized what we considered to be physics or physical science items as biol-ogy, most likely in order to meet requirements for the per-centage of biology items on the test. This practice obscures student results on the test with regard to physics.
Our statistical analysis also indicates that using TAKS re-sults to inform instruction in physics and physical science may be problematic. In the factor analysis results for the three-factor model, the IPC-related items are generally indis-tinguishable from biology-related items. Items which were factual or verbal load on the primary factor and those which were quantitative load on the third factor. These two factors are analogous to what Nussbaumet al.16 called “basic sci-ence and reasoning” and “quantitative scisci-ence” from their factor analysis of over 7000 cases from the 12th grade sci-ence exam in the National Educational Longitudinal Study of 1988.
The second factor in the three-factor model, accounting for much less of the variance, is probably associated with very specific knowledge and skills related to balancing chemical reactions, particularly knowledge and application of typical ionic charges. Even high-ability students with good test-taking skills are unlikely to be able to answer ques-tions such as these without specific preparation. The 2004 exit-level test data indicate a difference in students’ knowl-edge and skills in this area versus a composite of all other areas of science combined.
This is not surprising as students are not likely to have experienced instruction in this area until 9th or 10th grade when they take the IPC course 共as opposed to other areas such as motion and properties of matter, which are likely to have been covered in earlier grades兲. Further, this topic is typically among the last covered in the IPC course, increas-ing the probability that teachers will not be able to spend as much time on it as on earlier topics. Thus, the test results tell us something about how we are teaching chemistry, but it is not clear from the exploratory factor analysis that they tell us much about how we are teaching physics.
B. Knowledge and skills
TPAT found that the majority of the physics and physical science problems at each grade level for both years required a conceptual understanding of the subject matter. It is un-likely that students would have been able to memorize an answer or procedure to address these problems unless they had been presented with and drilled extensively on essen-tially identical problems. This speaks against the likelihood that test drilling would significantly influence scores on these items, unless conceptual understanding is improved as a con-sequence, and speaks well for the test’s ability to judge preparation in physics and physical science.
On the other hand, the TPAT team found the number of problems that required nothing more than plugging values into a formula that was listed in the test booklet to be unac-ceptably high. Although being able to calculate values in such a fashion is a skill necessary for physics and physical
science, and indeed one with many applications in daily life, devoting so many items to test this skill seems excessive. Further, it is more common to have to find values for an equation from more than one source, or to rearrange an equa-tion to isolate a desired variable. Thus, it is more likely that real-life situations will require skills that would be classified as “plug plus.”
After its initial evaluation of the 2003 exams, TPAT sent a letter to TEA expressing concerns over the large number of “plug” questions, particularly at the 10th grade level. The team felt that the notable reduction in “plug” items in 2004, and the accompanying shift toward “plug plus” items, was merited in terms of representing the kinds of skills likely to be necessary in future coursework as well as applications in work and life situations.
C. Quality
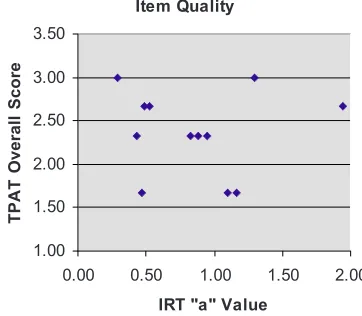
Figure 3 shows the TPAT expert ratings for the physics items on the 2004 exit-level test plotted against the IRT “a” parameter, i.e., the discrimination value, for each item. It shows that there is no clear correlation between the two. One possible explanation for this lack of correlation is the fact that the expert ratings and the IRT results are actually mea-suring different things. IRT analyses are based on a single hypothetical “ability” that is being tested and that the stu-dents possess. This ability is supposed to be unidimensional, as are the test items. This hypothetical ability is so abstract that it is referred to as a latent variable, and all the calcula-tions and estimacalcula-tions used to derive IRT curves are based on the existence of this hypothetical unidimensional ability. In particular, the item discrimination parameters are calculated with respect to ability parameter共兲. The hypothesized “abil-ity” is probably a combination of logical thinking共related to test-taking strategies兲 reading ability, mathematical ability, and familiarity with vocabulary and conventions, in addition to conceptual understanding. The results of the three-factor analysis tend to support a claim of unidimensionality. The first factor accounted for 20% of the variance in scores and
Item Quality
0.00 0.50 1.00 1.50 2.00
IRT "a" Value
seemed strongly related to knowledge of facts and verbal reasoning. While the third factor clearly related to quantita-tive abilities, it only accounted for 1.4% of the variance. Nevertheless, the IRT analyses were based on a single hypo-thetical ability that clearly included verbal and quantitative reasoning.
In contrast, TPAT expected physics expertise to be multi-dimensional. As described earlier, we felt that logical ability 共parsing the information necessary for “plug plus” problems for example兲, mathematical ability 共the ability to solve “plug” problems for example兲, and familiarity with facts and vocabulary共problems we labeled as “fact”兲 were all impor-tant in addition to conceptual understanding; some items would test some aspects and other items complementary as-pects. Our analysis did not require that any given item ad-dresses all these abilities.
V. CONCLUSIONS AND IMPLICATIONS
Is the TAKS a valid indicator of who is prepared to “do” physics in future coursework, in the course of employment, and in making the decisions required of citizens in a techno-logical society? Our analyses show that this assessment is valid only in a very limited sense.
Our experts felt that the test did cover the designated con-tent to an appropriate excon-tent; however, the factor analyses indicate that the exam appeared primarily to measure generic testing ability共including reading skill兲, a specific chemistry skill 共chemical equation balancing relating to ion charge兲, and basic quantitative skills共simple calculations, basic graph interpretation, and making inferences from tabulated numeri-cal data兲. How students perform on the problems identified as addressing a specific content area, in conjunction with the traditional item difficulty level, tells you something about how the students were prepared in this area. The problem identification by content area did not always correspond to the designation provided by TEA. In fact, the distinctions used by TEA, in relation to the TEKS, would serve to con-fuse teachers who are interested in evaluating student perfor-mance in biology, chemistry, or physics.
These findings point to a need for a more narrowly fo-cused test, i.e., one that just covers physics versus one that covers chemistry or biology as well. The state of Texas is, in fact, moving in this direction. Beginning in 2009, the state will pilot a physics “end of course” exam that will cover only the material from the physics course. Composite scores on a series of such exams will eventually replace the TAKS as a graduation requirement. Although everyone is reluctant to dedicate even more time and funding to the testing enter-prise, our analyses indicate that this is a move in the right direction. The results of the TAKS do not appear to inform instruction in physics, or any other course, with the possible exception of chemistry.
With regard to knowledge and skills, the expert analysis of the 2003 tests found them to focus too heavily on items that required rote application of formulas; in the 2004 tests we saw a welcome shift toward items that required more complex problem-solving skills and conceptual understand-ing. We would argue for a thorough analysis of future tests of
the kind done by our expert team to ensure appropriate dis-tribution of items requiring the various competencies that comprise preparation for doing science.
Although TPAT took issue with a significant number of the items, we felt that the overall quality of the items ranked solidly between “OK” and “good”—a passing grade if you will, if not an exceptional one. The statistical analysis, how-ever, showed us that the students were not necessarily always responding to the items in a manner that correlated with our evaluations. Problems that we thought should be able to dis-criminate between those who knew physics and those who did not were not necessarily helpful in that regard.
In some cases, the design of the problem itself, especially the attractiveness of the distractors, may have been at fault. If the intent of a test is to learn as much as possible about students’ understanding, then distractors should be designed expressly to align with common misconceptions, as was the intent with the Force Concept Inventory. Distractors that can be easily eliminated by common sense reinforce the likeli-hood that students with high generic test-taking ability will select the right answers, whereas those without it will not. Thus, the items discriminate on that basis rather than on preparation in physics.
In Texas, and elsewhere, IRT curves have been used to select among field-tested items, as well as to evaluate results posthoc. Our results imply that items should not necessarily be selected on the basis of their IRT curves alone, without careful regard to the abilities being assessed. The measure-ment instrumeasure-ment in question here, the TAKS test, is not a finely tuned unidimensional instrument with regard to phys-ics: it is not a thermometer. We are measuring something more complex than temperature, but the IRT analytical model assumes that we are measuring something as clearly defined as temperature with a device as precise as a ther-mometer.
At a minimum, IRT results should be evaluated in light of the expert knowledge in the field, as well as with regard to common student misunderstandings and test-taking strate-gies. Such an evaluation requires both expert analysis and detailed student interviews. Students use a variety of strate-gies, not necessarily involving mathematics knowledge, to select their answers on the mathematics portion of the TAKS,17and it is very likely that they might employ similar strategies in response to the science TAKS. Careful design of items might help to preclude that possibility. A wider variety of items are planned for the physics end-of-course exam in Texas, including some requiring actual simulation of experi-ments, and others requiring more complex problem solving than possible in the TAKS format. Our results suggest that this is also a move in the right direction.
ACKNOWLEDGMENTS
1http://www.tea.state.tx.us/rules/tac/chapter112/index.html 2Texas Education Agency, TAKS Information Booklet, Science,
Grade 10 共TEA, Austin, TX, 2004兲, p. 2; http:// ritter.tea.state.tx.us/student.assessment/taks/booklets/science/ g10.pdf
3S. Messick, inEducational Measurement, 3rd ed., edited by R. L.
Linn 共American Council on Education and Macmillan, New York, NY, 1989兲, p. 13.
4D. Huffman and P. Heller, What does the Force Concept
Inven-tory actually measure?, Phys. Teach. 33, 138共1995兲.
5R. D. Bock and M. Aitkin, Marginal maximum likelihood
estima-tion of item parameters: Applicaestima-tion of an EM algorithm, Psy-chometrika 46, 443共1981兲.
6R. D. Bock, R. Gibbons, and E. Muraki, Full information item
factor analysis, Appl. Psychol. Meas. 12, 261 共1988兲; C. L. Hulin, F. Drasgow, and C. K. Parsons,Item Response Theory: Applications to Psychological Measurement共Dow Jones-Irwin, Homewood, IL, 1983兲.
7R. Wood, D. T. Wilson, R. Gibbons, S. Schilling, E. J. Muraki,
and R. D. Bock,TESTFACT: Test Scoring, Item Statistics and Item Factor Analysis, Version 4 共Scientific Software International, Lincolnwood, IL, 2002兲.
8S. E. Embretson and S. P. Reise,Item Response Theory for
Psy-chologists共Erlbaum, Mahwah, NJ, 2001兲.
9R. K. Hambleton, H. Swaminathan, and H. J. Rogers,
Fundamen-tals of Item Response Theory共Sage, Newbury Park, CA, 1991兲.
10G. Morris, L. Branum-Martin, N. Harshman, S. Baker, E. Mazur,
S. Dutta, T. Mzoughi, and V. McCauley, Testing the test: Item response curves and test quality, Am. J. Phys. 74, 449共2006兲.
11F. Lord,Applications of Item Response Theory to Practical
Test-ing Problems共Erlbaum, Hillsdale, NJ, 1980兲, p. 27.
12See Ref. 11and J. Wolfe, Optimal item difficulty for the
three-parameter normal ogive response model, Psychometrika46, 461 共1981兲for more details.
13This item and the other items from the 2004 11th grade test can
be viewed at www.tea.state.tx.us under the “TAKSTH released tests” link.
14Texas Education Agency, TAKS Information Booklet, Science,
Grade 11 Exit Level Revised共TEA, Austin, TX, 2004兲, p. 14; http://ritter.tea.state.tx.us/student.assessment/taks/booklets/ science/g11e.pdf
15D. Hestenes, M. Wells, and G. Swackhamer, Force concept
in-ventory, Phys. Teach. 30, 141共1992兲.
16E. M. Nussbaum, L. S. Hamilton, and R. E. Snow, Enhancing the
validity and usefulness of large-scale educational assessments: IV. NELS: 88 Science Achievement to 12th Grade, Am. Educ. Res. J. 34, 151共1997兲.
17E. S. Young, An Examination of the Validity of the Mathematics