1
Green Solution for the Current Energy Crisis in the
Urban Areas of Bangladesh
Ahmad Jawad,
*Ahammad, Md. Sarwar Kabir, Dilara Ireen Swarna
Department of EEE, Ahsanullah University of Science & Technology 141 & 142, Love Road, Tejgaon Industrial Area, Dhaka-1208, Bangladesh
Abstract— This work is focused on alleviating the electricity scarcity of urban areas of Bangladesh with a green system where utility grid is unable to fulfill the demand of the people. For this purpose, at first, designing of different types of Solar Home Systems (SHSs) including their performance analysis has been done. Then a cost analysis for a period of 20 years has been computed for each of the SHSs. Later on, a comparative study has been made reflecting both the performance and cost of those SHSs so that a solution could be made for the electricity shortage problem. For backing the solution, a relative study with the conventional sources has also been done including their environmental impact in the duration of 20 years. For making the solution feasible, Feed-In-Tariff (FIT) has been recommended so that mass people get encouraged to come forward to assist the government in solving this ever – present difficulty.
Index Terms— Energy Crisis, FIT, GHG Emission, Global Warming, Green Electricity, Grid-Interactive, Grid-Tied, Performance Ratio, LCCA, UEC, SHS
I. INTRODUCTION
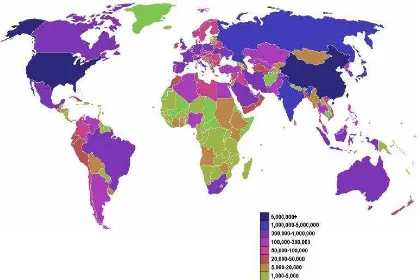
At the present time the electricity companies of Bangladesh are unable to produce enough electricity to meet the domestic, industrial and development needs. The generation capacity is about 8005MW (as on March 2012) and maximum demand served so far is 6066 MW (March 22, 2012) [1] whereas the total demand is 9023MW. [2] According to USAID, the demand for energy is growing at a rate of 10% annually. In 1971, 3% of the total population in Bangladesh had access to electricity. Today, approximately 33% of the population has access, which is also low compared to many developing countries. [3] This crisis is partly due to over-dependence on gas. The present gas deficit against the national demand on a daily basis is expected to increase further in the upcoming future. The crisis will deepen unless a greater share of indigenous coal is included in the energy mix. [4] But burning fossil fuels emits poisonous gases and toxic metals into our atmosphere, directly causing increasing incidents of lung disease, polluting soils and waters, damaging crops. The figure below illustrates clearly that, Bangladesh is one of those countries where carbon emission is increasing day by day and for the sake of creating more power by using the limited fossil fuel would make the situation worse. So, to fulfill this omnipresent electricity demand of this country without increasing the effect of global warming, renewable sources can be used in a wide range. In renewables, energy from the sun is one of the promising options for electricity generation. It can be used as the source of light in
photovoltaics. Solar power has two big advantages over fossil fuels. The first one is, it is never going to run out. The average power consumed by humans is 15 TW whereas the amount of sunlight reaching the Earth is 89,000 TW [5] which is about 6000 times higher. So it is understandable that solar energy is very plentiful. It has the highest power density among renewable energies. The second one is its positive effect on the environment. Solar power system is free of pollution during use.
The Solar Home System (SHS) distribution agenda in Bangladesh is considered to be one of the most efficacious of its kind in the world, bringing power to rural areas where grid electricity supply is neither available nor expected in the medium term. [6] Solar electricity can be used in cities too where grid connection is available as the electricity companies of Bangladesh are insufficient to ensure 24/7 electricity. Load shedding for almost six to ten hours a day in the grid-connected areas has become a usual phenomenon. [7] In the FY 2010, load shedding was imposed on 354 days, and in FY 2011 the deficiency of power was about 1335 MW [8] which is a very alarming state.
Keeping all these factors in mind the authors intended to analyze different types of Solar Home Systems (SHSs) with respect to electrical, financial and environmental issues and then suggested the better solution for the energy crisis in Bangladesh.
II. TYPES OF SOLAR ELECTRIC SYSTEMS
The three most common types of solar electric systems are Off-Grid or Stand-Alone, Grid-Tied and Grid-Interactive. Each has its distinct applications and components. [9]
A. Off-Grid or Stand-Alone
Stand-Alone systems are not tied to any utility grid and are most common in remote areas where there is no utility grid connection. In off-grid areas, the solar electric system represents the home’s main source of power. Generators, small wind systems, and other backup fuel sources are sometimes used as backup power when the solar power stored in the batteries is not enough to meet household needs.
These systems comprise of: Solar panels (to convert the light of the sun into electricity), an inverter (to convert electricity produced by the system from DC into AC energy), a rectifier (sometimes used to change AC to DC and back again to get the most use out of a system), a battery (to store energy for use at nighttime), a charge controller (to prevent
2
Fig. 1 Carbon emission scenario of the world
overcharging the battery) and a power meter (displays the amount of power used, produced, and stored in the battery bank).
Fig. 2 Stand-Alone Solar Home System
The positive benefits are many which make installing a Stand-Alone SHS a sound investment. First of all, there are no electricity bills for Stand-Alone SHS owners and hence it protects its owners from annual rises in electricity expenses. It
produces clean, green and noiseless energy. As it lessens greenhouse gas emissions, so naturally it is healthier for the environment. It is appropriate for diverse locations and building categories and because of this quality it is applicable for remote locations instead of installing expensive overhead poles or underground feeds from the utility grid. This type of system lasts long, system life expectancies in excess of 25 years. Moreover, it earns building efficiency points required for new homes (BASIX). It adds value to consumers’ property. For this it is an attractive addition to potential buyers of consumers’ property. [10]
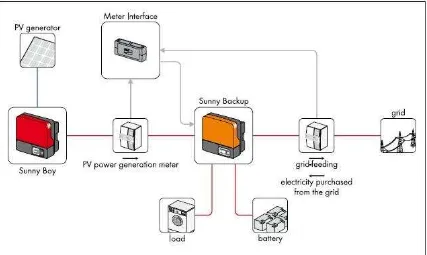
B. Grid-Tied
In this system, the solar panels are connected to local utility grid to supplement normal power supply from the utility company. Grid-Tied systems consist of: Solar panels, an inverter, a power meter and a disconnect switch (for safety reasons, prevents the system from sending power to the grid during power outages. This is called islanding).
A Grid-Tied solar power system can save thousands of dollars off consumers’ future power bills and at the same time also offers the security of still being connected to the utility grid. It is a sound investment that adds value to consumers’ home or building. It has almost all the benefits that have been discussed in the Stand-Alone SHS. In addition to these, the government offers rebates and grants to suitable Grid-Tied
3
Fig. 3 Grid-Tied Solar Home System
C. Grid-Interactive (Grid-Connected with Battery Backup)
Very similar to the Grid-Tied system, this system adds a “battery bank” to collect the power generated from the solar panels. Power stored in the batteries can be used during power outages. The components of this type of system consist of:
Solar panels, an inverter, a battery bank, a backup inverter (to provide electricity during power outage), a power meter (displays the amount of power used, produced, and stored in the battery bank) and a disconnect switch (to prevent islanding during power outages).
4
Just like a basic Grid-Tied system, Grid-Interactive system reduces consumer’s electric bill with the security of still being connected to the grid. It is a combined form of Stand-Alone and Grid-Tied SHSs. So, it has almost all the benefits of them. In addition to theses, it also supplies power to the house during utility outage. Moreover, it can work with multiple DC sources. It is wind turbine and micro-hydro compatible. [12]III.DESIGNING OF VARIOUS SOLAR SYSTEMS
A typical urban house where the daily usage is 11.3 kWh Alone section). All the solar system is considered to be of 48 volts. [13]
A. Off Grid or Stand – Alone SHS
A. 1. PV Module Designing
For Dhaka, Bangladesh, the solar radiation is 5.24 kWh / m2 / day, [14] which is also called the average sunshine hours per day. Also the required watt-hour / day are 11300.
Wattage =
=
= 2156.49W
Let the Solar PV (SPV) module losses to be of almost 80%
Actual wattage = lifetime of the module increases to 25 years from 10. [15]
So standard capacity of modules should be = 333 0.8 =
According to NEC (National Electrical Code), Safety factor of the inverter should be 125% of the wattage rating of the loads. [16]
Hence, inverter size should be =
= 4076.09 W Nearest available inverter capacity is 4248W [17] whose input is 48VDC and output is 230VAC.
Generally the features of charge controller are incorporated in recent inverters. For this, the design of charge controller is not needed.
Taking the nearest available battery capacity which is 1500Ah, 4V. [19]
As discussed before, the needed no of modules = 11
B. 2. Grid – Tied Inverter Designing
Required Watt-hour / day to be fed to the grid = 11300 From PV module designing in the Stand-Alone section we have acquired the actual wattage of the PV array was 2695.61W
Let the inverter efficiency be of 92%
So, the inverter size should be = =
= 2930.01W
Nearest available inverter capacity is 3200W. [20]
C. Grid – Interactive SHS
C. 1. PV Module Designing
As discussed before, the needed no of modules = 11
C. 2. Grid – Tied Inverter Designing appliances during utility power outage. Power outages last from a portion of an hour to a day (or more). Again, this decision will greatly affect the system size and cost, so it is more cost-effective to stay on the conservative side.
Let the maximum power outage in a day be 6 hours. [7] The loads to be powered during utility outage are as
Let the Depth of Discharge be of 50%; demanded autonomy of battery assumed to be of 3 days and the battery efficiency be of 80%
So, actual capacity of the battery = 451.88Ah
5
TABLEITABLE FOR LOAD DETERMINATION DURING UTILITY POWER OUTAGE
Device Type Device Watts Daily Use Hours No of Units Total AC Watts Total AC Wh/day
Dining CFL 23
6
2 46 276
Drawing CFL 23 2 46 276
Kitchen CFL 23 1 23 138
Bedroom CFL 23 3 69 414
Bathroom CFL 14 3 42 252
Mobile Charger 4 4 16 96
Fan 60 4 240 1440
Total 482 2892
So, needed no of batteries in series= 8
And needed no of batteries in parallel =
=
= 1.81 2
C. 4. Backup Inverter Designing
It is a device that enables the PV panel to produce electricity during utility outage. It is needed because PV plant disconnects from the grid in case of blackout and it does not produce any more electricity – neither for grid feeding nor for the supply of consumers. [21]
Battery size = Capacity of Battery Bank System Voltage = 500 48 = 24kWh
From this battery bank, the loads are designed to be operated for 6 hours.
So, backup power =
=
= 4kW
Nearest available backup inverter power is 5kW. [22]
IV.SHSMODELS ACCORDING TO ELECTRICAL PERFORMANCE
In this section, the comparison of the performance of different SHSs: Stand Alone, Grid – Tied & Grid – Interactive systems is done. Here simulation software PVSyst v5.55 is
used and the loads and system parameters are considered to be same as discussed earlier in this work.
At first the comparison of the performance of stand – alone and grid – tied system using PVSyst v5.55 is done. The parameters given in the software are same as the parameters described earlier.
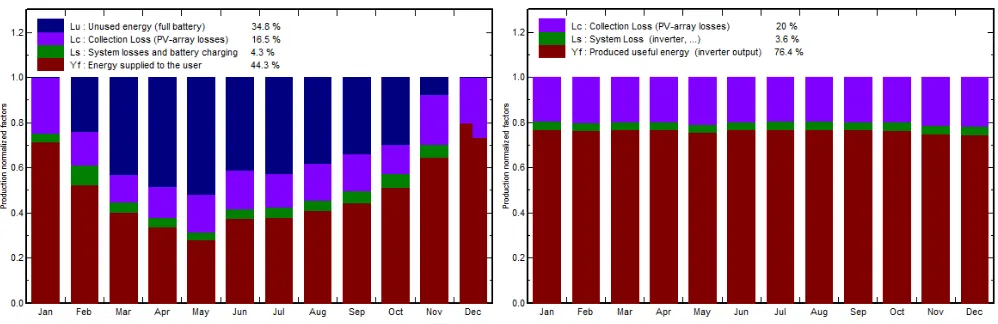
In fig 5, Y – Axis represents the total amount of energy that is being produced by PV generator throughout the year. As the stand – alone system has a battery to store a limited amount of energy irrespective of how much energy is being produced by the PV array, so maximum loss occurs in the time of maximum irradiance. But in the case of grid – tied system, the total amount of electricity produced by the PV array can be fed back to the utility grid. So, in the grid – tied system, the more electricity is produced the more is fed to the grid and hence less loss.
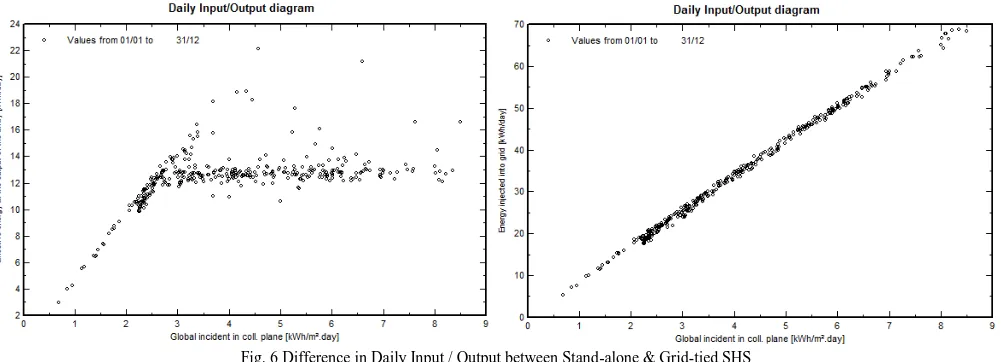
In fig 6, for the stand – alone system, after a certain limit of irradiance, the output of the system is almost same as the excess energy is lost (due to the limited capacity of the storage system). But for the grid – tied system, as the electricity produced by the PV array can be fed to the utility grid, which has an enormous collecting capacity, so, with the increase of irradiance, all the electricity produced by the PV panel can be fed to the utility grid.
6
Fig. 6 Difference in Daily Input / Output between Stand-alone & Grid-tied SHS
The performance ratio of the system is defined by ratio of normalized system production to the reference incident energy to the collector plane. Comparing this for both the systems in fig 7 it can be seen that, the performance ratio of grid – tied system is over 31% better than the stand – alone system.
Now comes the comparison between grid – interactive and grid – tied SHS. It goes without saying that, grid interactive system has the benefits of both the stand – alone and grid – tied system. That is, apart from feeding the energy produced by the sun to the utility grid, it can also provide electricity in times of utility outage to the household, which the grid-tied system cannot. Unlike the grid – tied systems, grid – interactive systems are wind turbine and micro – hydro system compatible which gives the system (grid – interactive) diversity. So, as a result it is understandable that the grid – interactive system can work with multiple DC sources whereas the grid – tied system cannot for the limitation of being able to work only with a single DC source (PV generator).
V. ECONOMIC ANALYSIS OF DIFFERENT SHSMODELS In this section, the economic comparison of different
SHSs: Stand Alone, Grid – Tied & Grid – Interactive systems
with two different fossil fuel sources: diesel generator & petrol
generator is done. In spite of the benefits of renewable energy,
the economic feasibility of solar PV systems is often put into question due to the large initial investment cost associated with it. [23] But it is easy to overlook the fact that solar PV systems do not need regular fuel costs like diesel or petrol generators. Moreover, PV systems also require less maintenance than fossil fuel powered generators and hence result in lower operational cost. Another benefit of solar PV systems is the reduced Green House Gas emission, which makes them environment friendly. At first glance, it may appear that diesel or petrol generators are better options than solar PV units from an economic point of view. But to compare the true economic worth of solar power and fossil fuels, conventional appraisal techniques will not be effective due to their different cost structures. Life Cycle Cost Analysis (LCCA) has proved to be a more reliable method in this regard. [24]
LCCA covers the total cost of a power source in three phases: construction phase, operational phase and decommissioning phase. The construction phase includes the initial investment cost. Operational phase contains the fuel cost and the cost incurred due to operation and maintenance. The
7
decommissioning phase covers the cost related to termination of the project and disposal of the equipment. All these costs are summed up to provide the total life cycle cost of the project. The overall cost incurred over the lifetime is then converted into unit cost per kWh of energy. This approach has gained acceptance among the researchers and been followed in a number of research projects related to energy production. [25]This focus often lacks the emphasis on economic factors like period of analysis (N), excess inflation factor (i), and discount rate (d) which need to be considered while calculating the adjusted life cycle cost (LCC). The analysis period N is the lifetime of the longest running system subjected to comparison. In case of commercial home PV systems the average lifetime is about 20 years and for local petrol generators the lifetime accounts for 1 to 2 years. So for LCC analysis N (longest service period) is taken to be 20 years. As the components and services get expensive over time, the excess inflation factor (i) is taken into account in this cost escalation. In this calculation inflation factor is applied to fuel,
maintenance and replacement costs. The last factor is the discount rate (d), which is the rate at which money would increase in value if it was invested in other projects rather than a power system.
In LCC analysis, at first the total net present worth (PW) of recurring and non-recurring costs has to be calculated. To do this, the future cost is multiplied by a factor (Pr) to incorporate the inflation and the discount rate. For a non-recurring single future cost Cr, paid after N years, the present worth (PW) is given by [26]
PW = Cr × Pr = Cr ×
(1)
For a recurring payment Ca, which occurs annually for a period of N years, the present worth (PW) is
PW = Ca × Pa = Ca ×
| |
(2)
TABLE II
LCC ASSESSMENT OF GRID-TIED SOLAR PV SYSTEM FOR 11.3KWH LOAD (1US DOLLAR =82BDT)
Daily Load 11.3 kWh
Solar Panel Size 333W 11 = 3663W
1) Capital Cost
Breakdown of Capital Cost Unit Cost BDT
a) Cost of Solar Panels 235 BDT/Watt 860,805.00
b) Cost of Grid – Tied Inverter 55 BDT/Watt 165,000.00
c) Cable and Installation 50 BDT/Watt 183,150.00
d) Solar Mounting 20 BDT/Watt 73,260.00
e) Miscellaneous Cost 20 BDT/Watt 73,260.00
Total Capital Cost (=a+b+c+d+e) 1,355,475.00
2) Fuel Cost (No Fuel Required) 0.00
3) Recurring Maintenance Cost
Annual Maintenance Cost, Ca 5,000.00
Annualization Factor, Pa (from eq. 4) 8.51
Life Cycle Maintenance Cost, LCMC (=Ca Pa) 42,550.00
4) Non – recurring cost (Replacement cost)
Grid – Tied Inverter
Inverter replacement, IR (in 5 years’ time) 165,000.00
General Component replacement, GCR (in 5 years’ time) 2,500.00
Sub Total, Cr (=IR+GCR) 167,500.00
Present Worth Factor, Pr (5 years’ time) 0.62
Life Cycle Replacement Cost, LCRC1 (=Pr Cr) 103,850.00
Inverter replacement, IR (in 10 years’ time) 165,000.00
General Component replacement, GCR (in 10 years’ time) 2,500.00
Sub Total, Cr (=IR+GCR) 167,500.00
Present Worth Factor, Pr (10 years’ time) 0.39
Life Cycle Replacement Cost, LCRC2 (=Pr Cr) 64,623.00
Inverter replacement, IR (in 15 years’ time) 165,000.00
General Component replacement, GCR (in 15 years’ time) 2,500.00
Sub Total, Cr (=IR+GCR) 167,500.00
Present Worth Factor, Pr (15 years’ time) 0.24
Life Cycle Replacement Cost, LCRC3 (=Pr Cr) 40,200.00
Life Cycle Replacement Cost, LCRC (=LCRC1 + LCRC2 + LCRC3) 208,673.00
8
Here Pr and Pa are the present worth factors for non-recurring and non-recurring costs respectively. Pa is called the Annualization Factor. Here the present worth factors for non-recurring and non-recurring costs are calculated from eqn. (1) and (2), gives the total life cycle cost of the system. From the overall life cycle cost the Annualized Life Cycle Cost (ALCC) and Unit Electricity Cost (UEC) are calculated using the Annualization Factor (AF) and DailyAccording to the above discussion, life cycle cost analysis has been done for the SHSs (Stand alone, grid- tied and grid interactive). From this, unit electricity cost for each of the system is calculated and compared among the systems.
So for Grid – Tied system, according to electrical performance, grid interactive SHS is better than the grid-tied one. But, cost is something that cannot be ignored; as it becomes meaningless if people can’t afford it. As the authors intend to find a better solution for urban
previous analysis. From Walton, they give a one-year warranty for generators. But generally, these products do not become out of service in such a short time. That is why; the analysis for the conventional sources has been done with a warranty of
1.5 year to make the analysis more feasible. Recent market price of generator and fuel has been taken into account.
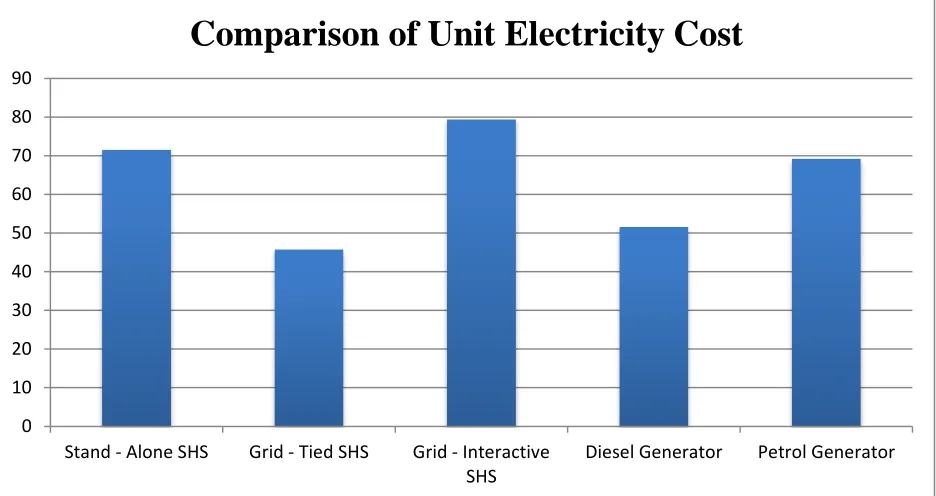
From the analysis it is visible that, the unit electricity cost for diesel generator is BDT 51.58 and for petrol generator it is BDT 69.26, which is 11.24% and 33.90% higher than the UEC of grid-tied SHS respectively.
VI.GHGEMISSION FROM CONVENTIONAL SOURCES
Conventional sources also emit Green House Gas (CO2) that affects our environment badly.
We know that, every liter of diesel fuel when burned produces 2.7 kg of carbon dioxide. [27]
It has been calculated that, the discussed diesel generator is consuming 1473.04 × 20 = 29,460.80 liter diesel in 20 years.
So, the amount of CO2 produced in 20 years by the diesel
generator is = 2.7 × 29,460.80 = 79,544.16 kg
Also, for each liter of petrol fuel when burned produces 2.4
kg of carbon dioxide.
It has been calculated that, the discussed petrol generator is consuming 2474.70 × 20= 49,494 liter petrol in 20 years.
So, the amount of CO2 produced in 20 years by the petrol
generator is = 49494 × 2.4 = 118,785.60 kg
VII. ECONOMIC BENEFITS FROM SOLAR HOME SYSTEMS
Using the stand – alone system in the urban area doesn’t provide much help to the consumer in the context of economic benefit. This is the best solution for rural areas where grid consumers. The tariff in which the electricity can be sold back to the utility grid is called Feed – In – Tariff (FIT). [28]
One of the most fundamental design challenges for a FIT policymaker is the determination of the actual FIT payments awarded to project developers for the electricity they produce. A worldwide overview of FIT policies shows that a variety of methodologies are used which reflects diversity in the policy goals. These different methodologies can be divided into four basic groups.
ii. Based on the “value” of renewable energy generation either to society, or to the utility, usually expressed in terms of “avoided costs.” This methodology is used in California, as well as in British Columbia.
9
Fig 8: Comparison of UEC among different electricity generating systems (BDT)
iv. Based on the outcomes of an auction or bidding procedure, which can help inform price discovery by attractive to the market directly. An auction-based method can be applied and discriminated based on different technologies, project sizes, etc. and is a variant on the cost-based methodology.
It is possible to use detailed market research and empirical analysis of current renewable energy costs to establish FIT payment levels. This ensures that the latter are adequate to allow efficiently operated projects to be profitable. This approach is used in countries including Germany and Spain, and in the Canadian province of Ontario.
Market research (conducted either by consultants or directly by government agencies) provides the price data required to establish cost-based FIT payment levels. Due to changing market conditions, the payment levels must be revised over time to ensure that they continue to reflect both industry and market realities.
The first national feed-in tariffs to make significant impacts in Europe were based on providing RE developers a FIT payment that was a percentage (usually less than 100%) of the retail price.
Under this approach, payments remain directly tied to the spot market price, thus creating an incentive to produce electricity at peak times. Under its 1990 Feed-in Law (StrEG), Germany offered a FIT payment of 90% of the retail price for renewable resources such as wind and solar those were less than 5 MW.
Beginning in 1992, Denmark implemented a similar policy, which allowed buying electricity generated from wind turbines up to a maximum of 85% of the average retail price.
In 1997, in its Law on the Electricity Sector (Spain 1997), Spain implemented a FIT policy based on a percentage of the retail price – tariffs were established at 80-90% of the retail rate. Spain replaced this policy framework in 1998 with the RD 2818/1998, which established a framework that offered both a fixed and a premium FIT option (Spain 1998). However, in April 2004, Spain reintroduced a FIT policy that employed a percentage-based design, adding for the first time the possibility that the premium amount could exceed 100% of the retail price, in particular to encourage solar PV and solar thermal development (Spain 2004).
The government can offer the percentage of retail price policy to initiate the installation of grid connected systems. They can offer to pay 80 – 90% of the retail price of per unit green electricity to the producers. In this way two things can be achieved. The shortage of electricity in the grid can be reduced and at the same time an extra source of income to the home – owners can be provided.
VIII. JUSTIFICATION FOR PROPOSING GRID-TIED SYSTEM
After the electrical, economic and environmental analysis, it is understandable that a grid-tied SHS is a better solution for the prevailing energy crisis in the general city-dwellers of Bangladesh. In addition to that, if an FIT is introduced with it then the household owners will become more interested in installing a grid-tied SHS, which will protect the environment from hazardous pollution in the long run.
IX.CONCLUSION
Solar electric systems are achieving more popularity among the homeowners due to the rising of energy prices and growing environmental concerns. The U.S. Environmental Protection 0
10 20 30 40 50 60 70 80 90
Stand - Alone SHS Grid - Tied SHS Grid - Interactive
SHS
Diesel Generator Petrol Generator
10
Agency estimates that, the average two-person home emits approximately 41,500 pounds of greenhouse gases during a year. So, installing an SHS can reduce global warming to a great extent. Most of the solar electric systems last for about 30 years and pay for themselves in 4 to 5 years after tax credits and rebates. That means homeowners can enjoy free electricity for years. A solar electric system increases owner’s home’s value by $20 for every $1 in annual utility bill savings. Implementation of the Grid-Tied solar electric system for Bangladesh will surely mitigate the electricity scarcity problem to a great extent. Though the installation of this system requires high initial investment, this does not actually suggest the true financial liability of this service throughout its lifetime. Grid tied Solar PV units usually incur greater initial investment than petrol or diesel generators, but in the long run, the overall per unit energy production cost for fuel driven generators is not better than that for grid tied solar PV system units. Using grid connected systems; the produced excess electricity can be sold back to the grid. This adds some extra economic benefit to the consumers. The government can offer to pay up to 80 – 90% of the retail price of per unit green electricity as FIT to encourage the producers to initiate the installation of grid connected systems. In this way the shortage of electricity in the grid can be reduced and at the same time an extra source of income to the home – owners can be provided. Moreover, excessive harmonics, frequency and voltage mismatch problem between the electricity grid and solar generator have to be solved to make grid-tied solar systems more applicable. This work’s novelty lies in the discovery that the selection between renewable and conventional power sources depends on the load demand and the power rating of the generators and grid tied solar PV systems perform always better from both a commercial and an eco-friendly point of view for a developing country like[1] (2012) Bangladesh Power Development Board website. [Online]. Available: http://www.bpdb.gov.bd/bpdb/index.php?option=com_conte nt&view=article&id=5&Itemid=6
[2] (2012) Bangladesh Power Development Board website. [Online]. Available: http://www.bpdb.gov.bd/bpdb/index.php?option=com_conte nt&view=article&id=151&Itemid=118
[3] (2012) U. S. Energy Information Administration website. [Online]. Available: http://www.eia.gov/countries/country-data.cfm?fips=BG&tr k=m
[4] Imam, B. Energy Crisis and Potential in Bangladesh , Strategic Analysis, Vol. 35 No.2, 2011, pp.248 – 264
[5] (2012) International Sustainable Campus Network website. [online] Available: http://www.international-sustainable-campus-network.org/view-document/4-bojan-baletic-university-of-zagreb.html [6] A. Kowsar, M. S. Islam, K. R. Mehzabeen and Z. H. Mahmood, “Solar
Energy to Meet the Energy Crisis in Bangladesh” in Proc. International
Conference on Environmental Aspects of Bangladesh (ICEAB), Japan, September 2010, pp. 113-115.
[7] (2012) Power Division website. [online] Available: http://www.powerdivision.gov.bd/user/brec3/33/14
[8] Bangladesh Power Development Board (BPDB), “Annual Report 2009
-2010,” February 2011 and “Annual Report 2010-2011,” January 2012. [9] National Renewable Energy Laboratory (NREL), “Own Your Power! A
Consumer Guide to Solar Electricity for the Home,” National Renewable Energy Laboratory, Rep. BR-840-43844; DOE/GO-102009 -2656, 2009.
[10] (2012) Global Environmental Services Pty Limited website. [online] Available:
http://www.geservices.com.au/TypicalStandAloneSolarSystemInstallati on.aspx
[11] (2012) Global Environmental Services Pty Limited website. [online] Available: http://www.geservices.com.au/GridConnectedSystems.aspx [12] (2012) OutBack Power website. [online] Available:
http://www.outbackpower.com/pdf/brochures/Grid_Interactive_System s_2.pdf
[13] (2012) The National Centre for Photovoltaic Research and Education (NCPRE) website. [online] Available: http://www.ncpre.iitb.ac.in/page.php?pageid=48&pgtitle=Standalone-Solar-Photovoltaic-SPV-System
[14] (2012) National Renewable Energy Laboratory (NREL) website.
[online] Available:
http://rredc.nrel.gov/solar/calculators/PVWATTS/version1/Internationa l/inputv1_intl.cgi?siteid=419230
[15] (2012) Photon.info website. [online] Available: http://www.photon.info/photon_site_db_solarmodule_en.photon [16] National Fire Protection Association (2010) NFPA 690.8: National
Electrical Code, 2011 ed., Quincy, Massachusetts, NFPA
[17] (2012) SMA Solar Technology website. [online] Available: http://www.sma-america.com/en_US/products/off-grid-backup-solutions/sunny-island-3324-4248-4248-us.html
[18] M. R. Khan, S. A. Chowdhury and M. F. Khan (2012), Reduced battery sizing in a Solar Home System with respect to the night load
and solar panel size’ in IEEE 2012: Developments in Renewable Energy Technology (ICDRET), 2012, 2nd International Conference, Dhaka, Bangladesh, pp. 1-4.
[19] (2012) Trojan Battery Company website. [online] Available:
http://www.trojanbatteryre.com/PDF/datasheets/IND23-4V_TrojanRE_Data_Sheets.pdf
[20] (2012) SMA Solar Technology website. [online] Available: http://files.sma.de/dl/5682/SB1200_3000-DAU104411W.pdf
[21] (2012) SMA Solar Technology website. [online] Available: http://www.energymatters.com.au/images/SMA/sbu5000.pdf
[22] (2012) SMA Solar Technology website. [online] Available: http://files.sma.de/dl/8016/SBUPSYS-DEN102020.pdf
[23] M. M. H. Bhuyian, M. A. Asgar, R. K. Mazumder and M. Hussain
Economic evaluation of a stand-alone residential photovoltaic power system in Bangladesh , Renewable Energy, Vol. 21 No. 3-4, 2000, pp.403 – 410.
[24] D. I. Swarna, A. Jawad and Ahammad, "Life Cycle Assessment of Grid Tied SHSs in Bangladesh with Respect to Conventional Sources", IJECS: International Journal of Electrical & Computer Sciences, Vol.12, Issue 5, pp.15-19, October 2012.
[25] M. A. Kabir and A. Roy, Life Cycle Assessment of Solar PV in
Bangladesh with Respect to Conventional Sources in IEEE 2012: Developments in Renewable Energy Technology (ICDRET),2012, 2nd International Conference, Dhaka, Bangladesh, pp. 1-5.
[26] Tomas Markvart, Editor, Solar Electricity, 2nd ed., John Wiley and Sons, 2003, pp. 115-127.
[27] James Miller, Making the Most of the Internet and the Other Less/More Important Things in Life, Daisy Analysis Ltd., 2006.p. 189.