International Conference and Exhibition on Sustainable Energy and Advanced Materials (ICE SEAM 2011) Solo-Indonesia. October 3-4, 2011.
54
|
I C E S E A M 2 0 1 1
Mitigation of Green House Gases Emission in Cassava Mill: Case Study in
Lampung, Indonesia
Udin Hasanudin
1),*, Agus Haryanto
2), Erdi Suroso
1)1)
Dept. Agroindustrial Technology, University of Lampung, Bandar Lampung, INDONEISA
2)
Dept. Agricultural Engineering, University of Lampung, Bandar Lampung, INDONEISA * Corresponding author. Tel: +62-721-700682, Fax: +62-721-700682
E-mail: [email protected]
Abstract
Lampung is the biggest contributor for cassava production in Indonesia. Recently, Lampung produced 7.57 million ton of cassava tubers annually and contributed about 34.4% of the national cassava production. Therefore, Lampung is the home for cassava-based industries. There were 76 industries are in operation in Lampung, including four small scale tapioca industries called ITTARA. These industries wasted huge of water having potential to generate biogas through anaerobic digestion process. The objective of this paper was to study greenhouse gas (GHG) emission mitigation of cassava mills in Lampung by using biogas fuel resulted from wastewater treatment. The study evaluated GHG emission from the existing conditions and then calculate GHG emission reduction potential in the processing step by utilization of waste. General life cycle methodology was applied for the evaluation of GHG reduction. Results showed that 2.82 to 4.5 m3 of waste water were produced for every ton of cassava being processed. The waste water was characterized by high organic matter with an average COD of 18,000 mg/L. During waste water treatment, biogas was estimated at around 26 m3 per ton cassava with methane content of 56.2 vol.%. The study also revealed that utilization of biogas may replace a part of diesel fuel used in the cassava mills and therefore potentially reduces GHG emission. Assuming that 80% of cassava production was processed directly in cassava mill, it can be showed that total biogas energy potential throughout Lampung Province was equivalent to 87.4 million liters diesel fuel per year. This quantity will reduce GHG emission about 1.32 million tons of CO2 equivalent per year.
Keywords: Biogas, Greenhouse gas, Emission, Cassava mill, Mitigation.
1.
Introduction
Lampung is the biggest contributor for cassava production in Indonesia. Recently, Lampung produced 7.885 million ton of cassava tubers annually and contributed about 36% of the national cassava production (Table 1).
Table 1. Harvesting area, production and yield of cassava in Lampung as compared to Indonesia
Year
LAMPUNGa) INDONESIAb)
Area (Ha) Yield (Ku/Ha)
Production
(Ton) Area (Ha)
Yield (Ku/Ha)
Production (Ton)
2005 252 984 190.00 4 806 254 1 213 460 159.00 19 321 183 2006 283 430 194.00 5 499 403 1 227 459 163.00 19 986 640 2007 316 806 201.86 6 394 906 1 201 481 166.36 19 988 058 2008 318 969 242.09 7 721 882 1 204 933 180.57 21 756 991 2009 320 344 246.15 7 885 116 1 205 440 182.43 21 990 381 Source: a) Lampung Dalam Angka (2010)
b) BPS (2010)
International Conference and Exhibition on Sustainable Energy and Advanced Materials (ICE SEAM 2011) Solo-Indonesia. October 3-4, 2011.
55
|
I C E S E A M 2 0 1 1
The tapioca industries release huge amount of waste water characterized by high organic matter and high COD (chemically oxygen demand). Anaerobic decomposition of organic matter produces biogas with composition of 50 – 70% CH4; 25 – 45% CO2; and trace of nitrogen, hydrogen, hydrogen sulfide. For a complete reaction, the decomposition can be presented as:
4 (chemically oxygen demand). If methane is released to the atmosphere it will contribute significantly to global warming since CH4 having high green house effect (21 times of CO2) so that its existence should be reduced (Rodhe, A.L., 1990). The CH4, however, is combustible and, therefore, can be utilized as fuel to replace diesel fuel used in the factory given that gas is produced and collected appropriately.
The purpose of this study is to estimate potential for GHG mitigation by using biogas fuels resulted from waste water treatment.
2.
Methodology
The method used in this research included literature study, field survey, field measurement, and laboratory testing. Literature from other researches, industries, and government institutions will be used to dig important information related to the study. Field survey was explored to locate cassava-based industries throughout Lampung Province and to get information on the material balance, waste (type and amount), and waste treatment. Global Positioning System (GPS)tool (GPSMAP 60CSx, Garmin International Inc., USA) was used to geographically locate each industry.
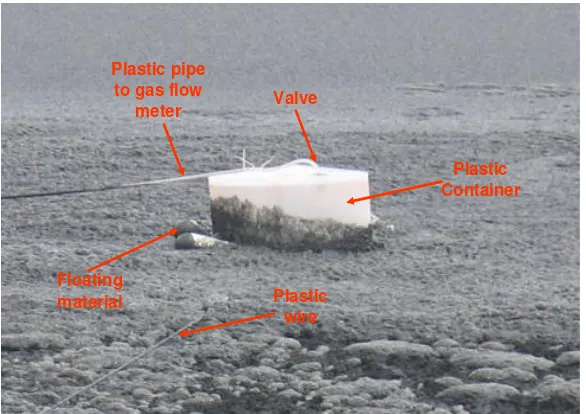
Field measurement was conducted at five industries sampled based on their capacity to determine the amount of raw material flow, waste flow rate, and CH4 emitted from waste water. The amount of waste water was calculated by using mass balance in the processing steps. Methane emission was captured using floating material made from plastic box of 24 cm width by 60 cm length as depicted by Figure 1. Gas flowrate was measured using wet gas flow meter (WK-NK-0.5B, Shinagawa Corporation, Japan).
Figure 1.Gas trapping device used to measure CH4 emission from the water treatment pond in a cassava mill
Laboratory measurement was carried out to characterize waste water and biogas composition. Wastewater properties will be represented by COD, TSS, VSS, pH, temperature values. COD was measured by spectrophotometer (HACH DR4000). Biogas composition was determined using gas chromatograph (GC 2014, Shimadzu).
Biogas production (FBio) was estimated using the following relation:
International Conference and Exhibition on Sustainable Energy and Advanced Materials (ICE SEAM 2011) Solo-Indonesia. October 3-4, 2011.
56
|
I C E S E A M 2 0 1 1
Where COL is COD load (kg/ton of cassava tuber), ηCODr is COD removal efficiency, % CH4 is methane fraction in the biogas (vol.%), and cf is conversion of COD to CH4 (Nm3/kg COD removed). Theoretically, 0.35 Nm3 of methane can be produced for every kg of COD removed. In this case, however, we used 0.3 as a realistic value.
GHG emission reduction potential (GER) was calculated using the following relation:
GER = GERCH4 + GERfuelor el (3)
where GERCH4 is GHG emission reduction due to CH4 combustion and GERfuel or el is GHG emission reduction due to replacement of fuel or electricity by biogas utilization.
3.
Results and Discussion
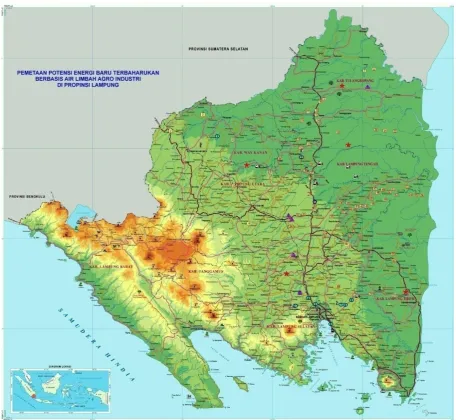
Our study revealed that there were 71 units cassava-based industries are in operation throughout Lampung Province with a total capacity of 5.2 million ton cassava root annually. Most them (70 units) process cassava into tapioca starch and one unit produces ethanol. Three units of tapioca industries also produced citric acid from their waste. In addition, there were four small scale tapioca industries (called ITTARA) managed by community also run with each processing capacity up to 80 ton cassava per day. Feed industries also demanded cassava in a significant amount (3.5 million tons cassava per annum). Figure 2 shows distribution of cassava-based industries within Lampung Province.
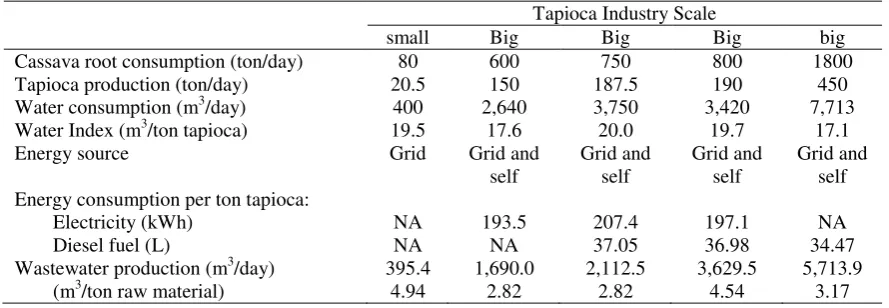
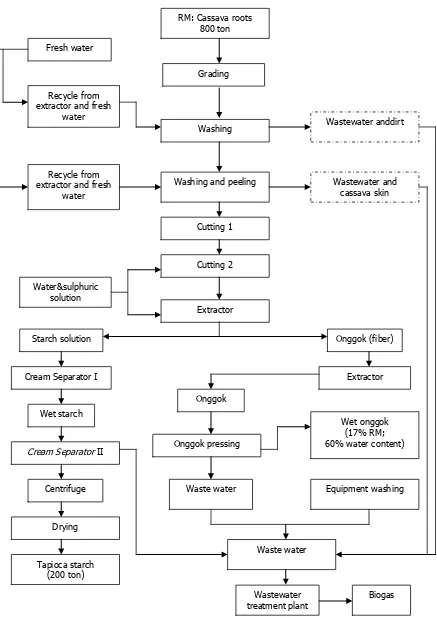
Processing capacity of those industries greatly varied from around 50 tons to 1800 tons cassava tuber per day. Our study at five tapioca industries (Table 2) revealed that tapioca starch yield varied from 23.8 to 25.6 percent of the raw material (cassava root). Cassava variety and machine capacity were amongst other factors affecting the tapioca yield. Presently, there are two varieties of cassava being popular for farmers, namely Kasertsat and Thailand with starch content of 18.15% and 16.99%, respectively. The cassava processing into starch is depicted schematically by Figure 3.
Table 2. Characteristic for selected tapioca industries Tapioca Industry Scale
small Big Big Big big Cassava root consumption (ton/day) 80 600 750 800 1800 Tapioca production (ton/day) 20.5 150 187.5 190 450 Water consumption (m3/day) 400 2,640 3,750 3,420 7,713 Water Index (m3/ton tapioca) 19.5 17.6 20.0 19.7 17.1 Energy source Grid Grid and
self
Grid and self
Grid and self
Grid and self Energy consumption per ton tapioca:
Electricity (kWh) NA 193.5 207.4 197.1 NA Diesel fuel (L) NA NA 37.05 36.98 34.47 Wastewater production (m3/day) 395.4 1,690.0 2,112.5 3,629.5 5,713.9
(m3/ton raw material) 4.94 2.82 2.82 4.54 3.17
It can be seen from Table 2 that in average 199.3 kWh electricity and 36.2 liters of diesel fuel was required to produce one ton tapioca starch. It can also be showed that tapioca yield varied slightly from 23.8 to 25.6 weight percent with an average value of 24.9%.
International Conference and Exhibition on Sustainable Energy and Advanced Materials (ICE SEAM 2011) Solo-Indonesia. October 3-4, 2011.
57
|
I C E S E A M 2 0 1 1
Figure 2. Distribution of cassava mills (yellowed square with number inside) in Lampung Province. (Sampling location was indicated by red star)
Table 3. Characteristic of wastewater produced from tapioca industries in Lampung Wastewater source pH Temperature
(oC)
DO (mg/L)
COD (mg/L)
BOD5
(mg/L) Wastewater from separator 6.0 29.6 6.62 20,433 11,466 Wastewater from washing 7.7 30.4 2.36 2.015 1.132
International Conference and Exhibition on Sustainable Energy and Advanced Materials (ICE SEAM 2011) Solo-Indonesia. October 3-4, 2011.
58
|
I C E S E A M 2 0 1 1
Figure 3. Flow chart for typical cassava processing to produce tapioca starch
RM: Cassava roots 800 ton
Wastewater anddirt Washing
Recycle from extractor and fresh
water
Washing and peeling Fresh water
Recycle from extractor and fresh
water
Grading
Wastewater and cassava skin
Wet starch Cream Separator I
Extractor
Onggok (fiber) Starch solution
Water&sulphuric solution
Extractor Cutting 2
Cutting 1
Cream Separator II
Centrifuge
Drying
Tapioca starch (200 ton)
Onggok
Onggok pressing
Wet onggok (17% RM; 60% water content)
Waste water Equipment washing
Waste water
Wastewater treatment plant
International Conference and Exhibition on Sustainable Energy and Advanced Materials (ICE SEAM 2011) Solo-Indonesia. October 3-4, 2011.
59
|
I C E S E A M 2 0 1 1
Table 4.Biogas composition (% volume) produced from wastewater treatment in tapioca industries
Biogas Composition Tapioca Industry Scale
small Big Big Big big Average Methane (CH4) 54.36 60.47 55.97 52.38 57.89 56.21
Carbon dioxide (CO2) 35.64 33.63 42.08 42.62 37.89 38.37
Nitrogen (N2) and others* 10.00 5.90 1.95 5.00 4.22 5.41
*) by difference
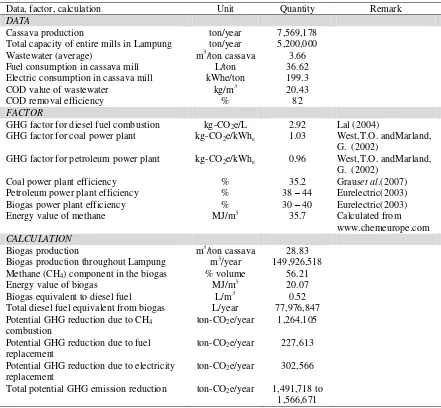
Tabel 5. GHG emission reduction potential in cassava-based industries in Lampung Province Data, factor, calculation Unit Quantity Remark
DATA
Cassava production ton/year 7,569,178 Total capacity of entire mills in Lampung ton/year 5,200,000 Wastewater (average) m3/ton cassava 3.66 Fuel consumption in cassava mill L/ton 36.62 Electric consumption in cassava mill kWhe/ton 199.3 COD value of wastewater kg/m3 20.43
COD removal efficiency % 82
FACTOR
GHG factor for diesel fuel combustion kg-CO2e/L 2.92 Lal (2004)
GHG factor for coal power plant kg-CO2e/kWhe 1.03 West,T.O. andMarland,
G. (2002)
GHG factor for petroleum power plant kg-CO2e/kWhe 0.96 West,T.O. andMarland,
G. (2002) Coal power plant efficiency % 35.2 Grauset al.(2007) Petroleum power plant efficiency % 38 – 44 Eurelectric(2003) Biogas power plant efficiency % 30 – 40 Eurelectric(2003) Energy value of methane MJ/m3 35.7 Calculated from
www.chemeurope.com
CALCULATION
Biogas production m3/ton cassava 28.83 Biogas production throughout Lampung m3/year 149,926,518 Methane (CH4) component in the biogas % volume 56.21
Energy value of biogas MJ/m3 20.07 Biogas equivalent to diesel fuel L/m3 0.52 Total diesel fuel equivalent from biogas L/year 77,976,847 Potential GHG reduction due to CH4
combustion
ton-CO2e/year 1,264,105
Potential GHG reduction due to fuel replacement
ton-CO2e/year 227,613
Potential GHG reduction due to electricity replacement
ton-CO2e/year 302,566
Total potential GHG emission reduction ton-CO2e/year 1,491,718 to
1,566,671
With a total capacity 5.2 million ton of cassava tubers for entire mills in Lampung, it can be demonstrated that biogas energy potential generated from wastewater in cassava-based industries throughout Lampung Province was 150 million m3, equivalent to 78 million liter of diesel fuel, per year. Combustion of biogas will save CH4 emission to the atmosphere at amount of 1.264.165 ton of CO2 equivalent per year. In addition, the use
of biogas may replace 78 million liter diesel fuel per annum. If the biogas is used to replace a part of diesel fuel, it will eliminate another GHG emission of 227,613 ton CO2 equivalent per year. In case that biogas is used to
replace electricity purchased from coal fired power plant, then it will remove 302,566 ton CO2per year. In total,
International Conference and Exhibition on Sustainable Energy and Advanced Materials (ICE SEAM 2011) Solo-Indonesia. October 3-4, 2011.
60
|
I C E S E A M 2 0 1 1
4.
Conclusions
The main conclusion of the study is in the following:
1. Anaerobic digestion of wastewater in cassava mills potentially produce biogas energy equivalent to 78 million liter diesel fuel per annum.
2. Biogas produced from wastewater treatment in cassava mills may replace entire diesel fuel (166%) or entire electric power (113%) used in the mills.
3. The potential reduction of GHG emission due to biogas utilization in cassava mills 1,491,718 to 1,566,671ton CO2 equivalent per year.
5.
Acknowledgement
Valuable data were received from sample mills that were not willing to be mentioned. Authors greatly acknowledge the supports. The views expressed in this article, however, are solely those of the authors’ responsibility.
References
BPS (BadanPusatStatistik) Provinsi Lampung,(2010)Lampung DalamAngka 2009 - Lampung in Figure 2009. BPS (BadanPusatStatistik),(2010)Statistik Indonesia 2009.
EURELECTRIC, (2003)Efficiency in electricity generation. Report.30 pages.
Graus, W.H.J., Voogt, M. and Worrell, E. (2007) ‘International comparison of energy efficiency of fossil power
generation’,Energy Policy,Vol. 35, pp. 3936–3951.
Hasanudin, U., Suharyono, S.A., Nawansih, O., Erna, M., Utomo, T.P. andSarkowi, M. (2007)InventarisasiPotensiEnergiTerbarukanBerbasis Air Limbah Agroindustri Di Provinsi Lampung (in Bahasa Indonesia),LembagaPenelitianUniversitas Lampung, Bandar Lampung.
http://www.chemeurope.com/lexikon/e/Heat_of_combustion, accessed at December 10, 2007.
Lal, R. (2004),‘Carbon emission from farm operations’,Environment International,Vol. 30, pp.981– 990.
Rodhe, A.L.(1990)‘A comparison of the contribution of various gasses to the greenhouse effect’,Science,Vol. 248, pp.1217-1219.
West, T.O. and Marland,G.(2002)‘A synthesis of carbon sequestration, carbon emissions, and net carbon flux in