1
andManagement Sciences Vol. 2, No. 12, 2013, pp. 01-15
JOURNALS
managementjournals.org
The Interrelationship between Bank Cost Efficiency, Capital and Risk-Taking in
ASEAN Banking
Izah Mohd Tahir ¹ and Abdul Mongid 2
¹ Corresponding author: Faculty of Business Management & Accountancy, Universiti Sultan Zainal Abidin,
21300 Kuala Terengganu, MALAYSIA
E-mail: izah@unisza.edu.my
² STIE Perbanas, Surabaya , INDONESIA
ABSTRACT
The objective of this paper is to investigate the importance of bank cost efficiency on capital and risk-taking of banks in six countries in the Association of the Southeast Asian Nations (ASEAN) that is, Indonesia, Malaysia, Singapore, Thailand, the Philippines and Vietnam. The panel data is taken from Bankscope database for the period 2003-2008. This study applies the Stochastic Frontier Analysis (SFA) to estimate bank cost efficiency and a three-stage least squares (3SLS) method to estimate the interrelationship between bank cost efficiency, capital and risk-taking. Ten bank specific variables and three environmental variables are employed. Banks’ cost efficiency, capital and risk-taking are set as instrumental variables. In the first stage of analysis, efficiency (EFF) is regressed against ETA, LTA, LASSET, LDR, RISK, PERSTEX, FIXTAS, CIR, EGRAW, CORRUPT and FREE. In the second stage of analysis, capital (ETA) is regressed against LTA, EFF, LASSET, RISK, OBSA, CIR, FIXTAS, ROA, EGRAW, CORRUPT and FREE. In the third stage of analysis, risk-taking (LTA) is regressed against ETA, EFF, LASSET, RISK, ROA, PERSTEX, DEPTA, OBSA, EGRAW, CORRUPT and FREE. The result for ASEAN banks’ mean cost efficiency is 87.4%. On the interrelationship between bank’s cost efficiency, capital and risk-taking, the study finds that bank cost efficiency determines the capital position and risk-taking while banks’ capital position and risk-taking determine bank cost efficiency. It indicates that,
bank cost efficiency is the foundation for banks’ capital position and risk-taking.
Keywords: Bank cost efficiency, capital, risk-taking, ASEAN
1. INTRODUCTION
The importance of efficiency on the study of bank capital and risk-taking has been proposed by Hughes and Mester (1998). They suggested considering bank efficiency when analysing the relationship between capital and risk because both capital and risk are likely to be determined by the level of bank efficiency. For instance, supervisory authorities may allow efficient banks (with high quality management) a greater flexibility in terms of their capital leverage or overall risk profile, ceteris paribus. On the other hand, a less efficient bank with low capital may be tempted to take on higher risk to compensate for lost returns due to moral hazard considerations. However, the capital regulation and its impact on risk-taking behaviour may either increase or decrease efficiency. It means there is a bilateral relationship.
© Management Journals
h
ttp
//: www
.m
an
ag
em
en
tjo
u
rn
als.o
rg
2
Banking has moved faster from its traditional business. The banking business has moved from traditional deposit-taking and granting credit. Banking firms have moved beyond that. There is an important change in the product mix of banks especially in the large banks since the mid-1980s. Banks have started to engage in the off- balance sheet activities as a tool of risk management as well as increase in the demand of non-banking products as consequences of banks moving towards universal banking.
Banking basically manages risk. Banks generate revenue by taking on exposure to their customers and by earning appropriate returns to compensate for the risk of this exposure. In general, if a bank takes on more risk, it can expect to earn a greater return. The trade-off, however, is that the same bank will, in general, increase the possibility of facing losses to the extent that it defaults on its debt obligations and is forced out of business. Banks that are managed well will attempt to maximize their returns only through risk-taking that is prudent and well informed. The primary role of the risk management function in a bank is to ensure that the total risk taken
across the enterprise is no greater that the bank‟s ability to absorb worst-case losses within some specified confidence interval.
In contrast to a typical corporation, the key role of capital in a financial institution such as bank is not primarily one of providing a source of funding for the organization. Banks usually have ready access to funding through their deposit-taking activities. According to Matten (1996) and Porteus and Tapadar (2006), there are three functions of bank capital. First, capital provides a buffer that allows for the orderly disposal of assets and shields
debt holders from losses (protect depositors). Without an adequate buffer, assets might be sold in a “fire sale”
that would amplify the losses to depositors or the deposit insurance corporation. This is the risk sharing function of capital. Second, the fact that shareholders suffer the first loss gives the shareholders, or the managers acting on their behalf, an incentive to avoid unnecessary risks. This is the incentive function of capital. As capital is net worth, it can absorb large unexpected losses. Three, capital provides enough confidence to external investors and rating agencies on the financial health and viability of the firm.
Capital is the cornerstone of a bank‟s strength. The presence of substantial capital re-assures creditors and increases confidence in a bank. In general, essential characteristics of capital are: representing a permanent and unrestricted commitment of funds; freely available to absorb losses and thereby enable a bank to keep operating whilst any problems are resolved; not requiring any charge on the earnings of the bank, that is below the claims of depositors and other creditors in the event of bankruptcy.
In theory however, the impact of capital regulation bank risk-taking is not clear. On one side, capital regulation will not have an impact on bank risk-taking because when more capital is binding, the owner of the bank will view it as reducing the return on investment. These will reduce the value of the bank, widely known as charter value. To compensate these developments, banks managers are asked to generate more profit. This is only achieved by increasing risk-taking.
On the other hand, bank capital regulation is effective for reducing bank risk-taking. It is because bank managers are required to provide more capital when they take more risk. As capital requirement is linked to the risky assets held by banks, it means higher risk, more capital. It is more effective when regulatory arbitrage is not possible. Jacques and Nigro (1997) analyse the relationship between bank capital, portfolio risk, and the risk-based capital standards. The results suggest that the risk-based capital standards were effective in increasing capital ratios and reducing portfolio risk in commercial banks. The results also suggest that the risk-based capital standards brought about significant increases in capital ratios and decreases in portfolio risk of banks which have already met the new risk-based standards. Risk-based capital-constrained banks also experienced increases in their capital ratios, and reductions in portfolio risk, and although the results suggest that the risk-based capital standards played a significant role, their responses showed surprisingly little connection to the
degree to which they fell short of the standards
.
Therefore the objective of this this paper is to investigate the importance of bank cost efficiency on capital and risk-taking of banks in six countries in the Association of the Southeast Asian Nations (ASEA that is, Indonesia, Malaysia, Singapore, Thailand, the Philippines and Vietnam. The rest of the paper is organized as follows. Section 2 reviews the literatures related to the relationships between bank cost efficiency, capital and risk-taking in banking. Section 3 discusses the data and methodology and Section 4 discusses the findings of the study and Section 5 concludes.
2. LITERATURE REVIEW
ttp
//: www
.m
an
ag
em
en
tjo
u
rn
als.o
rg
cost function is 70.1 %. When the country effect is included, the cost efficiency increases to 73.5 %. For the translog profit functions, the average is 50.1 % and when the country effect is included, the efficiency ratio increases to 57.6 %.
In the second-stage regression, they use the efficiency measures along with return on assets to investigate the influence of ownership type which consists of foreign strategic, other majority foreign, government-owned and international participation. They found that the impact of ownership, privatization, is not sufficient to increase bank efficiency as government-owned banks are not always less efficient than domestic private banks. However, foreign-owned banks are more cost efficient than other banks. In terms of services, foreign banks provide better service, in particular if they have a strategic foreign ownership. The remaining government-owned banks are less efficient in providing services, which is consistent with the hypothesis that the better banks were privatized first in transition countries.
In contrast to other bank performance measures, foreign banks with a strategic ownership earn an average return on average assets (ROA) that is at least twice the ROA for all other ownership categories. In addition, banks with international participation earn twice again as high an average ROA compared with all foreign-owned banks having a strategic investor. When ROA is considered, majority government-owned banks have the highest average followed by foreign-owned banks with a strategic investor. The mean return on equity (ROE) for other foreign-owned banks is negative, which may reflect the weak situation of banks involved recently in the privatization process. Nonetheless, banks in which an international institutional investor participates have an average ROE about twice as high as foreign-owned banks with a strategic investor. Hence, institutional investors participate mainly in banks that deliver a high return on their investment, which may justify the higher cost ratio found for these banks. Finally, the average net interest margin does not differ much across ownership groups or by international institutional participation.
Turning to the impacts of foreign ownership and the participation of international institutional investors on bank efficiency, both have a significant positive effect on cost and profit efficiency in the preferred regressions, although the coefficient for strategic foreign ownership is not significant for profit efficiency. Looking across specifications, the significant positive impact on efficiency of having majority foreign ownership relative to private domestic banks is robust for both efficiency measures. However, the positive impact of an international institutional investor is robust at the 5% significance level for profit efficiency only and that of the strategic foreign owner is robust by the same criterion for cost efficiency only. Hence, Bonin, Hasan and Wachtel (2005) find strong statistical evidence for a positive impact, relative to domestic private banks, of having majority foreign ownership on both measures of efficiency and of having a strategic foreign owner on cost efficiency. They also find strong statistical support that having an international institutional investor generates an additional positive impact on profit efficiency.
Micco, Panizza & Yanez, (2007) study the relationship between bank ownership and bank performance. By comparing the ownership and the country where banks are operating, developing and industrial countries, they found that state-owned banks located in developing countries were less profitable than their private counterparts in industrial countries. On the election cycles, the study found that the difference between the performance of public and private banks increases during election years indicating the impact of politics. In contrast to the bank performance, the study found that during election years, increase in bank lending is due to an increase in the supply of loans by state-owned banks.
The state-owned banks located in developing countries tend to have lower profitability and higher costs than their private counterparts, and the opposite is true for foreign-owned banks. The paper finds no strong correlation between ownership and performance for banks located in industrial countries. To test whether the differential in performance between public and private banks is driven by political considerations, the paper checks whether this differential widens during election years: it finds strong support for this hypothesis. On the impact of democracies and dictatorships, there is no clear difference.
Dacanay (2007) examines the profit and cost efficiency of commercial banks in the Philippines from 1992 –
ttp
//: www
.m
an
ag
em
en
tjo
u
rn
als.o
rg
In this study, two-stage procedures are employed. The first method involved the estimation of profit and cost efficiency using the stochastic frontier analysis (SFA). The study employs the parametric translog stochastic frontier approach (SFA) to estimate the profit and cost function. The translog functional from originally from Christensen, Jorgenson and Lau (1971) is applied.
In this step, the study indicates that profit efficiency slowly decreased from a mean score of 92% in 1992 to 84% in 2004 while cost inefficiency scores are around 11% to 12% from 1992 to 1998. During and after the Asian crisis, the inefficiency jumps to 14% and 15% from 1998 to 2004. Efficiencies are found to be inversely related to asset size. Off-balance-sheet services are found to be cost absorbing, and substitutes for traditional banking products. Elasticity of the cost of labour and deposits are found to be negative, providing evidence for the use of more and low cost labour and the abundance of deposits as cheap sources of funds.
The second-stage regression shows profit efficiency scores of universal banks are significantly higher than simple commercial banks, suggesting scope economies from expanded and equity investment activities of universal banks. Foreign banks are more cost inefficient due to higher personnel cost. A modest improvement in bank efficiency after liberalization in 1994 is registered but cost inefficiency increased in the aftermath of the Asian financial crisis. Acquired banks in mergers are not necessarily inefficient, and the weighted efficiency scores of the acquired and surviving banks before the merger had not improved three years after the merger, suggesting that synergy gains need a longer time to be realized.
In a study by Altunbas, Carbo, Gardener & Molyneux (2007), using data of European banks during the period 1992-2000, report that banks with more capital tend to be less efficient and to take on excessive risk. They suggest that inefficient European banks do not seem to have an incentive to take on more risk. Stronger empirical evidence is found showing the positive relationship between risks on the level of capital, possibly
indicating regulators‟ preference for capital as a mean of restricting risk-taking activities. They also find evidence that the financial strength of the corporate sector has a positive influence in reducing bank risk-taking and capital levels. There are no major differences in the relationships between capital, risk and efficiency for commercial and savings banks although there are for co-operative banks. In the case of co-operative banks they find that capital levels are inversely related to risks and inefficient cooperative banks hold lower levels of capital.
Shen, Liao & Weyman-Jones (2009) conducted a comparative study of the banking industry across ten countries in Asia. The background is whether differences in inefficiency attributed to the managerial ability of the banks only or partly attributable to the different characteristics of countries. Under the rules and obligations set by the World Trade Organization (WTO), China was to open up its financial and banking system by 2007. This liberalization allows foreign banks to open more branches freely in China and offers local currency (RMB)
business to Chinese citizens. Therefore, Chinese banks now have to compete against the world on a “level
playing-field” without the benefit of a government protective umbrella. The study covers 280 commercial banks
from ten major Asian banking industries. Cost efficiency is estimated using the stochastic frontier approach (SFA).
The study found that the overall cost efficiency in these Asian banking industries is 59% with a decreasing trend, despite positive technical progress and slight economies of scale. It is possible that during the post-crisis financial reform and reconstruction of the banking system, attempts to reduce the large volume of NPLs and to improve asset quality led to a decline in the loan output with given input usage leading to a decrease in efficiency scores. In addition, mergers and acquisition between healthy banks and troubled banks, forced by governments, may have led to a decline in the performance of commercial banks during the sample period.
When comparing efficiency scores country by country, they found that India, Singapore, Malaysia and Hong Kong SAR appear to have the most efficient banking industries in Asia. China ranks fifth, with a cost efficiency score of 59%, suggesting that Chinese banks need further development of the banking system if they are to compete strongly against foreign Asian banks. One policy recommendation is to speed up deregulation and privatization. In particular, reduction of state ownership in the largest five state-owned banks should be pursued as these banks were outperformed by the joint-stock owned banks by twenty-five %age points. Other policy suggestions are to adopt the Basel capital adequacy ratio, to ensure asset quality, strengthen prudential regulation and enhance risk management and credit assessment to reduce the volume of non-performing loans (NPLs).
ttp
firms accessed funding through alternative financing channels and governance mechanisms, including those
based on „information from reputations and relationships‟. In addition, the authors suggest that an inefficient banking sector and poor legal/financial infrastructure may already be restraining growth and development in China. Reform of the Chinese banking industry is also important because of the size of this industry and its level of inefficiency.
Lin, Lin & Mohanty (2009) study the bank cost and profit efficiency in Taiwan and China and their determinants. The efficiency measurement is performed using the SFA. The Tobit regression is used to estimate the determinant of bank efficiency across countries. The hypotheses of the study is whether cost efficiencies are dynamically and stochastically changing through time, and that the cost efficiency of commercial banks is affected by three types of exogenous variables namely firm-specific, performance variables and macroeconomic variables. The banks in Taiwan are operated more allocative and profitably efficiently, but less scope-economically from costs and profits, than their counterparts in China. The implication of the study is the cost efficiency, the profit efficiency, and the economy of scope must be used jointly to bring about a reliable assessment on the performance of a bank.
Berger, Hasan & Zhou (2009) analyze profit and cost efficiency using 266 annual observations over 1994–
2003 on thirty-eight commercial banks in China with different majority ownership – Big Four, non-Big Four
state-owned, private domestic, and foreign. The data covers 95% of the commercial banking assets in the country. Their empirical results suggest strong favorable efficiency effects from reforms that reduce state ownership of banks in China and increase the role of foreign ownership. The Big Four are by far the least profit efficient, due in large part to poor revenue performances and high non-performing loans. The majority of
foreign banks are the most profit efficient, so shifting resources from state-owned banks – particularly the Big
Four –to foreign ownership is likely to raise China‟s banking system efficiency.
The study also revealed the effects of minority foreign ownership on the efficiency. There is a gain for the receiver for this type of foreign investment. The profit and cost efficiency increase for both categories of domestic ownership that have minority foreign ownership (non-Big Four state-owned and private domestic). It means that the minority foreign ownership is associated with higher efficiency. Considering the selection effects, they confirm that efficiency increases not because of selecting efficient Chinese banks in which to invest but due to knowledge transfer from investors.
Fiordelisi, Marques-Ibanez & Molyneux (2010) also find evidence that efficiency reduces risk-taking and capital improve efficiency suggesting that better capital reduce moral hazard incentives. Cost efficiencies are also found to positively Granger-cause bank capital, meaning that more efficient banks seem to eventually become better capitalized and higher capital levels also tend to have a positive effect on the efficiency levels.
When the risk is measured by ex post credit risk (NPL), the study finds only limited evidence of relationships
between capital and risk position in line with the moral hazard theory. In general, researchers support the prudential perspective of banking operation that lower efficiency scores suggest greater future risks and
efficiency improvements tend to shore up banks‟ capital positions. The study implies the importance of attaining
long-term efficiency gains to support financial system stability.
From the above discussion, we can infer that risk-taking is positively influenced by bank regulation, rule of the law, group affiliation, capital, existence of deposit insurance, accounting regime and liquidity position. On the other hand, risk-taking is negatively influences by size, stable ownership, managerial ownership, profitability, abnormal loan growth, capital and gross domestic product (GDP) growth. These results provide foundation to estimate the impact of bank specific and environmental variables on bank risk-taking using ASEAN banking market which are still lacking.
3. DATA AND METHODOLOGY
To calculate the efficiencies, a standard translog cost function, we follow Molyneux, Altunbas & Gardener (1996) incorporating a two-component error structure that depicts error and efficiency. Estimation is conducted using a maximum likelihood procedure. The efficiency model is written as follows:
ttp
//: www
.m
an
ag
em
en
tjo
u
rn
als.o
rg
where TC is total cost, comprising operating cost and financial cost (interest paid on deposits), Q1 are total
loans, Q2 are total earning assets, P1 the average annual wage expenses per branch, P2the average interest cost
per dollar of interest-bearing deposits, P3 the average price of other expenses, calculated as the ratio of total
other expenses to total fixed assets, e the stochastic error term and
,
,
,
,
,
v
and
are coefficients to beestimated.
Following the discussion on the stochastic cost frontier models which will be utilized to estimate efficiency scores for the ASEAN banking sector, the following definitions of the output and input (price) variables are used. In this study the definitions of variables are quite straightforward and mostly follow common definitions.
These are:
i. Total cost is total operational cost of banking firm excluding non-operational cost.
ii. Outputs are loan and other earning assets.
iii. Price of interest is measured by total interest expenses divided by total deposits.
iv. Price of labour is total personnel expenses divided by total assets.
v. For price of fixed asset, we simplify it by using other operating expenses divided by fixed assets.
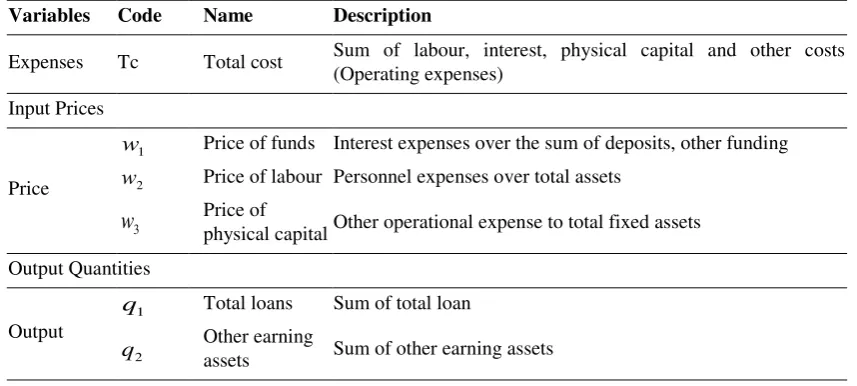
We simply use this definition to solve the data availability. As the financial data is published on respective currency, we adjust it using US dollars without making any dollar adjustment (deflation adjustment). All the data are in ratios except productive asset (Q) and TC which are in logarithms. Table 1 presents the definition of the variables.
Table 1: Definition of the Variables
Variables Code Name Description
Expenses Tc Total cost Sum of labour, interest, physical capital and other costs
(Operating expenses)
Input Prices
Price
1
w Price of funds Interest expenses over the sum of deposits, other funding
2
w Price of labour Personnel expenses over total assets
3
w
Price ofphysical capital Other operational expense to total fixed assets
Output Quantities
Output
1
q Total loans Sum of total loan
2
q Other earning
assets Sum of other earning assets
We base our study from previous empirical findings on the relationship between bank cost efficiency, capital and risk-taking underlined the fact that efficiency is a key component for bank management. Their interrelationship is jointly determined by a system of equations. To assess this interrelationship among bank cost efficiency, capital and risk-taking, the method of instrumental variables (IV) estimation is used. This approach is particularly important to encounter the problem related to Ordinary least Square (OLS) regression. As among
efficiency, capital and risk may be “endogenous”, meaning the OLS regression model if used will be bias.
To perform the IV regression, we use Three-stage Least Squares (3SLS). The term 3SLS refers to a method of
estimation that combines system equation, sometimes known as seemingly unrelated regression (SUR),
with stage Least Squares (2SLS) estimation. The Three-stage Least Squares method generalizes the Two-stage Least Squares method to take into account the correlations between equations in the same way that SUR generalizes OLS. Zellner and Theil (1962) introduced the Three-stage Least Squares estimator.
The Three-stage Least Squares (3SLS) estimates all coefficients simultaneously and assumes that each equation of the system is at least just identified. In the classical specification, although the structural disturbances may be
correlated across equations (contemporaneous correlation), it is assumed that within each structural
ttp
//: www
.m
an
ag
em
en
tjo
u
rn
als.o
rg
implies that the disturbance covariance matrix within each equation is diagonal, whereas the entire system‟s
covariance matrix is not diagonal. The Zellner-Theil 3SLS estimator for the coefficient of each equation is asymptotically at least as efficient as the 2SLS. Amemiya (1973) has extended the 3SLS estimator for estimation of a nonlinear system of simultaneous equations. Hausman (1983) provides an excellent discussion of 3SLS estimation, including a formal derivation of its analytical and asymptotic properties, and its comparison with full-information maximum likelihood (FIML).
To assess these interlinks, we apply simultaneous equation models of bank cost efficiency, capital and risk-taking. Simultaneous equations are a statistical model in the form of a set of linear simultaneous equations that is established. It is used in the analysis of structural equations. It is the extension of the OLS method with
additional assumption that the dependent variable‟s error terms are correlated with the independent variables.
Estimation is carried out using the maximum likelihood method.
The assumption that bank cost efficiency, capital, and risk-taking decisions are made simultaneously and are interrelated implies that there are causal relationships. In a regression setting, it is against the fundamental
assumption OLSs estimations that the error term is unrelated to the regression (E(ux)0.). It means the OLS
method is inconsistent and no longer gives causal interpretation.
To solve the problem, we need the instrumental variable (IV) approach. It is useful to estimate the parameters when endogenous regression and errors in variable models are unavoidable. Fundamentally, there is a regression
model where the dependent variable у is regressed on a single regression x:
y
u
2
As the model is without the intercept, both
y
and X are measured as deviations from their respective means. Thesimple regression model assumes that x on y is a direct effect via the term
x
. Schematically, we have thefollowing path diagram:
x y
u
The absence of a directional arrow from u to x, means that there is no association between x and u. Then the
OLS estimator
i i i i
i xy x
2
/
is consistent for
if the error u embodies all factors other than x thatdetermine y
earnings. One such factor is u. If u and x are highly correlated then the most appropriate relationship is:
x y
u
The introduction of the existence of association between x (predictor) and u (error), the OLS estimator is then
inconsistent for
, because combines the desired direct effect of x(
)
with the indirect effect of u.We now consider the more general model with the scalar dependent variable y1, which depends on m
endogenous regressors, denoted byy2, and K1 exogenous regressors (including an intercept), denoted byx1.
This model is called a structural equation, with
N i u x y
y1i 2i1 1i2 i1 1,...., 3
The regression errors ui are assumed to be uncorrelated with X1I but are correlated with
y
2i. Thiscorrelation leads to the OLS estimator being inconsistent for
.
We can rewrite Equation 3:yiXiui 4
Where the regressor vector Xi
y2ix1i
combines endogenous and exogenous variables, and the dependentttp
//: www
.m
an
ag
em
en
tjo
u
rn
als.o
rg
i-th equation into T-dimensional, then Yi and εi are T×1 vectors, Xi is a T×ki matrix, and βi is a ki× 1 vector. The
matrix equations imply that error terms εit are independent across time and allow cross-equation
contemporaneous correlations.
This study assumes that bank decision-making is not a single process but simultaneously and influenced by many factors. This assumption underlines that capital and risk decisions are made simultaneously and influenced
by the bank cost efficiency level. Previous studies such as Shrives and Dahl (1992) and Altunbas et al. (2007)
are the foundation of this study on the relationship between bank cost efficiency, capital and risk-taking.
However, the results are not all compatible. Altunbas et.al. (2007) conclude that efficiency and capital is
interlinked and Fiodelisi, et.al. (2010) found unilateral relationship
.
To allow for simultaneity between banks‟ efficiency, capital and risk-taking, a system of equations is being used and estimated using 3SLS approach. We use 3SLS to solve the endogeneity problem. The OLS estimators will produce an inconsistent result and thus the use of a simultaneous equation specification is unavoidable. In this
study which is similar to Altunbas, et. al. (2007), we modify the approach by using the level rather than the
difference to accommodate the data. Table 2 presents the empirical model for the three-stage least squares to estimate the interrelationship between efficiency, capital and risk-taking.
To estimate Equation (1), Equation (2) and Equation (3) we treat EFFICIENCY, CAPITAL, RISK-TAKING as instrumental variables. As the Three-stage Least Squares (3SLS) are available in STATA version 10, we use this software to estimate the regression equation. The use of 3SLS is necessary as it will avoid simultaneous bias for estimated coefficients if the calculation is performed individually.
Equation I in Table 2 employed cost efficiency (EFF) as dependent variable. The independent variables are: logarithmic of asset size (LASSET), equity to total asset (ETA), loan to total asset ratio (LTA), loan losses provision to total loan (RISK), personnel expenses to total expense (PERSTEX), fixed asset to total asset ratio (FIXTAS), cost to income ratio (CIR), annual economic growth (EGRW), corruption index (CORRUPT) and finally economic freedom index (FREE). Variable ETA is treated as instrumental variable or endogenous for Capital and LTA for instrumental variable or endogenous variable for risk-taking.
Equation 2 employed capital (ETA) as dependent variable. The independent variables are: loan to total asset ratio (LTA), cost efficiency (EFF), logarithmic of asset size (LASSET), loan losses provision to total loan (RISK), Off-balance sheet activities to total asset (OBSA), cost to income ratio (CIR), fixed asset to total asset ratio (FIXTAS), return on asset (ROA), annual economic growth (EGRW), corruption index (CORRUPT) and finally economic freedom index (FREE).
Equation 3 employed risk-taking (LTA) as dependent variable. The independent variables are: equity to total asset (ETA), cost efficiency (EFF), logarithmic of asset size (LASSET), loan losses provision to total loan (RISK), return on asset (ROA), personnel expenses to total expense (PERSTEX), deposit to total asset (DEPTA), Off-balance sheet activities to total asset (OBSA), cost to income ratio (CIR), annual economic growth (EGRW), corruption index (CORRUPT) and economic freedom index (FREE). In this equation, ETA and EFF are treated as instrumental variables or endogenous variables for capital and efficiency respectively.
Table 2: Empirical Model of the Three-Stage Least Square (3SLS)
Equation Dependent Variable Model
Equation 1 EFFICIENCY (EFF)
EFF= α0 + α1ETA + α2 LTA + α3LASSET + α4 LDR +
α5 RISK + α6 PERSTEX + α7 FIXTAS + α8CIR + α9
EGRW + α10CORRUPT + α11 FREE + µ
Equation 2 CAPITAL (ETA)
ETA = α0 + α1LTA + α2 EFF + α3LASSET + α4 RISK +
α5OBSA + α6 CIR + α7FIXTAS + α8 ROA + α9 EGRW
+ α10CORRUPT + α11 FREE + µ
Equation 3 RISK-TAKING (LTA)
LTA = α0 + α1ETA + α2 EFF + α3LASSET +α4 RISK +
α5 ROA + α6PERSTEX + α7 DEPTA + α8 OBSA +
ttp
//: www
.m
an
ag
em
en
tjo
u
rn
als.o
rg
Our sample is an unbalanced panel which consists of 633 observations from six countries in ASEAN over the period from 2003 to 2008. This period is chosen to prevent the impact of 1998 Asian Financial Crisis in our analysis. Data is derived from annual financial reports published in Fitch IBC Bankscope database subscribed by Universiti Sultan Zainal Abidin (UniSZA). Indonesia was relatively slower to revive crisis and banking restructuring was regarded finishing in 2002 after the sale of Bank Niaga to Commerce Asset Holdings Berhad (CAHB), known as CIMB Group Holdings Berhad. That is the reason to choose 2003 as the beginning of the study. The data for bank specific variables is obtained from BankScope while the data for environmental variables is taken from Asian Development Bank (ADB), Heritage Foundation and International Transparency (IT).
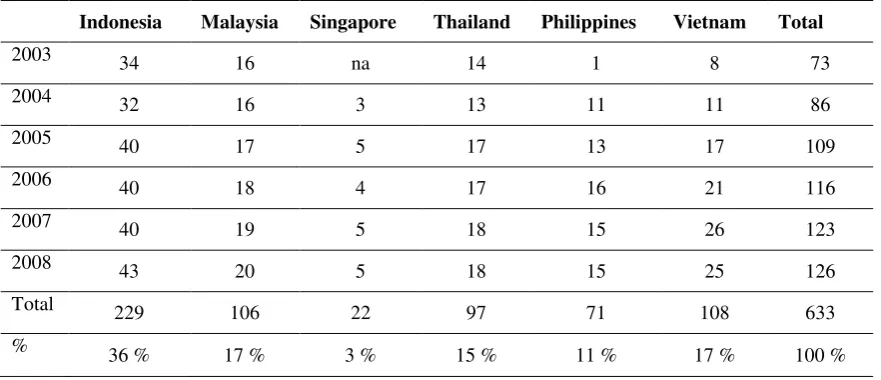
Table 3 presents the bank sample distribution for this study. Total samples in this study are 633 observations from six countries. These countries are Indonesia, Malaysia, Singapore, Thailand, Philippines and Vietnam. The time period spans from 2003 to 2008.
Table 3:Bank Samples Distribution
Indonesia Malaysia Singapore Thailand Philippines Vietnam Total
2003 34 16 na 14 1 8 73
2004 32 16 3 13 11 11 86
2005 40 17 5 17 13 17 109
2006 40 18 4 17 16 21 116
2007 40 19 5 18 15 26 123
2008 43 20 5 18 15 25 126
Total 229 106 22 97 71 108 633
% 36 % 17 % 3 % 15 % 11 % 17 % 100 %
Source: Bankscope Database
4. RESULTS AND DISCUSSION 4.1 Efficiency scores
Table 4 presents the efficiency scores estimated using maximum likelihood SFA model. To obtain efficiency scores for comparison purposes, we convert inefficiency estimates scores to get scores between 1 and 0. This effort involves converting inefficiency measure from SFA to efficiency score. The most efficient bank has a score of unity and zero denotes the least efficient bank. To do this we use conversion formula by dividing 1 (theoretically efficient) with efficiency score from SFA.
Table 4: Descriptive Statistics of Efficiency Scores from SFA Model
Sample Mean Std. Dev. Min Max
Efficiency Score 633 1.253 0.392 1.029 4.909
Efficiency (Converted) 633 0.874 0.046 0.594 0.972
The mean for inefficiency is 1.253 or inefficiency is around 25%. After transformation, the efficiency score is 87%. It means on average the sample can achieve 87 % efficiency leaving a 13 % opportunity for improvement. The standard deviation is 4.6% meaning that the efficiency score standard deviation is around 4.6% of the mean value 87%. The minimum efficiency score is 59 % and the maximum efficiency score is 97%.
4.2 Interrelationships between Efficiency, Capital and Risk-Taking
As mentioned earlier we employed three-stage least square (3SLS) method to estimate the interrelationship between efficiency, capital and risk-taking in ASEAN banking. We use STATA version 10 to perform the estimation. There are three equations in the system: Efficiency equation to indicate bank cost efficiency (Equation 1), Capital Equation to measure the strength of the capital position (Equation 2) and Risk-taking
ttp
//: www
.m
an
ag
em
en
tjo
u
rn
als.o
rg
For this estimation, 633 observations are used in the system of equation and this is presented in Table 5. Equation I used eleven predictors and results in R-squared of 99%. It means the predictors can explain 99% of the variability of bank cost efficiency. The Chi-Squared is 85727 and significant at 1%. We can conclude that at least the predictor is capable of explaining the variability of the bank cost efficiency. Equation 2 used eleven predictors in the estimation. The result of the R-squared is 79% and Chi-Squared is 2750. It means that the model can explain 79% of the capital position. The Chi-Squared is significant at 1%. In general, we can conclude that the model is capable of explaining the capital position of ASEAN banking samples. Equation 3 included eleven predictors. The R-squared is on 11% indicating that model can explain 11% of the risk-taking variability. The Chi-Squared is 2248 and significant at 1%. In general, the system of equation covering EFFICIENCY, CAPITAL and RISK-TAKING is capable for use as a model of the interrelationship between banks cost efficiency, capital and risk-taking for ASEAN banking.
Table 5: System of Equation Fitted Indicator
Equation Instrumental
Variable Obs Parms RMSE R-square Chi-square Prob
1 EFFICIENCY 633 11 0.085 0.99 85727 0
2 CAPITAL 633 11 0.072 0.79 2750 0
3 RISK-TAKING 633 11 0.528 0.11 2248 0
Source: Results from Stata
4.2.1 Efficiency Equation (Equation 1)
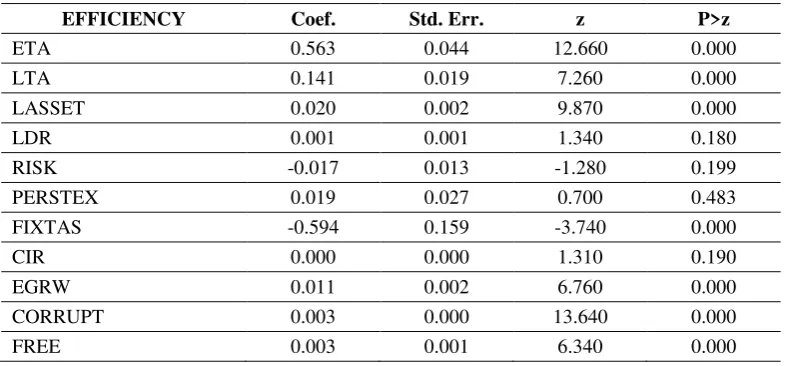
The results for Equation 1 as in Table 6 show that Capital (ETA) is positive and is significant at 1% indicating that well-capitalized banks are more cost efficient than under-capitalized banks. Risk-taking (LTA) is positive and significant indicating that banks that perform their role as a financial intermediary are more efficient. LASSET is positive and significant at 1%. It is clear that cost efficiency benefit from economies of scale is unchallenged. Variable RISK (ex-post risk) is negative but insignificant. PERSTEX is positive although not significant. Variable FIXTAS is negative and significant suggesting that higher fixed asset in the banking book reduces efficiency. Economic freedom (FREE) is positive and significant, indicating the importance of freedom for efficiency. Economic growth (EGRW), corruption index (CORRUPT) and economic freedom (FREE) are positive and significant. These suggest that higher economic growth and economic freedom contribute positively to bank cost efficiency. Interestingly, on corruption, this contradicts to the established views that corruption is harmful to business. It seems corruption is beneficial in ASEAN banking and enhances efficiency
at least at the micro level. Leff (1964) concludes that in many cases, corruption is a way to circumvent
inefficient government regulations. When such a regulation can be managed, business can be performed at a cheaper cost compared to following the regulation. Cazurra (2006) studies the impact of corruption on foreign direct investment (FDI) and finds that corruption is partly beneficial. However, the finding is inconsistent with Dal Boa & Rossi (2007) using an electric company in Latin America. They find that more corruption in the country is strongly associated with more inefficient firms. This can be seen as they employ more inputs to produce a given level of output.
Table 6: Results on Efficiency Equation (Equation 1)
EFFICIENCY Coef. Std. Err. z P>z
ETA 0.563 0.044 12.660 0.000
LTA 0.141 0.019 7.260 0.000
LASSET 0.020 0.002 9.870 0.000
LDR 0.001 0.001 1.340 0.180
RISK -0.017 0.013 -1.280 0.199
PERSTEX 0.019 0.027 0.700 0.483
FIXTAS -0.594 0.159 -3.740 0.000
CIR 0.000 0.000 1.310 0.190
EGRW 0.011 0.002 6.760 0.000
CORRUPT 0.003 0.000 13.640 0.000
FREE 0.003 0.001 6.340 0.000
ttp
//: www
.m
an
ag
em
en
tjo
u
rn
als.o
rg
4.2.2 Capital Equation (Equation 2)
Table 7 presents the regression results for capital equation (Equation 2). Capital in this equation is equity to total asset (ETA). Two instrumental variables are used to estimate the determinants of capital position: risk-taking (LTA) and cost efficiency (EFF). We use ETA to measure capital because it is simple and free from measurement error compared to risk-based capital. Instrumental variable for the cost efficiency (EFF) is positive and significant implying that higher cost efficiency tends to increase capital position of the banks and this suggests that higher cost efficient banks have strong capital position. The coefficient for size (LASSET) is negative and significant at 1%. It is rational because large banks enjoy a strong position in the market that
provides them with the capability to take risky positions without providing more capital. Theory “too big to fail"
(TBTF) supports this argument. This finding is not new as Liang & Rhoades (1991) and McAllister & McManus (1993) also find that large banks operate with lower capital ratios to pursue riskier activities. Lee (2008), using the cross-sectional data of Korean banks before and after the regulation of the banking industry was tightened in late 1997, finds significant evidence that large banks have very aggressive risk-taking incentives. After deregulation as a response to the Asian crisis in 1997, the tendency to take excessive risk is
reduced.
We find that the coefficient of ROA is positive and significant at 1%. We can infer that ROA has a positive impact to capital. This finding is in contrast to Ahmad, Ariff & Schully (2008) who found that bank capital decisions seem not to be driven by bank profitability. Their results are different because they use different measure of bank capital. The variable for economic growth (EGRW) is negative and significant at 1%. The negative sign indicates that during period where economy grows, demand for loan increases and leverage bank asset. It makes the equity to total asset (ETA) decreases. It also meant that capital in ASEAN is convergent as all are BASEL II adopter. The variable CORRUPT is negative and significant at 1% and this suggests that when the country where a bank operates has higher corruption index, the bank tends to have lower capital. We can interpret that banks prefer to put less capital when the corruption level is high. Economic freedom (FREE) is however not significant.
In general, the finding is in line with Brewer, Kaufman & Wall (2009) that bank capital ratio is a function of public policy, regulatory, bank specific, macroeconomic and country level financial conditions. We can conclude that capital determination is not only related to bank specific variables but involves external economic, regulatory as well as economic factors. In certain situations, rating company and peer group also influence the capital position of the banking firms (Schooner & Taylor, 2010).
Table 7: Results on Capital (Equation 2)
CAPITAL Coef. Std. Err. z P>z
LTA 0.079 0.056 1.410 0.16
EFF 0.779 0.096 8.080 0.00
LASSET -0.031 0.002 -15.720 0.00
RISK 0.035 0.018 1.900 0.06
OBSA -0.002 0.002 -0.620 0.54
CIR 0.000 0.000 0.510 0.61
FIXTAS 0.157 0.198 0.800 0.43
ROA 2.211 0.247 8.950 0.00
EGRW -0.009 0.002 -4.040 0.00
CORRUPT -0.002 0.000 -4.440 0.00
FREE 0.000 0.001 0.060 0.95
Source: Estimation Results
4.2.3 Risk-Taking Equation (Equation 3)
The risk-taking equation (Equation 3) examines the effects of capital, asset size, and efficiency, ex-post risk,
ttp
//: www
.m
an
ag
em
en
tjo
u
rn
als.o
rg
are consistent with the agency cost and moral hazard hypothesis that less capital institutions take on more asset risk. The results are presented in Table 8. The coefficient for ETA is negative and significant at 1%. It indicates that capital is an important determinant of risk-taking. The result implies that a higher capital position encourages banks to take more risks. The result is consistent with Stolz, Heid & Porath (2003). The coefficient for efficiency is positive and significant at 1%. This suggests that bank cost efficiency influences the willingness of banking firms to take more credit risk. The finding underlines the assumption that efficiency is very important to all aspects of bank management. Efficiency is the foundation for all banks to take action especially related to the risk-taking. Efficiency is necessary for banks to take more action although it may not be enough as for successful business risk-taking strategy banks also require qualified staffs, good system information and strategic market position. Furthermore, banks need better risk management in place. The finding confirms the importance of efficiency as a foundation for risk-taking.
On the asset side, we find that size of bank (LASSET) has a negative impact on risktaking. The coefficient is -0.199, SE 0.027, z-Statistics -7.430 and significant at 1%. This suggests that large banks tend to take lower risk. The coefficient for RISK (ex-post risk) is negative but not significant. The coefficient for ROA is positive and significant at 1% implying that risk-taking is related to ROA. Higher risk-taking is the opportunity to earn more profit. Higher ROA tends to be followed by higher risk-taking indicating the existence of profitability pressure where previous high profit forces the bank manager to earn another higher profit in the future. Variable PERSTEX, measured by total personnel expenses to total expenses, has a positive coefficient (0.362), SE 0.174, z-Statistics 2.080 and significant at 5%. This finding is in line with Diamond & Rajan (2009) who pointed out the compensation structure (included in personnel expenses) increases risk-taking because the performance of CEOs is evaluated based in part on the earnings they generate relative to their peers. With this pressure, executives have incentives to take excessive risk to profit in the short run even if they are not truly value-maximizing. The empirical results also show that DEPTA has negative coefficient (-1.286), SE 0.305, z-Statistics -4.220 and significant at 1%. The result is opposite to the theory of financial intermediation which postulates higher deposits increased loan size, as deposits are basically input to produce loans. The bank can only produce loans if it can generate deposits from the public. The result appears to go against this assumption. A negative sign may indicate that banks are very careful to provide loans as the maturity of deposits are very short. Relying on non-deposits to produce longer term loans can inhibit liquidity and market risk. The coefficient for OBSA is negative and significant at 1%. It means higher OBSA reduces bank capital position and can be viewed as a way to reduce capital. The coefficient for EGRW is negative and significant indicating that during period where economy grows, demand for loan increases and leverage bank asset. The variable CORRUPT is negative and significant at 1% and this suggests that when the country where a bank operates has higher corruption index, the bank tends to take less risks.
Table 8: Results on Risk-taking (Equation 3)
RISK-TAKING Coef. Std. Err. Z P>z
ETA -7.656 1.141 -6.710 0.00
EFFIEX01 7.033 0.727 9.680 0.00
LASSET -0.199 0.027 -7.430 0.00
RISK -0.071 0.071 -1.010 0.32
ROA 10.085 1.808 5.580 0.00
PERSTEX 0.362 0.174 2.080 0.04
DEPTA -1.286 0.305 -4.220 0.00
OBSA -0.040 0.012 -3.400 0.00
EGRW -0.048 0.009 -5.250 0.00
CORRUPT -0.010 0.001 -8.100 0.00
FREE 0.000 0.004 0.040 0.96
Source: Estimation Results
ttp
//: www
.m
an
ag
em
en
tjo
u
rn
als.o
rg
From the capital equation (Equation 2), three bank specific variables are significant. These are EFF, LASSET and ROA. EFF is positive indicating cost efficiency will increase capital. The coefficient for LASSET is negative and significant meaning large banks own less capital ratio. ROA is positive indicating higher profitable banks own higher capital ratio.
For risk-taking equation (Equation 3), the coefficient for ETA is negative and significant indicating higher capital ratio banks take less risk. On the cost efficiency, efficient banks take higher risk. Profitable banks (ROA) take higher risk supporting the fact that lending is the core business in ASEAN banking. Large banks take less risk. Banks that pay their personnel higher take more risk. Banks that rely on deposits have lower risk. Off-balance sheet activities reduce risk-taking. The corruption reduces bank risk-taking indicating that corruption increases credit risk.
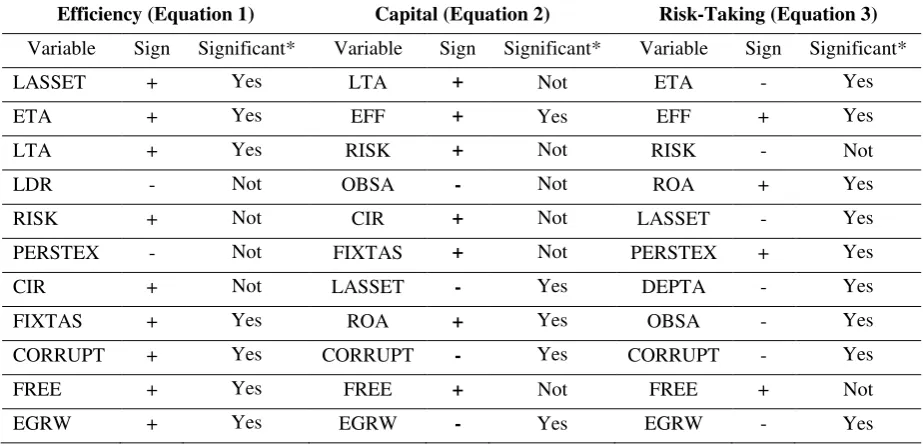
In general, we can conclude that bank efficiency is determined positively by capital, size, risk-taking, corruption, economic freedom and economic growth and negatively by liquidity. Capital is determined positively by efficiency, liquidity, profitability, and negatively by size and corruption and economic growth. On the other hand, risk-taking is determined positively by efficiency, profitability, and negatively by capital, size, deposit ratio, off-balance sheet activities, corruption and economic growth. These results underline the importance of bank cost efficiency for risk-taking and capital.
Table 9: Summary of the System Equation
Efficiency (Equation 1) Capital (Equation 2) Risk-Taking (Equation 3)
Variable Sign Significant* Variable Sign Significant* Variable Sign Significant*
LASSET + Yes LTA + Not ETA - Yes
ETA + Yes EFF + Yes EFF + Yes
LTA + Yes RISK + Not RISK - Not
LDR - Not OBSA - Not ROA + Yes
RISK + Not CIR + Not LASSET - Yes
PERSTEX - Not FIXTAS + Not PERSTEX + Yes
CIR + Not LASSET - Yes DEPTA - Yes
FIXTAS + Yes ROA + Yes OBSA - Yes
CORRUPT + Yes CORRUPT - Yes CORRUPT - Yes
FREE + Yes FREE + Not FREE + Not
EGRW + Yes EGRW - Yes EGRW - Yes
*=At least 5%, + / - = positive or negative sign
5. CONCLUSIONS
The study finds that ASEAN banks, on average, exhibit a somewhat modest degree of cost inefficiency. The mean efficiency score for ASEAN banking is 87.4% indicating that there is 13% opportunity for improvement. We conducted a step by step comparison of the results and come to the conclusion that there is not much improvement in the ASEAN banking efficiency score. There is a tendency that the efficiency score on average tends to decrease especially in 2008 as the consequence of the global financial crisis (GFC) that brings negative consequences in the financial markets around the world. ASEAN financial market is also not immune to the crisis.
For the efficiency equation, asset, capital, risk-taking, fixed assets, corruption, freedom, and economic growth are positive and significant. For capital equation, efficiency, profitability, and freedom are positive and significant. Corruption, economic growth, and asset size are negative and significant. For the risk-taking equation, efficiency, profitability, and personnel expense to total expenses are positive and significant. Capital, asset size, deposits to total assets ratio, off-balance sheet activities, corruption, and economic growth are negative and significant.
ttp
//: www
.m
an
ag
em
en
tjo
u
rn
als.o
rg
not capital. In short we can infer that efficiency is the foundation for bank risk-taking and capital position. Risk-taking is not an important determinant for bank capital position. Higher capital banks tend to take less risk-taking.
The implication of this study underlines the importance of efficiency measure. Amidst different results of economic efficiency measurement, it is clear that the economic efficiency indicator can provide a better understanding of the banking firm economic condition. That makes it important to include economic efficiency as a component for a bank soundless indicator. Efficiency is significant for both risk-taking and capital underlining the capabilities of efficiency indicators for financial regulation and supervision. It will provide other measures of bank efficiency beyond financial and accounting information.
REFERENCES
Ahmad, R, Ariff, M & Skully, M.J. 2008. The Determinants of Bank Capital Ratios in a Developing Economy.
Asia-Pacific Finance Markets, No. 15:255–272
Altunbas, Yener, Carbo, Santiago, Gardener, Edward P.M. P.M. & Molyneux, Phil, 2007, “Examining the
Relationships Between Capital, Risk and Efficiency in European Banking”. European Financial
Management, Vol. 13, No. 1, pp. 49-70, January
Altunbas, Yener, Carbo, Santiago, Gardener, Edward P.M. P.M. & Molyneux, Phil, 2007, “Examining the
Relationships Between Capital, Risk and Efficiency in European Banking”. European Financial
Management, Vol. 13, No. 1, pp. 49-70, January
Amemiya, Takeshi .1973. "Regression Analysis When The Dependent Variable Is Truncated Normal",
Econometrica (The Econometric Society) Vol.41 No.6 pp. 997–1016
Berger, Allen N., Hasan, Iftekhar & Zhou, Mingming, 2009. "The effects of focus versus diversification on bank
performance: Evidence from Chinese banks," CEI Working Paper Series 2009-09, Center for Economic Institutions, Institute of Economic Research, Hitotsubashi University.
Bonin, John P. & Iftekhar Hasan and Paul Wachtel.2005. "Privatization matters: Bank efficiency in transition
countries," Journal of Banking and Finance, Elsevier, vol. 29(8): 2155-2178
Brewer, E. Kaufman, G. & Wall, L. 2009. “Bank Capital Ratios across Countries: Why Do They Vary?”
Journal of Financial Service Research, Vol.34(3): 177-201
Cazurra, A.C, 2006. “ Who Cares about Corruption?”, Journal of International Business Studies, Vol. 37(6): 807-822
Christensen, LR.,Jorgenson D.W. & Lau LJ.1971. "Conjugate Duality and the Transcendental Logarithmic
Production Function". Econometrics, No.39:225-56.
Dacanay, S. J. O. 2007. “Profit and Cost Efficiency of Philippine Commercial Banks Under Periods Of
Liberalization, Crisis And Consolidation,” The Business Review, Cambridge, Vol.7 (2): 315-322.
Dal Bó a, E. & Rossi, M.A. 2007. Corruption and inefficiency: Theory And Evidence From Electric Utilities,
Journal of Public Economics No. 91:939–962
Diamond Douglas W. & Rajan, Raghuram G. 2000. "A Theory of Bank Capital," Journal of Finance, American
Finance Association, vol. 55(6): 2431-2465.
Fiordelisi, F. & Marques-Ibanez, D. and Molyneux, P. 2011. "Efficiency and risk in European banking,"
Journal of Banking and Finance, Elsevier, vol. 35(5):1315-1326
Hausman, J.A. 1983. “Specification and Estimation of Simultaneous Equation Models,” in Z. Griliches and M.
Intriligator, editors, Handbook of Econometrics, Vol. 1, Amsterdam: North Holland.
Hughes, J.P. & Mester, L.J.1998.. Bank Capitalization And Cost: Evidence Of Scale Economies In Risk
Management And Signaling," The Review of Economics and Statistics, vol. 80(2):314-325
Jacques, K., Nigro, P., 1997. Risk-based Capital, Portfolio Risk and Bank Capital: A Simultaneous Equations
Approach. Journal of Economics and Business, No.49:533-548.
Lee, S. W. (2208). Asset Size, Risk-Taking & Profitability in Koran Banking Industry. Banks and Bank Systems.
vol. 3. no. 4: 50-54.
Leff, N. H. 1964. “Economic Development Through Bureaucratic Corruption.” American Behavioral Scientist,
ttp
//: www
.m
an
ag
em
en
tjo
u
rn
als.o
rg
Liang, N. & Rhoades, S. A. (1991). Asset Diversification, Firm Risk, and Risk-based Capital Requirements in
Banking. Review of Industrial Organization 6:49-59.
Lin, Hong-Jen, Winston T. Lin & Sunil K. Mohanty. 2009. "The Cost and Profit Efficiencies and Scope
Economies of Commercial Banks: Evidence from Taiwan and China." International Journal of
Finance, vol.21(2): 6097-123
McAllister, P.H., & McManus, D.A., 1993. Resolving the scale efficiency puzzle in banking. Journal of Banking and Finance, 17, 389-405
Matten. Chris. 1996. Managing Bank Capital : Capital Allocation and Performance Measurement, John Wiley and Sons, London
Micco, Alejandro, Ugo Panizza & Monica Yanez. 2007. "Bank ownership and performance. Does politics
matter?," Journal of Banking and Finance, Elsevier, vol. 31(1):219-241
Molyneux, P., Altunbas, Y. & Gardener, E. 1996, Efficiency in European Banking, John Wiley and Sons,
Sussex
Porteous, B. T. & P.Tapadar, 2006, Economic Capital and Financial Risk Management for Financial Services Firms and Conglomerates, Palgrave-MacMillan
Schooner H.M & M. Taylor, 2009. Global Bank Regulation, 1st Edition, Academic Press
Shen. Zhie , Hailin Liao & Thomas Weyman-Jones, 2009. "Cost efficiency analysis in banking industries of
ten Asian countries and regions," Journal of Chinese Economic and Business Studies, Taylor and
Francis Journals, vol. 7(2): 199-218.
Shrieves, R.E., & Dahl, D., 1992. The relationship between risk and capital in commercial banks. Journal of
Banking and Finance 16, 439-457.
Stolz. S, F. Heid & D. Porath. 2003. "Does Capital Regulation Matter for Bank Behavior? Evidence for German savings banks," Kiel Working Papers 1192, Kiel Institute for the World Economy.
Zellner, Arnold & Theil, Henri. 1962. “Three-Stage Least Squares: Simultaneous Estimation of Simultaneous