Targeting the Poor and Choosing the
Right Instruments
:
Accurately targeting the poor is vital. However,
Indonesia faces a
difficult targeting environment
Indonesia is a complex targeting environment
Largest archipelago
Fourth largest population
Decentralised
Low inequality
Fluid poverty
Multiple targeting objectives
Optimising targeting is also subject to a degree of path dependency
Each program historically used a separate approach to targeting
Currently,
half of all poor are excluded,
and half of all
benefits are received by non-target households
Target Non-target
Share of Benefits Received by Decile Benefit Coverage by Decile
0
Household Per Capita Consumption Decile
UCT Rice Health
0
Household Per Capita Consumption Decile
Targeting can be done with a range of methods
Collection Options:
Which Households to Assess?
Selection Options:
How to Assess Households?
Geographical TargetingTarget poor areas
Survey SweepVisit all households
Community refers
Revisit existing lists
Self-assessmentAny household can apply
Means TestVerify income with records
Proxy Means TestUse household assets to make statistical score
CategoricalYoung, old, pregnant, etc
Community chooses
Self-SelectionAnyone who applies
The Government of Indonesia, J-PAL and the World Bank conducted two field experiments to test targeting methods
The government, J-PAL of MIT and the World Bank conducted two randomised control trial (RCT) to test three different targeting methods
— Second experiment in conjunction with expansion CCT program (PKH)
Method 1: Status Quo: PMT
— PMT scores used to select beneficiaries
— Variant A: Revisit previous list of the poor and re-interview to update PMT data
(current practice)
— Variant B: Visit all households and interview for PMT data
Method 2: Community-based Targeting
— Variant A: Community selects beneficiaries from all households in village
— Variant B: Half of beneficiaries selected from existing PMT list; community can
add additional households, and swap out PMT households for new households
Method 3: Self-targeting
— Any household that wishes can apply to be interviewed with a PMT survey
Community ranking of households was done in a carefully designed and facilitated process
1a. Hamlet leader invites community elite to day/night meeting
1b. Hamlet leader invites full
community to day/ night meeting
2. Facilitator holds broad discussion on concept of
poverty
3. Stack of cards for each household
4. First two households are ranked
5. Facilitator announces next household to be
ranked
6b. Community decides whether household is more or less poor already
ranked household 6a. Elite decides whether household is more or less
Policy question: which methods are most effective for updating targeting data?
How effective are community-based methods for updating? 1
How effective is self-targeting for updating?
2
PMT was found to have the lowest rate of mistargeting overall, but communities better identify the very poor
Mistargeting: (1) Households ranked lower than the village quota cut-off who did not receive transfer; (2) Households ranked higher than the village quota cut-off who did receive transfer
Using the PPP$2 per day per-capita expenditure cutoff, 3 percentage point (or 10 percent) increase in mistargeting in
community and hybrid over the PMT
Community methods select more of the very poor (those below PPP$1 per day) 0
PMT Community
Beneficiaries
PMT Community
P
Communities may have a different concept of poverty: PMT correlates more highly to consumption, but community to household self-assessments
0
PMT Community
Statistically significant Not statistically significant
Correlation between Rankings and Household Self Assessment Correlation between Rankings and Per
Capita Household Consumption
0
In general, households in community and hybrid areas were more satisfied with the process than in control areas
Are you satisfied with the process in general?
Control treatment revisited PPLS08 households rated as very poor (with some additional households from village officials and BPS sweeping), and conducted the same PMT interview as in self-targeting.
0
Control Community
P
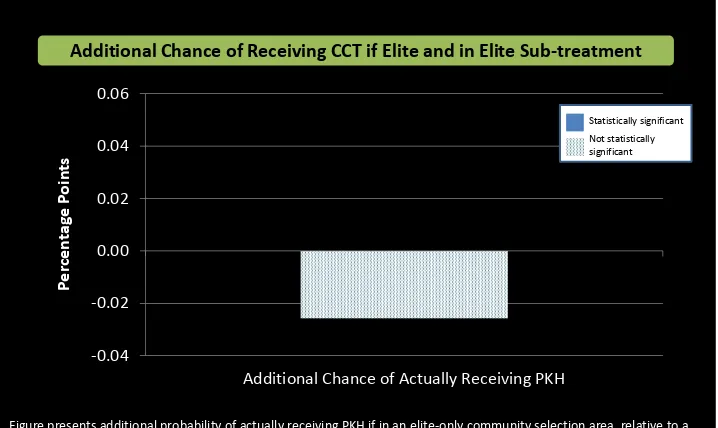
In the experiments, there was no evidence of elite capture
Additional Chance of Receiving CCT if Elite and in Elite Sub-treatment
-0.04
Additional Chance of Actually Receiving PKH
P
Figure presents additional probability of actually receiving PKH if in an elite-only community selection area, relative to a full-community selection area, conditional on household consumption.
No evidence of capture in UCT or Rice for the Poor
Amongst the non-experimentally targeted programs, there is some evidence of capture under Health for the Poor
Additional Likelihood of Elite Receiving Benefits (Conditional on Per Capita Household Consumption
Conditional on log per capita expenditure, elites are 2.9 percentage points (6.8 percent) more likely to receive Health for the Poor
Robust to definitions of elite, robust to only leaders (not relatives), robust to control for whether one belongs to similar social groups as elite
-1
UCT Health Rice
P
e
rc
e
n
This is driven by formal elites, who are more likely to benefit, while informal elites are less so
Additional Likelihood of Elite Receiving Benefits (Conditional on Per Capita Household Consumption
0
UCT Health Rice
P
Statistically significant Not statistically significant
Formal Elites
-7
UCT Health Rice
P
Moreover, elites are more likely to get benefits when there is ‘extra’ quota
Additional Likelihood of Elite Receiving Benefits (Conditional on Per Capita Household Consumption
-1.5
UCT Health Rice
P
Statistically significant Not statistically significant
Elites in “non Over-quota Areas”
0
UCT Health Rice
P
How effective is self-targeting for updating?
Despite significant waiting times, the on-demand application process went smoothly
Waiting times were significant— Households waited an average of 3.5 person-hours
— 14 percent of households had to return the following day because the wait was too long
The application process generally went smoothly— There were few cases of conflict, disruption or violence
The poor were significantly more likely to apply than the non-poor, and were not dissuaded by the effort required
0
Household Consumption Quintile
Probability of Applying by Consumption Quintile
Household consumption quintiles are within the baseline survey, and do not represent national consumption quintiles
The main reason for those who did not apply was that they were unaware of the process
Non-poor selecting out meant lower inclusion errors in self-targeting areas than control…
Control treatment revisited PPLS08 households rated as very poor (with some additional households from village officials and BPS sweeping), and conducted the same PMT interview as in self-targeting.
Self-targeting Benefit Incidence Compared to Control
0
…while applications from poor from outside the pre-existing list of the poor reduced exclusion errors
Control treatment revisited PPLS08 households rated as very poor (with some additional households from village officials and BPS sweeping), and conducted the same PMT interview as in self-targeting.
Self-targeting Coverage Compared to Control
0
The consumption of self-targeting beneficiaries is lower than if all households have a PMT interview, and there is some
improvement in inclusion error
Probability of Receiving Benefit Conditional on Per Capita Household Consumption
Self-targeting
Interview All
Self-targeting households have 13% lower average
consumption
Exclusion errors are similar
What method should be used for updating the unify
Method Advantages Disadvantages Possible 2014 Use
Survey Sweep (PMT)
Assesses all poor
Significantly increases coverage
Costly In high poverty areas
In under-quota areas
Self-targeting (PMT)
Non-poor less likely to turn up
Brings in new poor
Less costly
Not all eligible households apply
In low poverty areas
In at- or over-quota areas
Community additions (non-PMT)
Better at identifying poorest
Higher satisfaction
No elite capture
Less costly
Less accurate beyond the poorest
In areas with high very poor exclusion errors
To capture transient shocks
To verify program lists
Revisit PPLS11 + additions from Census (PMT)
Captures change since last time
Can collect new data
Relatively costly If additional data required for existing households
Additions from Census Pre-listing (PMT)
Census PMT still valid
Allows expansion to desired quota
Less costly
Some households no longer there
In medium poverty areas
In at-/under-quota areas
Self-targeting is an effective updating mechanism
— Poor much more likely to turn up than the non-poor
— Many non-poor households selected out of applying: inclusion error down significantly
— However, poor non-PPLS08 households did apply: exclusion error down significantly
— Smooth process, despite long waiting times
— Overall community satisfaction with process less than control, but considered as fair, and with less non-poor people selected
Community-PMT hybrid is an effective updating mechanism
— No evidence of elite capture, despite considerable benefit levels
— Community added poor households not on PPLS08 list, reducing exclusion error
— Community added some non-poor households, increasing inclusion error
— Household satisfaction with process significantly higher than control (or self-targeting)
Each updating mechanism results in lower errors than no updating at all, but a mixed method approach might be most effective
— Revisiting the existing list in certain areas, or visiting all households in very poor areas can be effective updating methods