Cite this as:
An Analysis of Spatial Patterns of Disabled Persons
in West Bengal
*
Md Monirul Islam*Senior Research Fellow, Dept. of Geography, Aliah University, Kolkata
Abstract In this paper an attempt has been made to observe the spatial patterns of disabled persons by sex and residence in and across the districts of West Bengal. The research paper is exclusively based on secondary sources of data which have been taken from Census of India publications, New Delhi. Advanced statistical techniques have been used to analyze the data. Apart from, advanced cartographic techniques and GIS-MapInfo has also been used to visual representation of the data. The study reveals that disabled persons are highly concentrated in southern part of the state while, central part and a little area of northern part have the lower concentration. There is an enormous regional variation in the distributional patterns of male-female and rural-urban areas of the state. The study also examined the probable association between disability and selected socio-economic variables and it is observed that several variables are significantly associated with disability.
Keywords: correlation, disabled persons, pattern, spatial.
1.
Introduction
Persons with disabilities are the most oppressed, demoralized, marginalized, excluded section of the society. The concentration of disabled persons varies from place to place and time to time (Islam et al., 2016). The geographer‟s task is to analyze the diversity of phenomena in different spatial units (Shivalingappa et al, 2011). Disabled persons is one of the significant phenomena in the contemporary period which has affected most of the part of the world including India, West Bengal is not an exception for this. Though the distributional patterns in all over the world is not same and differed drastically because of biological, social, cultural, economical, political as well as geographical factors.
The World Bank has estimated that there are more than 600 million disabled people in the world and among them around 400 million lives in the developing countries. According to World report on disability (WHO, 2011), 15 per cent of the population globally presents with disabilities, with physical disability being most prevalent.
According to Census of India 2011, there are more than 26 millions disabled persons in India which implies every 22 persons are disabled out of 1000 among them 24 are male, while 20 are female and there are notable differentials in the distribution in rural and urban areas.
World Health Organization (1996) defines disability as “any restriction or lack of ability to perform any activity in a manner or within a range considered normal for a human being”. Disability is the umbrella term for impairments, activity limitations and participation restriction. It denotes the negative facets of the interaction of an individual‟s health condition with his/her environment and personal factors (Karkal et al., 2014).
Therefore disability is remains not only within medical condition, but rather it is the result of the interaction between an individual‟s health conditions and his/her environment broadly defined.
2.
Literature Review
McCoy, et al., (1994) provides an overview of the geographic distribution of country prevalence rates of disability benefit receipt under the social security administration‟s disability * Corresponding author: Md Monirul Islam
Published online at http://IJDS.ub.ac.id/
Cite this as:
insurance and supplemental security income programme in United States. This study represents countries ranked according to the prevalence of disability benefit receipt men and women to highlight local areas with high and low concentration of disability programme receipts.
Das, et al., (1998) have analyzed the patterns of physical disability in India and also examined the relation between the male and the female disability rates and identifies the gender bias in each.
According to Hans, et al., (2003) the number of disabled persons is expected to increase. The reasons behind it are very complex and multifaceted and largely due to health, demographic and development factors. These includes, poor nutrition, ageing population and increase in violence and conflicts, landmines and unexploded ordinance, HIV/AIDS, measles and polio, traffic and occupational accidents, disaster and substance abuse.
Groce (2004) shows there are 180 millions young people between the ages of 10 to 24 globally live with a physical, sensory, intellectual or mental disability, among them most of are living in developing countries. They are very excluded from most educational, economic, social and cultural opportunities, they are among the poorest and most marginalized of all the worlds young people.
Mitra, et al., (2006) have analyzed the prevalence estimates for disability for both National sample survey and Census of India. Investigation shows that there is a substantial difference in rates of disability between these two sources, there is a need of possible sources of these discrepancies. The study also finds out that both the NSS and Census provide only limited information about disability and suggests that there is a need of refinements in each of data sources so that they may capture difference aspects and implications of disability.
Lee, et al., (2013) have develop a map application that can be used by physically disabled people. It offers users gesture and voice in different ways and furnishes with necessary geographic information related to people with disabilities.
Islam, et al., (2016) have studied the nature and spatial extent of disabled persons in India. The study found that majority of the states and union territories are facing the burden of higher concentration of disabled persons in India. Study also reveals that burden of disability is more pronounced in the north-western along with central-eastern parts of the country and discovers that disability is more pronounced among males as compared to their counterpart females, and urban areas of India are more hassle free in respect of disabled persons than country yards.
3.
Objectives of the Study
The major objectives of this research include;
To examine the spatial variations in the distribution of disabled persons across the districts of West Bengal.
To examine the association of disability with some probable socio-economic factors.
4.
Database
and
Research
Methodology
The research paper is exclusively based on secondary sources of data which have been taken from Census of India publications, New Delhi and district wise indicators of socio-economic deprivation have been collected from Census of India, New Delhi, Economic Review, Govt. of West Bengal for the year 2011-12, Statistical Handbook 2013, district level household and facility survey, West Bengal, 2012-13 by Ministry of Health and Family Welfare, Govt. of India and published journals.
Cite this as:
Pearson‟s coefficient of correlation (r) has been applied to examine the nature of relationship with the help of following formula,
∑ ∑ ∑
Student t-test technique has also been introduced to find out the significance at 1 per cent and 5 per cent level of confidence. The formula of the student t-test is given below.
2
Side by sides, advanced cartographic techniques and GIS-MapInfo programme have been applied to show the regional variations of disabled population across the districts of West Bengal through maps.
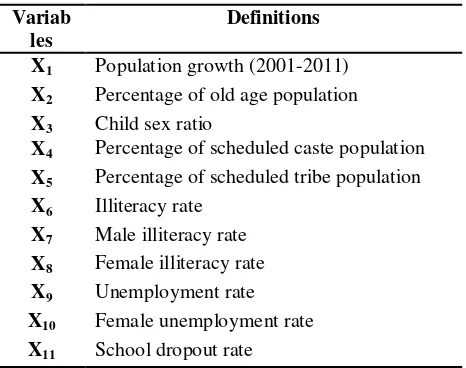
Table 1: Selected Socio-economic variables
Variab les
Definitions
X1 Population growth (2001-2011)
X2 Percentage of old age population
X3 Child sex ratio
X4 Percentage of scheduled caste population
X5 Percentage of scheduled tribe population
X6 Illiteracy rate
X7 Male illiteracy rate
X8 Female illiteracy rate
X9 Unemployment rate
X10 Female unemployment rate
X11 School dropout rate
X12 Percentage of household size more than five
X13 Percentage of houseless population
X14 Percentage of population living in kutcha
house
X15 Percentage of male marriage below legal
age
X16 Percentage of female marriage below legal
age
X17 Percentage of households without drinking
water facility
X18 Percentage households without having toilet
facility
X19 Percentage of BPL card holders
X20 Pregnancy complication women X21 Percentage of unsafe delivery
X22 Percentage of home delivery
X23 Percentage of post delivery
complication of women X24 Poverty rate
X25 Percentage of underweight babies (<2.5
kg)
X26 Percentage of slum population to total
population
X27 Percentage of immunization of mother
and children
X28 Percentage of population using tobacco
X29 Percentage of population doing
smoking
X30 Percentage of population taking alcohol
5.
THE STUDY AREA
Cite this as:
into two parts. The northern part including the districts of Darjeeling, Jalpaiguri, Koch Bihar, Uttar Dinajpur, Dakshin Dinajpur and Maldah is so called „North Bengal‟ and remaining districts of the southern part is called „South Bengal‟ (Fig. 1).
Figure 1
6.
Result and Discussion
The disabled population varies from 1.70 per cent in Uttar Dinajpur district to 2.78 per cent in South 24 Parganas, which comprises 2.21 per cent for the whole state in 2011 (Table 2). The entire range of variation has been classified into three grades, i.e. above 2.30 per cent (High), 2.04 per cent to 2.30 per cent (Medium) and below 2.04 per cent (Low).
Table 2 District wise distribution of Disabled Population in West Bengal, 2011
Source: Census of India, 2011
Table 3 Category wise distribution of disabled population in West Bengal
Source: Based on Table 2.
*Figure under parentheses indicates percentage
The geographical variation of the disabled has been observed from the table 3 and it is depicted that about 21 per cent district to total district have fall under the high grade of distribution. The districts are namely, in descending order, South 24 Parganas (2.78 per cent), Kolkata (2.70 per cent), Paschim Medinipur (2.43 per cent) and Murshidabad (2.33 per cent) and distributed by making two separate zones. One fourth among them lies in middle of the state, while, remaining districts lies in the southern part of the state (Fig. 2). Among them, highest concentration is found in South 24 Parganas district. Many factors are responsible for this distribution, the islands, mangroves and its activities may the one of the major reason for its higher concentration of the disabled population. Majority of the districts (about 53 per cent) come under moderate grade by making four
Category Range No. of Districts
Total Male Female Rural Urban
High >X+ 0.5δ (21.05) 4 (26.32) 5 (15.79) 3 (21.05) 4 (21.05) 4
Medium X- 0.5δ to X+ 0.5δ
10 (52.63)
9 (47.37)
11 (57.89)
13 (68.42)
Cite this as:
distinct regions in the state. These are Darjeeling (2.17 per cent), Jalpaiguri (2.13 per cent), Dakshin Dinajpur (2.13 per cent), Maldah (2.11 per cent), Birbhum 2.14 per cent), Puruliya 2.11 per cent), Bankura (2.15 per cent), Haora (2.16 per cent), Purba Medinipur (2.24 per cent) and North 24 Parganas (2.20 per cent). Among these districts two are from northern part, three are from north-central part, two are from western part and remaining three are from south as well as eastern part of the state.
Lower grade of variation is observed in the two distinct regions, one lies in the northern part comprising the districts of Koch Bihar (2.02 per cent) and Uttar Dinajpur (1.70 per cent) and another part is lying in the middle portion of the state including Barddhaman (1.9 per cent), Nadia (1.81 per cent) and Hugli (1.98 per cent). Among them, lowest is observed in Uttar Dinajpur, which may be the result of high mortality rate among disabled population.
Figure 2
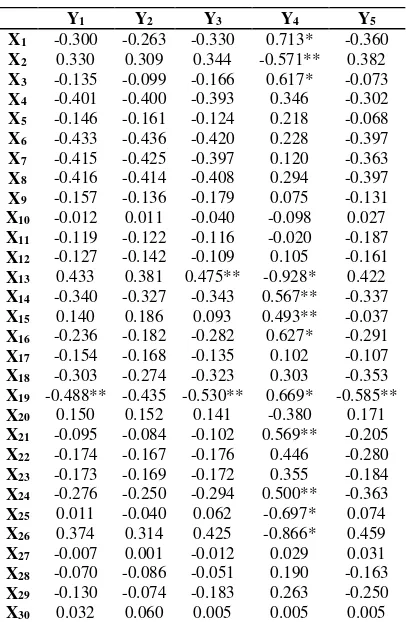
Relationship between total disability (Y1) and other selected variables
A casual relationship has been drawn in between total disability and thirty selected independent socio-economic variables (Table 4). The result shows that out of thirty socio-economic variable only one variable explains significant relationship with total disability, that is X19 (percentage of BPL card holders), though it is negatively correlate with the total disability at 95 per cent level of confidence. It is observed that most of the variables are negatively correlated to total disability. As the figure of total disability is very meager to total population, may produce the negative correlation with the variables. It is also observed that X13 (percentage of houseless population) and X26 (percentage of slum population) variables are positively closely correlate with total disability while X4 (percentage of scheduled caste population), X6 (illiteracy rate), X7 (male illiteracy rate), X8 (female illiteracy rate) etc are negatively closely correlated to total disability. Besides, other variables have also play the significant role in the regional variation of the total disability in the study area, but their significant level are not up to the mark.
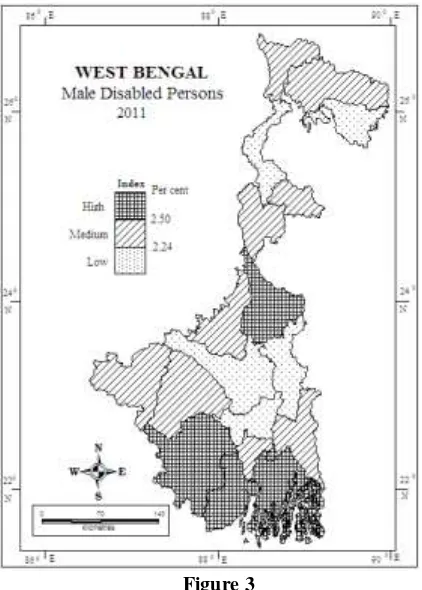
Male-Female Distribution, 2011
Cite this as:
Figure 3
It is noted that spatial variation of male disability rate is very similar to the distribution of total disability. The figure 3 reveals that five districts (about 26 per cent to total districts) come under high grade of spatial variation by making two separate regions in the state. One is lying in the middle of the state namely, Murshidabad (2.56 per cent) and another high region lies in the southern part of the state comprising the districts of Kolkata (2.85 per cent), South 24 Parganas (2.98 per cent), Paschim Medinipur (2.64 per cent) and Purba Medinipur (2.50 per cent). Nine districts (about 47 per cent to total district) come under moderate category. These districts are sparsely distributed over the state. These are in descending order, Birbhum (2.42 per cent), Bankura (2.37 per cent), Haora (2.35 per cent), North 24 Parganas (2.35 per cent), Darjeeling (2.33 per cent), Jalpaiguri (2.32 per cent), Dakshin Dinajpur (2.29 per cent), Puruliya (2.29 per cent) and Maldah (2.28 per cent).
Lower concentration of male disability is found in the districts of Koch Bihar (2.19 per cent), Uttar Dinajpur (1.87 per cent),
Barddhaman (2.16 per cent), Nadia (2.04 per cent) and Hugli (2.19 per cent) by forming two distinct lowest male disability concentrated region, one located in the north part, while, another in the central part of the state.
Relationship between male disability (Y2) and other selected variables
The result (Table 4) reveals that out of thirty variables none is the statistically significant at least 95 per cent level of significance. It is observed that most of the variables are negatively correlated to male disability. It is also observed that X13 (percentage of houseless population) and X26 (percentage of slum population) variables are positively closely correlate with male disability while, X4 (percentage of scheduled caste population), X6 (illiteracy rate), X7 (male illiteracy rate), X8 (female illiteracy rate) etc are negatively closely correlated to male disability. Besides, other variables have also play the significant role in the regional variation of the male disability in the study area, but their significant level are not up to the mark.
Cite this as:
Medinipur (1.86 per cent), Bankura (1.93 per cent) and Puruliya (1.92 per cent).
Figure 4
Relationship between female disability (Y3) and other selected variables
Table 4 shows the simple association between female disability and selected thirty independent socio-economic variables in detail. The result shows that out of thirty socio economic variables, two variables explain significant relationship with female disability in the study area. They are X13 (percentage of houseless population) and X19 (percentage of bpl card holders). Among them X13 (percentage of houseless population) is positively significant at 95 per cent level of confidence, while X19 (percentage of bpl card holders) is negatively significant at 95 per cent level of confidence. In spite of, X2 (percentage of aged population), X4 (percentage of scheduled caste population), X6 (illiteracy rate), X7 (male illiteracy rate), X8 (female illiteracy rate), X14 (percentage of living in kutcha house), X26 (percentage of slum population to total population) etc. are closely associated with the geographical variation of
female disability in West Bengal. Among them, some are associated positively while some are negatively. Besides, other variables have also play the significant role in the regional variation of female disability in the study area, but their significant levels are not up to mark.
Table 4 Correlation between disability and selected variables
Source: Computed by the Researcher
*Significant at 1% level **Significant at 5% level
Rural-Urban Distribution, 2011
The disability prevalence rate of both rural and urban areas is considerably different as compare to each other. Rural disability rate in the state as a whole is 2.20 per cent which is slightly lesser than that of urban disability rate by 0.03 per cent point but this difference is much enunciates across the district of the state.
The entire range of variation in rural areas as well as urban areas are arranged into three suitable groups of below 1.78 per cent (Low), 1.78 per cent to 2.32 per cent (Medium) and
Y1 Y2 Y3 Y4 Y5
X1 -0.300 -0.263 -0.330 0.713* -0.360
X2 0.330 0.309 0.344 -0.571** 0.382
X3 -0.135 -0.099 -0.166 0.617* -0.073
X4 -0.401 -0.400 -0.393 0.346 -0.302
X5 -0.146 -0.161 -0.124 0.218 -0.068
X6 -0.433 -0.436 -0.420 0.228 -0.397
X7 -0.415 -0.425 -0.397 0.120 -0.363
X8 -0.416 -0.414 -0.408 0.294 -0.397
X9 -0.157 -0.136 -0.179 0.075 -0.131
X10 -0.012 0.011 -0.040 -0.098 0.027
X11 -0.119 -0.122 -0.116 -0.020 -0.187
X12 -0.127 -0.142 -0.109 0.105 -0.161
X13 0.433 0.381 0.475** -0.928* 0.422
X14 -0.340 -0.327 -0.343 0.567** -0.337
X15 0.140 0.186 0.093 0.493** -0.037
X16 -0.236 -0.182 -0.282 0.627* -0.291
X17 -0.154 -0.168 -0.135 0.102 -0.107
X18 -0.303 -0.274 -0.323 0.303 -0.353
X19 -0.488** -0.435 -0.530** 0.669* -0.585**
X20 0.150 0.152 0.141 -0.380 0.171
X21 -0.095 -0.084 -0.102 0.569** -0.205
X22 -0.174 -0.167 -0.176 0.446 -0.280
X23 -0.173 -0.169 -0.172 0.355 -0.184
X24 -0.276 -0.250 -0.294 0.500** -0.363
X25 0.011 -0.040 0.062 -0.697* 0.074
X26 0.374 0.314 0.425 -0.866* 0.459
X27 -0.007 0.001 -0.012 0.029 0.031
X28 -0.070 -0.086 -0.051 0.190 -0.163
X29 -0.130 -0.074 -0.183 0.263 -0.250
Cite this as:
above 2.32 per cent (High) and below 1.89 per cent (Low), 1.89 per cent to 2.23 per cent (Medium) and above 2.23 per cent (High) for rural and urban areas respectively.
Figure 5
Fig. 5 reveals that there are four districts which have high concentration of rural disability rate and they are sparsely spread over the state. These are namely, Darjeeling (2.36 per cent), in the north, Murshidabad (2.42 per cent) in the middle, South 24 Parganas (2.75 per cent) and Paschim Medinipur (2.42 per cent) in the south part of the state, while medium category have spread all over the state accounting about 68 per cent to total district. These makes two separate region, one is lying in the north portion consisting the districts of Jalpaiguri (2.17 per cent) and Koch Bihar (2.04 per cent), while, another is from north to the south part of the state stretching the district of Dakshin Dinajpur in the north to Purba Medinipur in the south and forms a vast region of „medium concentration of rural disability‟. These districts are Dakshin Dinajpur (2.15 per cent), Maldah (2.10 per cent), Birbhum
(2.18 per cent), Barddhaman (1.96 per cent), Nadia (1.81 per cent), North 24 Parganas (2.06 per cent), Hugli (2.01 per cent), Bankura (2.17 per cent), Puruliya 2.13 per cent), Haora (2.16 per cent) and Purba Medinipur (2.31 per cent), whereas only one district namely, Uttar Dinajpur (1.73 per cent) come under the low grade of spatial variation of rural disability.
Relationship between rural disability (Y4) and
other selected variables
Cite this as:
disability. Beside other variables also play significant role in the spatial variation of rural disability, but their significant level are not to the mark.
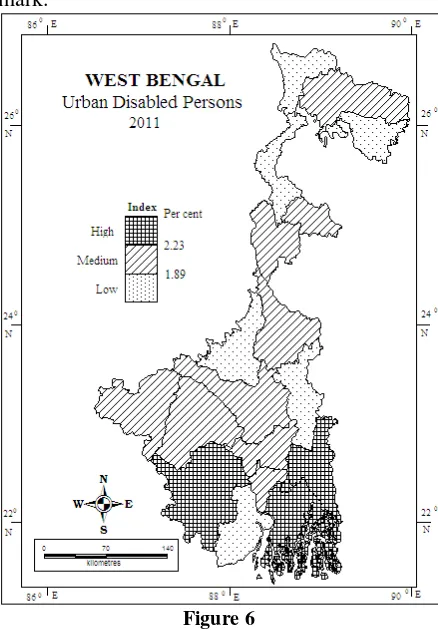
Figure 6
As compare to rural disability, spatial variation of urban disability is much differs across the districts of West Bengal in 2011. According to Fig. 6 four districts namely, North 24 Parganas (2.30 per cent), South 24 Parganas (2.88 per cent), Kolkata (2.70 per cent) and Paschim Medinipur (2.49 per cent) have come under the high grade of regional variation. It is assume that maximum urbanization is happening in this region which leads to more urban disability by increasing traffic accidents, occupational accidents etc. Moderately concentrated districts are forming two distinct region, one is consisting by only one district namely, Jalpaiguri (2.01 per cent) in the north and another region is starts from Dakshin Dinajpur in north to Haora in the south by clustering eight districts, Dakshin Dinajpur (2.03 per cent), Maldah (2.17 per cent), Murshidabad (1.96 per
cent), Barddhaman (2.01 per cent), Puruliya (1.97 per cent), Bankura (1.96 per cent), Hugli (1.94 per cent) and Haora (2.16 per cent). Lower urban disability concentrated districts are sparsely distributed over the state. Six districts (about 32 per cent to total district) come under the low grade of regional variation. Among them, three district namely, Darjeeling (1.86 per cent), Koch Bihar (1.82 per cent) and Uttar Dinajpur (1.53 per cent) are from so called „North Bengal‟ and rest three i.e., Birbhum (1.87 per cent), Nadia (1.82 per cent) and Purba Medinipur (1.67 per cent) are from „South Bengal‟.
Relationship between urban disability (Y5) and
other selected variables
Table 4 reveals that out of thirty socio economic variables, only one variable i.e., X19 (percentage of bpl card holders) is negatively significant at 95 per cent level of confidence with urban disability. It is also observed that X1 (population growth), X2 (percentage of aged population), X6 (illiteracy rate), X7 (male illiteracy rate), X8 (female illiteracy rate), X13 (percentage of houseless population), X24 (poverty rate), X26 (percentage of slum population) etc. are closely associated with urban disability, however some of them are positively while, some of them are negatively correlated. Apart from these, other variables also play significant role in the distribution of urban disability across this district of West Bengal, but their significance levels are not up to the mark.
7.
Conclusion
Cite this as:
associated with disability and effects in their regional variation in the study area.
8.
References
Das, D., Agnihotri, S.B. (1998): Physical Disability: Is There a Gender Dimension?,
Economic and Political Weekly, Vol. 33 (52), pp. 3333 – 3335.
Groce, N.E. (2004): Adolescents and Youth with Disabilities: Issues and Challenges, Asia Pacific Disability Rehabilitation Journal, Vol. 15 (2), pp. 13 -32.
Hans, A., Patri, A. (2003): Women, Disability and Identity, Sage Publication, London.
Islam, M.M., Mustaquim, M. (2016): A Geospatial Analysis of the Nature and Spatial Extent of Disabled Persons in India, Indian Journal of Spatial Science, Vol. 7 (1), pp. 19 – 24.
Karkal, R.S., Shihabuddeen, I. (2014), Disability Benefits for persons with mental illness in India: Challenges for implementation and utilization,
Delhi Psychiatry Journal, Vol. 17 (2), pp. 248-252.
Lee, S., Lee, Y. (2013): Map Application for People with Disabilities Using Smart Devices,
Proceedings of the World Congress on Engineering and Computer Sciences, Vol. I, San Francisco, USA.
McCoy, J.L., Davis, M., Hudson, R.E. (1994): Geographic Patterns of Disability in United States, Social Security Bulletin, Vol. 57 (1), pp. 25 – 36.
Mitra, S., Sambamoorthi, U. (2006), Employment of persons with Disabilities: Evidence from the National Sample Survey, Economic and Political Weekly, Vol. 41 (3), pp. 199-203.
Shivalingappa, B.N., Sowmyashree K.L. (2011), The Pattern of the Distribution of Aged Population in Rural Karnataka: A Spatial Analysis, Journal of Rural Development, Vol. 30 (4), pp. 473 – 486
UN World Health Organization (2011), World Report on Disability: Summary, WHO/NMH/VIP/11.01, available at:
http://www.refworld.org/docid/50854a322.html