Vol. 23, No. 2 December 2015
THE RELATION BETWEEN CASH HOLDINGS AND EARNINGS PERSISTENCE
Yuto Yoshinaga
Hitotsubashi University
Abstract:
Our research question is whether corporate cash holdings can benefit firms through improving earnings persistence which is one of the measures of earnings quality. In order to answer this question, we test whether and how cash holdings are related to earnings persistence. Our results show a strong positive relation between cash holdings and earnings persistence. Next, we examine whether this relation holds after controlling for earnings volatility, since Dichev and Tang (2009) find a strong negative relation between earnings volatility and earnings persistence. We find that the positive relationbetween cash holdings and earnings persistence can be seen if earnings volatility is higher, but it cannot be seen if earnings volatility is lower. These results suggest that cash holdings can benefit firms with volatile earnings.
INTRODUCTION
In the international studies on accounting and finance, Japanese industrial firms are known as one of the most “cash-rich” firms in the world (cf. Pinkowitz et al.(2006), Guney et al. (2007), and Chen(2012)). In addition, corporate cash holdings in Japan have been increasing recently. Though stockholders can criticize “cash-rich” firms for failing
to use investors’ funds efficiently, why are many Japanese firms are eager to hold so much cash? What are the benefits of this? For the first question existing literatures highlight four motives for cash holdings by firms. The second question is the main focus of this paper. We focus on the effects of cash holdings on earnings persistence in this study, different from many existing literatures that discuss the effects on corporate behaviours. Accounting researchers regard earnings persistence as one of the measures of earnings quality (Dechow et al. (2010)) and practitioners like Chief Financial Officers (CFOs) think that it is one of the favourable features of earnings (Dichev et al.(2013), Kagaya (2013)). So our research is the attempt to evaluate whether corporate cash holdings can benefit firms through improving earnings persistence.
Based on the research design of Dichev and Tang (2009), we investigate the relation between cash holdings and earnings persistence. The result of our basic test shows that cash holdings has a positive relation with earnings persistence. Next, we move on to the further analysis. We test whether this relation holds after controlling for earnings volatility because Dichev and Tang (2009) find a negative relation between earnings volatility and earnings persistence. We observe the positive relation between cash holdings and earnings persistence only for firms with high volatility of earnings. In contrast, the positive relation cannot be seen among firms with stable earnings. These results suggest that cash holdings benefit firms with volatile earnings.
This study proceeds as follows. In the next section, we outline the trends in the cash holdings of listed firms in Japan. After that, we review the existing literatures on cash holdings. Next, was how our research design and the empirical results. In the final section, we conclude this study.
Trends in the cash holdings of Japanese firms
Previous research indicates that Japanese industrial firms have more cash than comparable firms in other countries. Pinkowitz et
Vol. 23, No. 2 December 2015
(4.4%). Descriptive statistics given by Guney et al. (2007) also confirm the position of Japanese firms as the “cash-rich” firms comparing the average cash-to-assets ratio of the firms in five developed countries (Japan, the U.S., the U.K., France, and Germany). In their sample, Japanese firms are the richest in cash on average. Chen (2012) proposes the average cash holdings of firms in 23 countries respectively and shows the same facts as Pinkowitz et al. (2006) and Guney et al. (2007).
These studies support that Japanese firms hold so much cash. In addition, there is still an upward trend in the cash holdings of Japanese industrial firms. As we check the trend in our sample period (from 1995 to 2013), the average cash-to-assets ratio is gradually increasing since 2001, even though Japanese firms have faced severe economic shocks over this period. For example, financial crisis following the collapse of Lehman Brothers strongly hurt many Japanese firms in 2009. In 2011, the Great East Japan Earthquake occurred and many Japanese firms were damaged by the disaster in direct or indirect ways. Despite these shocks, the average cash-to-assets ratio for Japanese industrial firms has continued to increase. In2013, the end of our sample period, the ratio reached its highest point.
These upward trends in the cash holdings can also be seen in the U.S. firms. Bates et al. (2009) investigate the average cash-to-assets ratio for the U.S. industrial firms and find that the ratio approximately doubled from 10.5% in 1980 to 23.2% in 2006. Gao et al. (2013) find a similar trend using more recent financial data on the U.S. firms. They report that the cash-to-assets ratio increased from 13.53% in 1995 to 20.45% in 2011.
LITERATURE REVIEW Motives for cash holdings
theory. According to this theory, in the presence of severe asymmetry of information between borrowers and lenders of funds, firms prefer internal capital to external capital because the agency costs of internal capital are lower than those of external capital.
The third motive is the tax motive, as explained by Foley et al. (2007). Foreign earnings of multinational firms located in Japan are taxable in the U.S. or in Japan. However, the tax burdens against those earnings can be deferred until earnings are repatriated. Thus, multinationals can lower their effective tax rate by holding cash abroad. Foley et al. (2007) indicate that higher tax costs promote larger cash holdings in multinational firms.
The fourth motive is the agency motive. When firms lack investment opportunities with a positive net present value, their managers have an incentive not to return funds to stockholders and instead to hold cash. Dittmar et al. (2003) observe differences between various countries in cash holdings. They find that corporations in countries where shareholders rights are less protected hold more cash than in countries with greater shareholder protections. This occurs because in the latter countries, shareholders force managers to pay out more cash.
Bates et al. (2009) conclude that the precautionary motive plays an important role in the increase in cash in the U.S. firms. Shinada and Ando (2013) find a positive effect of the standard deviation of cash flow on cash holdings and argue that Japanese firms hold much cash due to the precautionary motive. Their findings are consistent with Bates et al. (2009).Therefore, the precautionary motive is likely to be the main motive in the U.S. and Japan.
The benefits and problems of cash holdings
Vol. 23, No. 2 December 2015
On the other hand, there are researchers and stockholders that criticize “cash-rich” firms for failing to use investors’ funds efficiently. This criticism is largely due to agency problems. It can be supposed that holding too much cash causes excessive investments or overspending. Harford (1999) and Harford et al. (2008) suggest that cash-rich firms can engage in excessive investments such as acquisitions and capital investments, and thereby they can reduce their firm values. In Japan, stockholders of cash-rich firms grow to push for greater payouts. In 2014, the year-over-year growth of the sum of payouts is expected to be22%, while that of the net income is anticipated to be 3%in Japan according to
“the Nikkei1”.
As seen above, empirical results on whether cash holdings improve or reduce the firm values are still mixed. In order to contribute to the discussion of the merits and drawbacks of cash holdings, we investigate whether and how cash holdings are related with earning persistence. Earnings persistence is thought to be one of the measures of earnings quality in accounting studies (Dechow et al. (2010)). In addition, not only the accounting researchers but also CFOs regard earnings persistence as the favourable features of earnings. Dichev et al. (2013) present results from a survey of CFOs of public companies in the U.S. which asks about important features of high-quality earnings. According to their results, 80.5% of CFOs think that sustainability is an important feature of high-quality earnings. Kagaya (2013) also sends the same questionnaire survey to CFOs in Japanese firms. His questionnaire results are consistent with those of Dichev et al. (2013). These studies show that earnings persistence is thought to be an important earnings quality by both researchers and business people.
RESEARCH METHOD Sample selection
Our sample is obtained from Nikkei NEEDS Financial QUEST 2.0, a database of financial data of Japanese firms. Our sample period covers from 1995 to 2013. We limit the sample to Japanese firms that are listed on stock exchanges in Japan and adopt the Japanese Accounting Standard. We further limit the sample to firms with a fiscal year end of March, which is the most common fiscal year end for Japanese public firms. Financial firms (e.g. banks, insurance companies, brokerages, and
1The sum of the payouts last year is the highest, 13 trillion yen. Listed firms are utilizing
asset management companies) are excluded because they have financial data that is qualitatively different from that of industrial firms. The sample is further restricted to firm/year observations that have non-missing data to construct the variables we use. To diminish the influence of outliers, we then exclude observations with values in the top and bottom 1% of each variable described in the descriptive statistics in Table 1. Our final sample comprises the 29,005 firm/year observations meeting all of these requirements.
The definitions of variables in this study are as follows.
𝐸𝑎𝑟𝑛𝑖𝑛𝑔𝑠𝑡 is net profit gained during the period t. 𝐶𝑎𝑠ℎ𝑡is cash and cash
equivalents plus short-term investment securities at the end of fiscal year
t. These two variables are scaled by total assets at the previous fiscal year end (at the period t-1). 𝑉𝑜𝑙(𝐸𝑎𝑟𝑛𝑖𝑛𝑔𝑠𝑡) is the standard deviation of net profit deflated by total assets at the end of the previous year over the recent five years. Descriptive statistics for the full sample are presented in Table 1. Empirical distributions and pairwise correlations of the variables are shown in Panel A and B respectively.
FINDINGS AND ANALYSIS
Vol. 23, No. 2 December 2015
Table 2. Results of the basic analysis.
𝛽1(Earnings persistence) is estimated for the group 𝐺𝐶𝑅 and all are
significant at the 1% level. The group 𝐺𝐶𝑅 is classified by the value of
𝐶𝑅(“Cash holdings Ranking”). Smaller values of 𝐶𝑅 indicate higher cash-to-assets ratio for firm/year observations in 𝐺𝐶𝑅.𝐸𝑎𝑟𝑛𝑖𝑛𝑔𝑠𝑡 is net
profit scaled by total assets.𝐶𝑎𝑠ℎ𝑡 is cash-to-assets
ratio. 𝑉𝑜𝑙(𝐸𝑎𝑟𝑛𝑖𝑛𝑔𝑠𝑡) is the standard deviation of earnings scaled by total assets over the recent five years.
𝐺𝐶𝑅 𝛽1(Persistence) Adj R2 N
𝐶𝑅 = 1 0.625 0.378 5,890
𝐶𝑅 = 2 0.550 0.280 5,871
𝐶𝑅 = 3 0.484 0.215 5,876
𝐶𝑅 = 4 0.480 0.207 5,871
𝐶𝑅 = 5 0.407 0.157 5,886
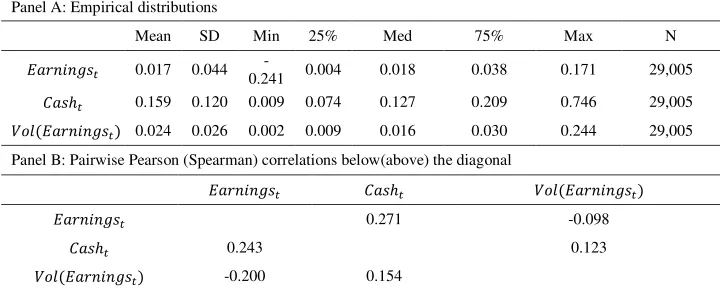
Table 1. Descriptive statistics
𝐸𝑎𝑟𝑛𝑖𝑛𝑔𝑠𝑡is net profit scaled by total assets. 𝐶𝑎𝑠ℎ𝑡 is cash-to-assets ratio. And 𝑉𝑜𝑙(𝐸𝑎𝑟𝑛𝑖𝑛𝑔𝑠𝑡) is the standard deviation of earnings scaled by total assets over the recent five years.
Panel A: Empirical distributions
Mean SD Min 25% Med 75% Max N
𝐸𝑎𝑟𝑛𝑖𝑛𝑔𝑠𝑡 0.017 0.044
-0.241 0.004 0.018 0.038 0.171 29,005
𝐶𝑎𝑠ℎ𝑡 0.159 0.120 0.009 0.074 0.127 0.209 0.746 29,005
𝑉𝑜𝑙(𝐸𝑎𝑟𝑛𝑖𝑛𝑔𝑠𝑡) 0.024 0.026 0.002 0.009 0.016 0.030 0.244 29,005 Panel B: Pairwise Pearson (Spearman) correlations below(above) the diagonal
𝐸𝑎𝑟𝑛𝑖𝑛𝑔𝑠𝑡 𝐶𝑎𝑠ℎ𝑡 𝑉𝑜𝑙(𝐸𝑎𝑟𝑛𝑖𝑛𝑔𝑠𝑡)
𝐸𝑎𝑟𝑛𝑖𝑛𝑔𝑠𝑡 0.271 -0.098
𝐶𝑎𝑠ℎ𝑡 0.243 0.123
Table 3. Results of the further analysis
The value in each of the 25 cells indicates 𝛽1(earnings persistence) estimated for the group 𝐺𝐶𝑅,𝑉𝑅 and all are significant at the 1% level. Adjusted R squared values are indicated in parentheses. The group 𝐺𝐶𝑅,𝑉𝑅 is classified by the value of 𝐶𝑅 (“Cash holdings Ranking”) and 𝑉𝑅(“Volatility of earnings
Ranking”). Smaller values of 𝐶𝑅 indicate higher cash-to-assets ratio for firm/year observations in 𝐺𝐶𝑅,𝑉𝑅. Smaller values of 𝑉𝑅 indicate lower earnings volatility for firm/year observations in 𝐺𝐶𝑅,𝑉𝑅.𝐸𝑎𝑟𝑛𝑖𝑛𝑔𝑠𝑡 is net profit scaled by total assets.𝐶𝑎𝑠ℎ𝑡 is cash-to-assets ratio. and 𝑉𝑜𝑙(𝐸𝑎𝑟𝑛𝑖𝑛𝑔𝑠𝑡) is the standard deviation of earnings scaled by total assets over the recent five years.
𝑉𝑜𝑙(𝐸𝑎𝑟𝑛𝑖𝑛𝑔𝑠𝑡)
𝐺𝐶𝑅,𝑉𝑅 𝑉𝑅 = 1 𝑉𝑅 = 2 𝑉𝑅 = 3 𝑉𝑅 = 4 𝑉𝑅 = 5
𝐶𝑎𝑠ℎ𝑡
𝐶𝑅 = 1 0.879 0.816 0.794 0.670 0.524
(0.534) (0.488) (0.500) (0.441) (0.299)
𝐶𝑅 = 2 0.878 0.782 0.681 0.641 0.431
(0.375) (0.302) (0.342) (0.333) (0.225)
𝐶𝑅 = 3 0.892 0.816 0.706 0.561 0.350
(0.328) (0.294) (0.283) (0.255) (0.161)
𝐶𝑅 = 4 0.925 0.840 0.663 0.537 0.354
(0.223) (0.333) (0.256) (0.229) (0.154)
𝐶𝑅 = 5 0.929 0.765 0.580 0.471 0.309
(0.234) (0.199) (0.201) (0.180) (0.128)
We order firm/year observations, 𝐹𝑖,𝑝, in each industry according to the value of 𝐶𝑎𝑠ℎ𝑡. In our model, 𝑖is the industry code and𝑝 is calculated for each firm/yearobservation from the formula below.
𝑝 = the number of observations in the industry 𝑖the rank of 𝐶𝑎𝑠ℎ𝑡 in the industry 𝑖
We define 𝐺𝑖,𝐶𝑅 as the group composed of firm/year
observations𝐹𝑖,𝑝that satisfy the following requirement.
1
5(𝐶𝑅 − 1) ≤ 𝑝 ≤ 1 5 𝐶𝑅
Here, 𝐶𝑅(= 1,2,3,4,5)is the “Cash holdings Ranking” of the group, where a smaller value means that the members of the group have relatively more cash. We can then describe 𝐺𝑖,𝐶𝑅 as follows.
Vol. 23, No. 2 December 2015
Aggregating the above groups according to𝐶𝑅, we form the subgroups, 𝐺𝐶𝑅, that contain all 𝐺𝑖,𝐶𝑅with the same value of 𝐶𝑅. In the next stage, we estimate and compare earnings persistence in every𝐺𝐶𝑅.
𝐺𝐶𝑅 ∶= ⋃ 𝐺𝑖,𝐶𝑅 𝑖
In the basic analysis, we estimate earnings persistence in each of the quintiles formed on the basis of 𝐶𝑎𝑠ℎ𝑡 in order to identify the relation between corporate cash holdings and the two characteristics of earnings.
Table 2 shows the results from estimating the auto-regressive 𝛽 whether this relation can remain after controlling for earnings volatility. This section covers the further analysis, which looks at the effects of earnings volatility on the positive relation between cash holdings and earnings persistence. In this test, we divide the sample into 25 groups according to cash-to-assets ratio and earnings volatility. We order firm/year observations,𝐹𝑖,𝑝,𝑟, in each industry according to the value of
𝐶𝑎𝑠ℎ𝑡 and 𝑉𝑜𝑙(𝐸𝑎𝑟𝑛𝑖𝑛𝑔𝑠𝑡) independently. In the model, 𝑖 is an industry
code 𝑝 and 𝑟 are calculated for each firm/yearobservation using the formulas below.
𝑝 = the number of observations in the industry 𝑖the rank of 𝐶𝑎𝑠ℎ𝑡 in the industry 𝑖
𝑟 =the number of observations in the industry 𝑖the rank of 𝑉𝑜𝑙(𝐸𝑎𝑟𝑛𝑖𝑛𝑔𝑠𝑡)in the industry 𝑖
We define 𝐺𝑖,𝐶𝑅,𝑉𝑅 as the group composed of firm/year
observations𝐹𝑖,𝑝,𝑟 that satisfy the following condition:
Here, 𝐶𝑅(= 1,2,3,4,5)indicates “Cash holdings Ranking (lower
values of 𝐶𝑅 indicate higher cash holdings)”.𝑉𝑅(=
1,2,3,4,5)indicates“Volatility of earningsRanking(lower values of 𝑉𝑅
indicate lower volatility).We can then describe 𝐺𝑖,𝐶𝑅,𝑉𝑅 in the following way. We classifyall observationsaccording to cash-to-assets ratio and earnings volatility by industry.
𝐺𝑖,𝐶𝑅,𝑉𝑅∋ {𝐹𝑖,𝑝,𝑟|15(𝐶𝑅 − 1) ≤ 𝑝 ≤15𝐶𝑅,15(𝑉𝑅 − 1) ≤ 𝑟 ≤15𝑉𝑅}
We then aggregate these groups according to the pairings of 𝐶𝑅 and 𝑉𝑅.
𝐺𝐶𝑅,𝑉𝑅∶= ⋃ 𝐺𝑖,𝐶𝑅,𝑉𝑅 𝑖
Through these operations, we make25 groups. We estimate and compare earnings persistence in every𝐺𝐶𝑅,𝑉𝑅.
The results are shown in Table 3. First, let us take a look at each row in Table 3.The two columns on the right (𝑉𝑅 = 4,5) indicate the earnings persistence of the groups composed of observationswith high earnings volatility. In these columns, the top cells (𝐶𝑅=1) have the largest estimated coefficient (earnings persistence) and the bottom cells (𝐶𝑅=5) have the smallest values for the coefficient. In addition,
𝛽isgenerally decreasing from the top row to the bottom row.Thus, we can see that thegradation in𝛽can be seen in high earnings volatility groups. In contrast, in the left two columns (𝑉𝑅 = 1,2), such gradation cannot be seen. These results indicate that when earnings are highly volatile, holding more cash is related with higher earnings persistence.But, when firms have stable earnings, we cannot observe a positive relation between cash holdings and earnings persistence.
Now, the coefficients are basically decreasing from left to right in Table 3. These results confirm the negative relation between earnings persistence and earnings volatility. Therefore, our results are consistent with those of Dichev and Tang (2009).
CONCLUSION
Vol. 23, No. 2 December 2015
that the positive relation between cash holdings and earnings persistence remains only when earnings are highly volatile. Recently, stockholders criticize Japanese firms for holding too much cash and they require increasing the amount of payouts. However, our results suggest that cash holdings should not be quickly regarded as the evidence that the firms do not use their capital efficiently. Cash holdings should be assessed together with earnings volatility. For example, stockholders probably should not require more payouts against the firms whose earnings are highly volatile. If they do not demand payouts, they will expect more persistent earnings of those firms.
Our study has some limitations. First, there is not a clear explanation as to why there is a positive relation between cash holdings and earnings volatility if firms gain volatile earnings. Second, we do not gain enough evidence to prove the causation. It is possible that cash holdings have a positive effect on earnings persistence of the firms whose earnings are volatile. Cash holdings can give them the opportunities of valuable investments. But, persistent earnings can make firms rich in cash. These questions will be addressed in future research.
REFERENCES
Bates, T. W., Kahle, K. M., &Stulz, R. M. (2009). Why do US firms hold
so much more cash than they used to?. The Journal of
Finance,64(5), 1985-2021.
Brown, J. R., & Petersen, B. C. (2011).Cash holdings and R&D smoothing.Journal of Corporate Finance,17(3), 694-709.
Chen, N. (2012). Corporate Thrift And Economic Growth: A Comparative Study Of Developing And Developed Countries.
Journal of International Development, 24(2), 167-184.
Dechow, P., Ge, W., &Schrand, C. (2010). Understanding earnings quality: A review of the proxies, their determinants and their consequences. Journal of Accounting and Economics,50(2), 344-401.
Denis, D. J., &Sibilkov, V. (2010). Financial constraints, investment, and
the value of cash holdings. Review of Financial Studies,23(1),
Dichev, I. D., & Tang, V. W. (2009).Earnings volatility and earnings predictability. Journal of accounting and Economics,47(1), 160-181.
Dichev, I. D., Graham, J., Harvey, C. R., &Rajgopal, S. (2013). Earnings quality: Evidence from the field. Journal of Accounting and Economics.56(2-3), Supplement 1, 1-33
Dittmar, A., Mahrt-Smith, J., &Servaes, H. (2003).International corporate governance and corporate cash holdings. Journal of Financial and Quantitative analysis,38(1), 111-134.
Foley, C. F., Hartzell, J. C., Titman, S., &Twite, G. (2007). Why do firms hold so much cash? A tax-based explanation.Journal of Financial Economics, 86(3), 579-607.
Gao, H., Harford, J., & Li, K. (2013). Determinants of corporate cash policy: Insights from private firms. Journal of Financial Economics.109(3), 623-639
Guney, Y., Ozkan, A., &Ozkan, N. (2007).International evidence on the
non-linear impact of leverage on corporate cash holdings. Journal
of Multinational financial management,17(1), 45-60.
Harford, J. (1999). Corporate cash reserves and acquisitions. The Journal of Finance,54(6), 1969-1997.
Harford, J., Mansi, S. A., & Maxwell, W. F. (2008). Corporate governance and firm cash holdings in the US. Journal of Financial Economics,87, 535-555.
Kagaya, T. (2013) .The exploration of innovation in empirical accounting research. (in Japanese). Briefing Paper, 72th Conference on Japanese Accounting Association
Vol. 23, No. 2 December 2015
Pinkowitz, L., Stulz, R., & Williamson, R. (2006). Does the contribution of corporate cash holdings and dividends to firm value depend on
governance? A cross‐country analysis. The Journal of
Finance,61(6), 2725-2751.
Shinada, N & Ando, K. (2013).Cash Holdings of Japanese Firms (in Japanese).Securities Analysts Journal.51(6), 6-16
Wang, W., &Gu, F. (2012). The Effect of R&D Investment on Future