Effect of Maintenance at Different Salinity against White Spot Syndrome
Virus (WSSV) Infection Level in Post Larvae Litopenaeus vannamei Shrimp
Attabik Mukhammad Amrillah
1*, Sri Widyarti
2, Yuni Kilawati
31
Master Program of Biology, Faculty of Mathematics and Natural Sciences, University of Brawijaya, Malang, Indonesia
2
Department of Biology, Faculty of Mathematics and Natural Sciences, University of Brawijaya, Malang, Indonesia
3
Department of Aquatic Resources Management, Faculty of Fisheries and Marine Sciences, University of Brawijaya, Malang, Indonesia
Abstract
White spot syndrime virus (WSSV) is a highly contagious disease in shrimp culture and causing 100% death within 3-10 days of clinical symptoms. WSSV can infect shrimp in post larvae stage (PL) to a size of 40 g. This study was aimed to determine the effect of different salinity against WSSV infection level in post larvae vannamei shrimp (Litopenaeus vannamei). In this study PL 40 size of vannamei shrimp infected with WSSV in virus concentration 20 μg.mL-1 in three different salinity is 5 ppt, 15 ppt, 25 ppt for 4 hours using the soaking method then maintened for 7 days post-infection and then infection level and water quality observed. Data analysis used simple linear regression and F test with a confidence level 95% (P <0.05). The results indicate changes in behavior between healthy and infected shrimp in three levels (mild, moderate, severe). The highest total mild infection in salinity treatment of 25 ppt by 30%, the highest total medium infection at salinity treatment 25 ppt by 37%, the highest total severe infection at salinity treatment 5 ppt by 57%. Shrimp that have mild level of infection are increasing in concominant higher salinity, while the severe infection level has decreases with increasing salinity.
Keywords:Infection Level, Litopenaeus vannamei, Post Larvae, Salinity, WSSV
INTRODUCTION
Vannamei shrimp demand is very large, both local and international markets. It has any advantage like high nutrition and high economic value [1]. Vannamei shrimp can growth rapidly, can be cultured with high density, relatively high market prices [2] and shorter maintenance time which is about 90-100 days for each cycle [3].
However, the level of vannamei shrimp farms productivity became uncertain, even failed [4]. In culture, there are various problem, one of which is the disease. Vannamei shrimp are very susceptible to disease caused by parasites, fungi, protozoa, bacteria and viruses. As well as in black tiger shrimp, a disease caused by a virus is also a major problem in the vannamei shrimp culture [5].
White spot syndrome virus infection mechanism initially are intracytoplasmic, entry into host cells and then at a higher infection rate of viral DNA into the host DNA and take over the process of transcription and translation process-es to the corrprocess-esponding viral DNA [6].
Correspondence author:
Attabik Mukhammad Amrillah
Email : [email protected]
Address : Dept. of Biology, University of Brawijaya, Jl. Veteran Malang, 65145
There is sufficient evidence to support that environmental changes caused the modification of the immune system of shrimp that cause increased susceptibility to disease agents [7]. It has been reported also that manipulate environ-mental factors can cause the shrimp have been infected with WSSV to survive during the period of culture takes place [8]. Salinity is the most important environmental variables that can directly affect the physiology and ecology of shrimp farming. Significantly decreased salinity can cause stress on the shrimp, making shrimp susceptible to disease such as WSSV [9]. At salinity of 30 ppt, WSSV infection in black tiger shrimp is lower than the salinity of 10 ppt, 15 ppt, 20 ppt and 25 ppt [10].
The effect of salinity on WSSV infection level have not been studied, particularly in vannamei shrimp culture in Indonesia. Thus it is necessary to study the effects of salinity differences on the level of WSSV infection in vannamei shrimp.
MATERIALS AND METHODS
This study consisted of two variables: the independent variables, i.e. seawater different salinity and the dependent variable, i.e. clinical symptoms and the infection level.
Preparation and Sea Water Sterilization
Sea water used in this study has taken from Sendang Biru beach, Malang. The sea water stored in large tub with volume 100 liters. Before the sea water used as culture media, sterilized drops of chlorine and give strong aeration.
Containers Sterilization
Disinfection of jar that used in maintenance process, WSSV infections process and observation using KMnO4 10 ppm for 24 hours, then all the equipment that has been disinfected flushed with sterile water and dried.
Virus Preparation
The procedure of making virus inoculum was as follows [11]. Total of1 grams of WSSV infected shrimp crushed with mortar. Then suspended in 9 ml sterile sea water. Suspension of organ centrifuged at 3,000 rpm at 4oC for 20 minutes, then centrifuged at 8,000 rpm for 30 minutes at 4oC. Supernatant filtered by using filter milipore
0.45 μm and obtained a suspension of the virus
by concentration 10% (w/v) which is equivalent to the concentration of 20 mg.ml-1 virus.
Virus Dilution
The procedure of making virus dilution following a method from Supriatna [12]. Total of
20 μg.mL-1
virus was obtained by preparing dilution tubes. First tube contained 1 mL solution of the virus with concentration 20 mg.mL-1 and added 9 ml sea water and homogenized then the tube shaken. Total of 10 mL of the 2 mg.mL-1 were taken into second tube and 90 mL sterile sea water were added. Last, 100 mL of the 0.2 mg.mL-1 were taken and 900 mL sterile sea water was added. Total 1,000 mL viruses 0.02 mg.mL-1 used for infection test.
WSSV infection test
After obtained 20 μg.mL-1 virus concentration and then it was put in a jar that had contained 2 liters of sterile sea water and aerated with a given density of 63 shrimps on each jar. Shrimp put into the jar with 3 different salinity (5 ppt, 15 ppt, 25 ppt) treatments with 3 repetition.
Post-Infection Maintenance
Shrimp that have been infected was cultured in container with aeration. Each jar contained 21 infected shrimps and maintained post-infection shrimp for seven days. During the maintenance, shrimp fed with pellet powder with the frequency of feeding 3 times a day. Control was not infected with WSSV and given the optimal salinity level. Water quality and clinical symptoms that arise due to WSSV infection has been observed during maintenance.
Clinical Symptoms Observation
Salinity changes can cause changes in haemolymph metabolism during the process of viral infection. Thus the role of immuno-competence can be reduced and the vulnerability of shrimp to other pathogens increases [13].
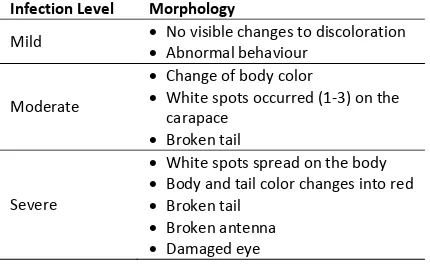
Shrimp in this study grouped according to the level of infection which based on morphology and behavioral changes of vannamei shrimp, i.e. mild, moderate, and severe infections [14]. Explanation of the category described as follows (Table 1).
Table 1. WSSV Infection Level of Vannamei Shrimp
Infection Level Morphology
Mild No visible changes to discoloration
Abnormal behaviour
Moderate
Change of body color
White spots occurred (1-3) on the carapace
Broken tail
Severe
White spots spread on the body
Body and tail color changes into red
Broken tail
Broken antenna
Damaged eye
Water Quality Measurement
Water quality measurement conducted during the research. The parameters that observed was disolved oxygen (DO), salinity, pH and temperature. Measurement performed on each experiment jar about three times a day, at 09.00, 14.00, 20.00 WIB. Salinity measured using refractometer, while temperature and DO was measured using DO meter, and pH using pH meter.
WSSV PCR Analysis using Primer ICP11
Wsv230_19F22:5'GACGATTCGCCTTGCTGGTGG 3' and Wsv230_202R24: 5'GGGAATTTGCTCATCCA GCGTTGA 3' with following PCR program: Hot start at 95oC for 3 min; Denaturation at 94oC for 1 min, Annealing at 59oC for 1 min; Extention at 72oC for 1 min. Denaturation process, annealing and extension carried out for 35 cycles and Post extensions at 72oC for 7 min.
Data Analysis
All the level of infection data obtained from the control and treatment of salinity (5 ppt, ppt,15 ppt, 25 ppt) were tabulated in Microsoft Excel. We also performed a simple linear regression and F test with 95% confidence level (P <0.05).
RESULT AND DISCUSSION
Morphology of Healthy Vannamei Shrimp Behavior and morphological observation of healthy vannamei shrimp showed normal behavior, e.g. fresh body color and complete body parts, shrimp move in the bottom of waters column and motionless on the bottom without raises to water surface at noon. Otherwise, at night shrimp had seen moving for eating the given feed. Normal condition is shown in the control treatment (without giving the virus). The behavior of the other shrimp shown as response to stimulus such as light and touch. This can be seen at night when the light of flashlight given, the shrimp moved closer to the light source. It was imiliar with the touch stimulation. Shrimp immediately swam away in the opposite directi-on to the existing stimuli. This is cdirecti-onsistent with the statement of Kilawati [16], the characteristic of healthy shrimp has bright body colors, there are no white spots on the shrimp body, actively move and quickly response.
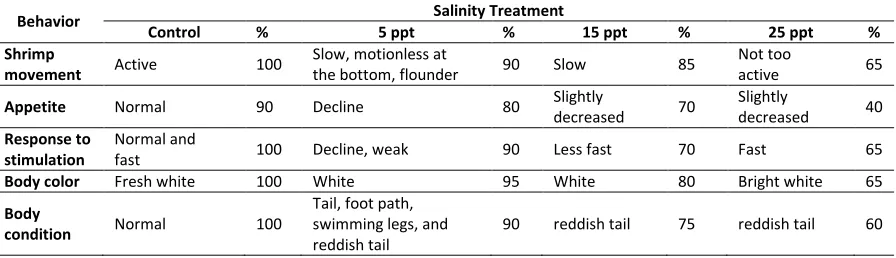
Behavioral Change of WSSV-Infected Vannamei Shrimp
The results of salinity differences in WSSV infection againts behavioral change in vannamei shrimp showed different behavior in each treatment. Behavioral changes in vannamei shrimp post-infection are presented in Table 2.
WSSV Infection Level
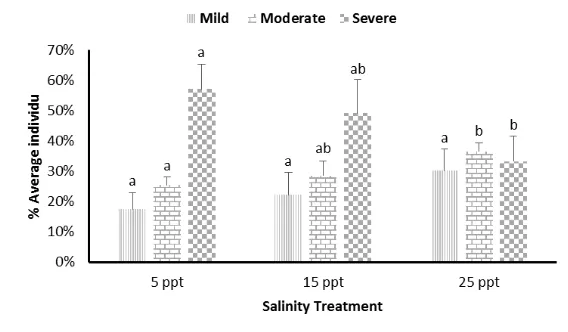
The highest total of WSSV infected shrimp at 5 ppt salinity treatment with severe infection is 57%, followed by 15 ppt salinity treatment by moderate infection for 37%, and 25 ppt salinity treatment by severe infection for 30%. From data analysis, we obtained the average number of infected shrimp (Figure 1).
Relationship of Salinity and Infection Level
This study consisted of independent variables (seawater with different salinity) and dependent variable (clinical symptoms and infection level). The results revealed that there was a relationship between independent variables and the dependent variable (Fig. 2). The relationship between salinity comparison with infection level in mild infection showed in the average number of shrimp with the characteristics of vannamei shrimp morphology. No morphological changes were visible, in addition to changes in behavior that is not normal and discoloration on the body. If the shrimp is WSSV-infected but there has been no sign of white spot, it is categorized as mild infection [17]. The infection occurred in low tissue thus white spots and redness did not appear. Figure 2 show a positive correlation where the higher salinity range, the higher number of shrimp that has scoring 1.
Table 2. Behavioral changes in infected vannamei shrimp, comparing between control group (healty shrimp) and treatment group (infected shrimp). Control: healty shrimp, 5ppt, 15ppt, 25ppt: salinity tratment and infected shrimp
Behavior Salinity Treatment
Control % 5 ppt % 15 ppt % 25 ppt %
Shrimp
movement Active 100
Slow, motionless at
the bottom, flounder 90 Slow 85
Not too
active 65
Appetite Normal 90 Decline 80 Slightly
decreased 70
Slightly
decreased 40
Response to stimulation
Normal and
fast 100 Decline, weak 90 Less fast 70 Fast 65
Body color Fresh white 100 White 95 White 80 Bright white 65
Body
condition Normal 100
Tail, foot path, swimming legs, and reddish tail
Figure 1. The average scoring level graph of WSSV infection level in infected shrimp
Figure 2. Correlation of salinity difference with the average of individuals (%) at the infection level (scores). Mild level have positif correlation with salinity changes; Moderate level have positif correlation with salinity changes; Severe level have positif correlation with salinity changes
Moderate infection level showed the change of color on the body and tail become red and the occurrence of white spots on the carapace between 1-3 unit. Presence of white spots on the carapace has become a common sign of WSSV [18], and also the adult shrimp has red color [19]. The Figure 2 show a positive correlation where the higher the salinity range, the higher number of shrimp that has scoring 2.
Severe infection level showed that the white spot has spread to parts of the body shrimp as well as the change in color to red on the tail and body, the antenna broken and eye damaged. Directorate General in Fisheries Farming described severe infection characterized by reddish body color changes into bolder red color on the tail [20]. The Department of Marine and Fisheries also explained that when it is severe, white spot spread to all parts of the body [21].
higher ranges of salinity lead to the lower scoring 3. Other study showed that the shrimp at salinity 30 ppt, WSSV infection in black tiger shrimp is lower than the salinity of 10 ppt, 15 ppt, 20 ppt and 25 ppt [10].
Vannamei shrimp have high osmoregulation ability, and successfully cultured in low salinity conditions (2 ppt) to high (40 ppt). The salinity changes of the water causes changes in haemolymph metabolism during viral infection process, thus reduce the role of immunocom-petence and increase the vulnerability of shrimp to other pathogens [22].
metabolic is significant in infected shrimp under salinity stress. It can be described as irregularities in the flow of energy to support the osmotic process under double stress due to salinity and pathogenic stress. Metabolic response variables have a correlation with some immune variables. It can be explained that bad metabolic response lead to decreased immunocompetence thus increase the amount of virus in infected shrimp [23]. Nearly optimal salinity range for vannamei shrimp life can be one of the supporting factor from the environment to the shrimp health condition.
WSSV Detection
Primer ICP11 [24] has chosen to be specific primers. ICP11 is a non-structural proteins encoded by genes ICP11 which allegedly role in WSSV infection. At the level of transcription and translation, host cells that have been infected by WSSV expressed a protein [25].These proteins are nonstructural called ICP11.ICP11 gene amplification results are shown in Figure 3.
Figure 3. WSSV detection. band amplificated in 207 bp indicated sample was infected by WSSV, Description: M:Marker, K:Control, 1:Mild,
2:Moderate, 3: Severe [15].
Vannamei shrimp DNA amplification results (Fig. 3) was used to ensure checks based on morphological condition. Morphological analysis results showed symptoms of being infected by the WSSV and infection level ranging from mild to severe. The results obtained by PCR amplifi-cation of gene ICP11 occurred at 207 bp, which means that there is a WSSV DNA virus in shrimp DNA samples which indicates infection by WSSV. The thickness of the band formed in the gel is
affected by the concentration of DNA possessed by each sample, in mild 119.40 ng.μL-1, moderate 235.91 ng.μl-1 and severe 1.78 ng.μl-1.
WSSV infection mechanism to the body of vannamei initially intracytoplasmic into the host cell. Then at higher infection level, DNA viral entry into host DNA and takes over the transcription and translation processes in accordance with the DNA of the virus. At the stage of transcription and translation, the WSSV genes expressing a non-structural protein called ICP11, which was assumed essential in WSSV infection [10]. Exposure to stress on the shrimp can increase the risk of WSSV attack, because stress harm the shrimp immune system [26]. Consequently, under stress conditions, WSSV can proliferate rapidly and cause death [27].
Water Quality
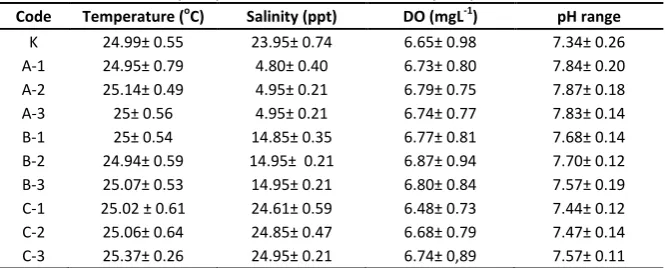
Water quality measurement on the shrimp culture of this study was shown in Table 3. The lowest temperature is 24.13°C and the highest temperature is 25.53°C. Temperature greatly affects the life and growth of aquatic biota. In general, growth rate increases with increase in temperature, can suppress the animal life and even cause death if an increase in temperature is extremely occurred [28].
The lowest salinity is 4 ppt, while 25 ppt is the highest salinity. Salinity is closely related to osmoregulation of aquatic animals, in case of a sudden drop in salinity and the range is large enough, it will be difficult for the animal in osmoregulation setting which can lead to death [10].
Dissolved oxygen (DO) measurement in the seawater during the study showed the lowest value of DO is 4.9 and the highest value of DO is 8.66. The range of the oxygen in this study still support the shrimp life because the good range of DO for the shrimp life is 4-8 ppm [29].
Measurement of pH in this study showed the lowest pH for 6.65 and 8.15 as the highest pH.This value is still in the normal and optimum conditions for the life of vannamei shrimp. Budiardi [30] said waters with extreme pH depressed the shrimp, softening carapace and lowering their survival rate.High mortality in shrimp occur in waters pH below 6.0 while at pH 3.0 in the 20 hours can occurred up to 100% mortality.
M K 1 2 3
250bp 500bp 750bp 1000bp 1500bp
207bp
Table 3. The water quality assessment result after 7 days of post infection culture Code Temperature (oC) Salinity (ppt) DO (mgL-1) pH range
K 24.99± 0.55 23.95± 0.74 6.65± 0.98 7.34± 0.26 A-1 24.95± 0.79 4.80± 0.40 6.73± 0.80 7.84± 0.20 A-2 25.14± 0.49 4.95± 0.21 6.79± 0.75 7.87± 0.18 A-3 25± 0.56 4.95± 0.21 6.74± 0.77 7.83± 0.14 B-1 25± 0.54 14.85± 0.35 6.77± 0.81 7.68± 0.14 B-2 24.94± 0.59 14.95± 0.21 6.87± 0.94 7.70± 0.12 B-3 25.07± 0.53 14.95± 0.21 6.80± 0.84 7.57± 0.19 C-1 25.02 ± 0.61 24.61± 0.59 6.48± 0.73 7.44± 0.12 C-2 25.06± 0.64 24.85± 0.47 6.68± 0.79 7.47± 0.14 C-3 25.37± 0.26 24.95± 0.21 6.74± 0,89 7.57± 0.11
Description:(K) = control (A) = 5 ppt, (B) = 15 ppt, (C) = 25 ppt, (1,2,3) = repetition
CONCLUSION
Shrimp that has score 1 (mild infection level) and Score 2 (moderate infection level) have a high number of individu with increasing salinity range. Otherwise, the shrimp that had score 3 (severe infection level) has decreased number of individu with the increasing salinity range.
ACKNOWLEDGEMENT
The author thanks Dr. Yuni Kilawati, S.Pi., M.Si for the research funding, and all of the research team and analyst at LSIH-UB for the cooperation.
REFERENCES
[1] Yustianti, M.N. Ibrahim, Ruslaini. 2013. Pertumbuhan dan sintasan larva udang vaname (Litopenaeus vannamei) melalui substitusi tepung ikan dengan tepung usus ayam. Jurnal Mina Laut Indonesia. 1(1). 93-103.
[2] Nur'aini, Y.L., H. Bambang, S. Subyakto, T. Gemi. 2007. Active surveilance of infectious myonecrosis virus (IMNV) in pond cultured white shrimp (Litopenaeus vannamei) in East Java and Bali. Jurnal Perikanan UGM. IX(1). 25-31.
[3] Panjaitan, A.S. 2012. Pemeliharaan larva udang vaname (Litopenaeus vannamei, boone 1931) dengan pemberian jenis fitoplankton yang berbeda. Master Thesis. Indonesia Open University. Jakarta.
[4] Adiwidjaya, D., K. Coco, Supito. 2001. Teknis operasional budidaya udang ramah lingkungan. Department of Marine and Fisheries. Directorate General of Fisheries Farming. Central Institute of Brackish Water and Aquaculture. Jepara.
[5] Sukenda, S.H. Dwinanti, M. Yuhana. 2009.
(WSSV), taura syndrome virus (TSV) dan infectious hypodermal haematopoitic necrosis virus (IHHNV) di tambak intensif udang vaname Litopenaeus vannamei di Bakauheni, Lampung Selatan. Jurnal Akuakultur Indonesia. 8(2). 1-8.
[6] Kilawati, Y., D. Win. 2009. Karakter protein ICP11 pada DNA udang vannamei (Penaeus
vannamei) yang terinfeksi white spot
syndrome virus (WSSV). Berk. Penel. Hayati. 15. 21-24.
[7] Liu, B., Z. Yu, X. Song, Y. Guan, X. Jian, J. He. 2006. The effect of acute salinity change on white spot syndrome (WSS) outbreaks in
Fenneropenaeus chinensis. Aquaculture.
253. 163-170.
[8] Vidal, M.O., B.C. Granja, F. Aranguren 2001. A profound effect of hyperthermia on survival of Litopenaeus vannamei juveniles infected with white spot syndrome virus. J. World Aquacult. Soc. 32. 364-372.
[9] Soetrisno, C.K. 2004. Mensiasati penyakit WSSV di tambak udang. Aquacultura Indonesiana. 5(1): 19-31. ISSN 0216-0749. [10] Rahma, H.N., B.P. Slamet, Alfabetian, C.H.
Harjuno. 2014. Infeksi white spot syndrom virus (WSSV) pada udang windu (Penaeus
monodon fabr.) yang dipelihara pada
salinitas media yang berbeda. J. Aquacult. Manage. Technol. 3(3). 25-34.
[11] Hameed, A.S.S, M. Anilkumar, M.L.S. Raj, K. Jayaraman. 1998. Studies on the phato-genicity of systemic ectodermal mesoder-mal baculovirus and its detection in shrimp by immunological methods. Aquaculture.
160. 31-45.
ekstrak biji mangrove (Xylocarpus
granatum) terhadap patogenitasnya pada
udang windu (Panaeus monodon fabr.). Thesis. Bogor Agricultural University. Bogor. [13] Joseph, A., R. Philip, 2007. Acute salinity
stress alters the haemolymph metabolic profile of Penaeus monodon and reduces immunocompetence to white spot syndro-me virus infection. Aquaculture. 272. 87-97. [14] Yanto, H. 2006. Diagnosa dan LDENTIFIKASI
penyakit udang asal tambak. Jurnal Peneli-tian Sains dan Teknologi. 7(1). 17-23. [15] Amrillah, A.M., S. Widyarti, Y. Kilawati.
2015. Dampak stres salinitas terhadap prevalensi White Spot Syndrome Virus
(WSSV) dan survival rate udang vannamei
(Litopenaeus vannamei) pada kondisi
terkontrol. Res. J. Life Sci. 2(1). 34-47. [16] Kilawati, Y. 2011. Pengaruh serangan WSSV
terhadap morfologi, tingkah laku dan kelulushidupan spf udang vaname indonesia yang dipelihara dalam lingkungan terkontrol. J. Biol. Res. 7F. 105-109.
[17] Sudha, P.M., C.V. Mohan, K.M. Shankar, A. Hedge. 1998. Relationship between white spot syndrome virus infection and clinical manifestation in Indian cultured penaeid shrimp. Aquaculture. 167. 95-101.
[18] Wang, C.S., Y.J. Tsai, G.H. Kou, S.N. Chen. 1997. Detection of white spot syndrome disease virus infection in wild caught greasyback shrimp, Metapenaeus ensis
(dehaan) in Taiwan. Fish Pathol. 32(1). 35-41.
[19] Mahardika, K., Zafran, I. Koesharyani. 2004. Deteksi white spot syndrome virus (WSSV) pada udang windu (Penaeus monodon) di Bali dan Jawa timur menggunakan metode polymerase chain reaction (PCR). Jurnal Penelitian Perikanan Indonesia. 10(1). 55-60.
[20] Directorate General of Fisheries Farming. 2006. Pengendalian penyakit TVS pada budidaya udang vaname. DKP Article. Jakarta. Accessed on April 12th 2014. [21] Departmentof Marine and Fisheries. 2006.
Cegah bercak (WSSV) yang menyerang udang di tambak. DKP Article. Jakarta. Accessed on April 10th 2014.
[22] Yoganandhan, K., S. Thirupathi, A.S.S. Hameed. 2003. Biochemical, physiological
and hematological changes in white spot syndrome virus infected shrimp, Penaeus indicus. Aquaculture. 221. 1-11.
[23] Wang, H.C., H.C. Wang, T.P. Ko, Y.M. Lee, J.H. Leu, C.H. Ho, W.P. Huang, C.F. Lo, W.H.J. Andrew. 2008. White spot syndrome virus protein ICP11: A histone-binding DNA mimic that disruptsnucleosome assembly.
PNAS. 105(52). 20768-20783.
[24] Wang, H.C., C.W. Hao, H.K. Guang, F.L. Chu, P.H. Wei. 2007. Identification of ICP11, the most highly expressed gene of shrimp white spot syndrome virus (WSSV). Dis. Aquat. Organ. 74. 179-89.
[25] Takahashi, Y., T. Itami, M. Kondo. 1995. Immunodefense system of crustacea. Fish Pathol. 30. 141-150.
[26] Doan C.V., A.T.T. Pham, T.X. Ngo, P.H. Le, H.V. Nguyen. 2009. Study on the pathoge-nesis of the white spot syndrome virus (WSSV) on juvenile Penaeus monodon in Vietnam. Isr. J. Aquacult. - Bamidgeh, 61(3). 248-254.
[27] Kordi, 2010. Budi daya udang laut. Lily Publisher. Yogyakarta.
[28] Anggoro, S. 1992. Efek osmotik berbagai tingkat salinitas media terhadap daya tetas telur dan vitalitas larva udang windu
(Penaeus monodon) Fabricus. Graduate
Program, Bogor Agricultural University. Bogor.
[29] Amri, K. 2003. Kiat mengatasi permasalahan budi daya udang windu secara intensif 6 Ed. AgroMedia Pustaka. Jakarta.
![Figure 3. WSSV detection. band amplificated in 207 bp indicated sample was infected by WSSV, Description: M:Marker, K:Control, 1:Mild, 2:Moderate, 3: Severe [15]](https://thumb-ap.123doks.com/thumbv2/123dok/2881712.1696828/5.595.98.268.380.568/figure-detection-amplificated-indicated-infected-description-control-moderate.webp)