Lampiran 1
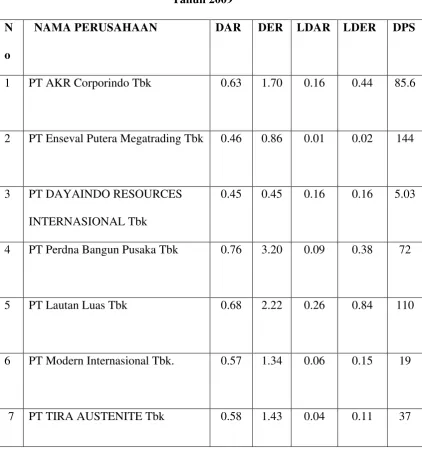
Data Variabel Tabel 1
Data Variabel Tahun 2009 N
o
NAMA PERUSAHAAN DAR DER LDAR LDER DPS
1 PT AKR Corporindo Tbk 0.63 1.70 0.16 0.44 85.6
2 PT Enseval Putera Megatrading Tbk 0.46 0.86 0.01 0.02 144
3 PT DAYAINDO RESOURCES
INTERNASIONAL Tbk
0.45 0.45 0.16 0.16 5.03
4 PT Perdna Bangun Pusaka Tbk 0.76 3.20 0.09 0.38 72
5 PT Lautan Luas Tbk 0.68 2.22 0.26 0.84 110
6 PT Modern Internasional Tbk. 0.57 1.34 0.06 0.15 19
74
Sumber :
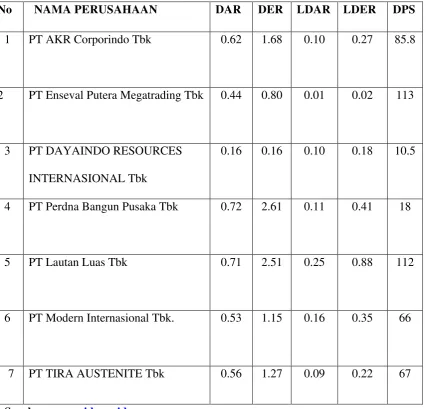
Tabel 2 Data Variabel
Tahun 2010
No NAMA PERUSAHAAN DAR DER LDAR LDER DPS
1 PT AKR Corporindo Tbk 0.62 1.68 0.10 0.27 85.8
2 PT Enseval Putera Megatrading Tbk 0.44 0.80 0.01 0.02 113
3 PT DAYAINDO RESOURCES
INTERNASIONAL Tbk
Data Variabel Tahun 2011 N
o
NAMA PERUSAHAAN DAR DER LDAR LDER DPS
1 PT AKR Corporindo Tbk 0.56 1.32 0.10 0.24 595.2
2 PT Enseval Putera Megatrading Tbk 0.44 0.79 0.01 0.01 135
3 PT DAYAINDO RESOURCES
INTERNASIONAL Tbk
76 Lampiran 2
Statistik Descriptive
Sumber: hasil pengelohan SPSS (2013)
N Minimum
m
Maximum
M
Mean Std. Deviation
Hasil Uji Normalitas
One-Sample Kolmogorov-Smirnov Test
Unstandardiz
ed Residual
N 21
Normal Parametersa,,b Mean .0000000
Std. Deviation 31.37386009
Most Extreme Differences Absolute .149
Positive .081
Negative -.149
Kolmogorov-Smirnov Z .681
Asymp. Sig. (2-tailed) .742
78
Hasil Uji Multikolonieritas
Coefficients
Model
Unstandardized Coefficients
Standardized
Coefficients
t Sig.
Collinearity Statistics
B Std. Error Beta Tolerance VIF
Hasil Uji autokorelasi
Model Summaryb
Model R R Square Adjusted R Square
Std. Error of the
Estimate Durbin-Watson
1 .967a .934 .912 36.22741 2.580
a. Predictors: (Constant), ROE, LDER, DAR, DER, LDAR
b. Dependent Variable: DPS
Hasil Uji Hipotesis (Uji t)
Coefficientsa
Model
Unstandardized Coefficients
Standardized
a. Dependent Variable: DPS
82
ANOVAb
Model Sum of Squares df Mean Square F Sig.
1 Regression 279504.463 5 55900.893 42.594 .009a
Residual 19686.382 15 1312.425
Total 299190.845 20
a. Predictors: (Constant), ROE, LDER, DAR, DER, LDAR
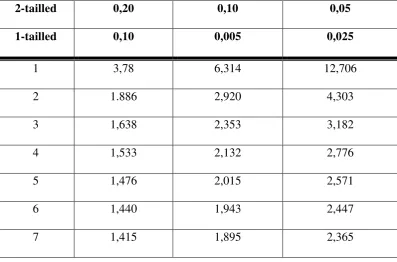
Lampiran 6
Tabel t dengan signifikansi 5%
Lampiran 7
Tabel F dengan signifikansi 5%
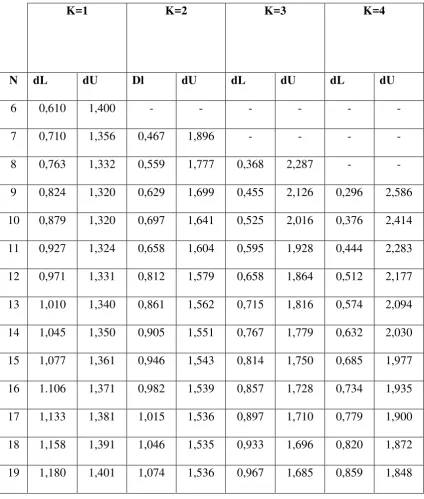
Lampiran 8
Tabel Durbin Watson