AUTHORS
Indonesia Climate Change Sectoral Roadmap – ICCSR
Scientiic Basis: Analysis and Projection of Temperature and Rainfall Adviser
Prof. Armida S. Alisjahbana, Minister of National Development Planning/Head of Bappenas
Editor in Chief
U. Hayati Triastuti, Deputy Minister for Natural Resources and Environment, Bappenas ICCSR Coordinator
Edi Effendi Tedjakusuma, Director of Environmental Affairs, Bappenas Editors
Irving Mintzer, Syamsidar Thamrin, Heiner von Luepke, Dieter Brulez
Synthesis Report
Coordinating Authors for Adaptation: Djoko Santoso Abi Suroso
Scientiic Basis: Analysis and Projection of Temperature and Rainfall Report
Author: Tri Wahyu Hadi
Technical Supporting Team
Chandra Panjiwibowo, Hendra Julianto, Leyla Stender, Tom Harrison, Ursula Flossmann-Krauss
Administrative Team
Altamy Chrysan Arasty, Risnawati, Rinanda Ratna Putri, Siwi Handinah, Wahyu Hidayat, Eko Supriyatno, Rama Ruchyama, Arlette Naomi, Maika Nurhayati, Rachman
ICCSR - SCIentIfIC BaSIS: analySIS and PRojeCtIon of temPeRatuRe and RaInfall
ACKNOWLEDGMENTS
The Indonesia Climate Change Sectoral Roadmap (ICCSR) is meant to provide inputs for the next ive year Medium-term Development Plan (RPJM) 2010-2014, and also for the subsequent RPJMN until 2030, laying particular emphasis on the challenges emerging in the forestry, energy, industry, agriculture, transportation, coastal area, water, waste and health sectors. It is Bappenas policy to address these challenges and opportunities through effective development planning and coordination of the work of all line ministries, departments and agencies of the Government of Indonesia (GoI). It is a dynamic document and it will be improved based on the needs and challenges to cope with climate change in the future. Changes and adjustments to this document would be carried out through participative consultation among stakeholders.
High appreciation goes to Mrs. Armida S. Alisyahbana as Minister of National Development Planning /Head of the National Development Planning Agency (Bappenas) for the support and encouragement. Besides, Mr. Paskah Suzetta as the Previous Minister of National Development Planning/ Head of Bappenas who initiated and supported the development of the ICCSR, and Deputy Minister for Natural Resources and Environment, Ministry of National Development Planning /Bappenas, who initiates and coordinates the development of the ICCSR.
To the following steering committee, working groups, and stakeholders, who provide valuable comments and inputs in the development of the ICCSR Scientiic Basis for Analysis and Projection of Temperature and Rainfall document, their contributions are highly appreciated and acknowledged:
Steering Committee (SC)
Deputy of International Cooperation, Coordinating Ministry for Economy; Secretary of Minister, Coordinating Ministry for Public Welfare; Executive Secretary, Agency for Meteorology, Climatology; Deputy of Economy, Deputy of Infrastructures, Deputy of Development Funding, Deputy of Human Resources and Culture, Deputy of Regional Development and Local Autonomy, National Development Planning Agency; and Chief of Secretariat of the National Council for Climate Change.
Working Group
National Development Planning Agency
Sriyanti, Yahya R. Hidayat, Bambang Prihartono, Mesdin Kornelis Simarmata, Arum Atmawikarta, Montty Girianna, Wahyuningsih Darajati, Basah Hernowo, M. Donny Azdan, Budi Hidayat, Anwar Sunari, Hanan Nugroho, Jadhie Ardajat, Hadiat, Arif Haryana, Tommy Hermawan, Suwarno, Erik Amundito,
ICCSR - SCIentIfIC BaSIS: analySIS and PRojeCtIon of temPeRatuRe and RaInfall
Rizal Primana, Nur H. Rahayu, Pungki Widiaryanto, Maraita, Wijaya Wardhana, Rachmat Mulyanda, Andiyanto Haryoko, Petrus Sumarsono, Maliki
Agency for Meteorology, Climatology and Geophysics
Edvin Aldrian, Dodo Gunawan, Nurhayati, Soetamto, Yunus S, Sunaryo
National Institute of Aeuronatics and Space
Agus Hidayat, Halimurrahman, Bambang Siswanto, Erna Sri A, Husni Nasution
Research and Implementatiton of Technology Board
Eddy Supriyono, Fadli Syamsuddin, Alvini, Edie P
National Coordinating Agency for Survey and Mapping
Suwahyono, Habib Subagio, Agus Santoso
Grateful thanks to all staff of the Deputy Minister for Natural Resources and Environment, Ministry of National Development Planning/ Bappenas, who were always ready to assist the technical facilitation as well as in administrative matters for the inalization process of this document.
SCIentIfIC BaSIS: analySIS and PRojeCtIon of temPeRatuRe and RaInfall ICCSR - SCIentIfIC BaSIS: analySIS and PRojeCtIon of temPeRatuRe and RaInfall
v
Remarks from Minister of National
Development Planning/Head of Bappenas
We have seen that with its far reaching impact on the world’s ecosystems as well as human security and development, climate change has emerged as one of the most intensely critical issues that deserve the attention of the world’s policy makers. The main theme is to avoid an increase in global average temperature that exceeds 2˚C, i.e. to reduce annual worldwide emissions more than half from the present level in 2050. We believe that this effort of course requires concerted international response – collective actions to address potential conl icting national and international policy initiatives. As the world economy is now facing a recovery and developing countries are struggling to fuli ll basic needs for their population, climate change exposes the world population to exacerbated life. It is necessary, therefore, to incorporate measures to address climate change as a core concern and mainstream in sustainable development policy agenda. We are aware that climate change has been researched and discussed the world over. Solutions have been proffered, programs funded and partnerships embraced. Despite this, carbon emissions continue to increase in both developed and developing countries. Due to its geographical location, Indonesia’s vulnerability to climate change cannot be underplayed. We stand to experience signii cant losses. We will face – indeed we are seeing the impact of some these issues right now- prolonged droughts, l ooding and increased frequency of extreme weather events. Our rich biodiversity is at risk as well.
Those who would seek to silence debate on this issue or delay in engagement to solve it are now marginalized to the edges of what science would tell us. Decades of research, analysis and emerging environmental evidence tell us that far from being merely just an environmental issue, climate change will touch every aspect of our life as a nation and as individuals.
planning and priority setting.
I am delighted therefore to deliver Indonesia Climate Change Sectoral Roadmap, or I call it ICCSR, with the aim at mainstreaming climate change into our national medium-term development plan.
The ICCSR outlines our strategic vision that places particular emphasis on the challenges emerging in the forestry, energy, industry, transport, agriculture, coastal areas, water, waste and health sectors. The content of the roadmap has been formulated through a rigorius analysis. We have undertaken vulnerability assessments, prioritized actions including capacity-building and response strategies, completed by associated inancial assessments and sought to develop a coherent plan that could be supported by line Ministries and relevant strategic partners and donors.
I launched ICCSR to you and I invite for your commitment support and partnership in joining us in realising priorities for climate-resilient sustainable development while protecting our population from further vulnerability.
Minister for National Development Planning/ Head of National Development Planning Agency
SCIentIfIC BaSIS: analySIS and PRojeCtIon of temPeRatuRe and RaInfall ICCSR - SCIentIfIC BaSIS: analySIS and PRojeCtIon of temPeRatuRe and RaInfall
vii
Remarks from Deputy Minister for Natural
Resources and Environment, Bappenas
To be a part of the solution to global climate change, the government of Indonesia has endorsed a commitment to reduce the country’s GHG emission by 26%, within ten years and with national resources, benchmarked to the emission level from a business as usual and, up to 41% emission reductions can be achieved with international support to our mitigation efforts. The top two sectors that contribute to the country’s emissions are forestry and energy sector, mainly emissions from deforestation and by power plants, which is in part due to the fuel used, i.e., oil and coal, and part of our high energy intensity.
With a unique set of geographical location, among countries on the Earth we are at most vulnerable to the negative impacts of climate change. Measures are needed to protect our people from the adverse effect of sea level rise, l ood, greater variability of rainfall, and other predicted impacts. Unless adaptive measures are taken, prediction tells us that a large fraction of Indonesia could experience freshwater scarcity, declining crop yields, and vanishing habitats for coastal communities and ecosystem.
National actions are needed both to mitigate the global climate change and to identify climate change adaptation measures. This is the ultimate objective of the Indonesia Climate Change Sectoral Roadmap, ICCSR. A set of highest priorities of the actions are to be integrated into our system of national development planning. We have therefore been working to build national concensus and understanding of climate change response options. The Indonesia Climate Change Sectoral Roadmap (ICCSR) represents our long-term commitment to emission reduction and adaptation measures and it shows our ongoing, inovative climate mitigation and adaptation programs for the decades to come.
Deputy Minister for Natural Resources and Environment National Development Planning Agency
TABLE OF CONTENTS
ACKNOWLEDGMENTS iii
Remarks from Minister of National Development Planning/Head of Bappenas v
Remarks from Deputy Minister for Natural Resources and Environment, Bappenas vii
TABLE OF CONTENTS viii
LIST OF TABLES xi
LIST OF FIGURES xii
LIST OF ABBREVIATION xiv
1.INTRODUCTION 1
1.1 Background and Objectives 2
1.2 Scope of Discussions and Contents of This Report 3
2.GENERAL DESCRIPTION 5
2.1 Global Climate System and Deinition of Climate Change 6
2.2 Global Climate Change Scenario and Projection 7 2.3 Global Circulation Model (GCM) Performance in Tropical Area 9 2.4 Study of Climate Change and Its Impact in Indonesia 9
3.ANALYSIS AND PROJECTION OF CLIMATE CHANGE IN INDONESIA 13
3.1 Data Availability 14
3.1.1 Observational Data 14
3.1.2 GCM Output Data 14
3.1.3 High-Resolution GCM Output Data 15
3.2 Data Processing Method 16
nfall ICCSR - SCIentIfIC BaSIS: analySIS and PRojeCtIon of temPeRatuRe and RaInfall
ix
4.RESULTS AND DISCUSSIONS 21
4.1. Current Climate Change Trends in Indonesia 22
4.1.1 Rainfall Change 22
4.1.2 Surface Temperature Change 24
4.1.3 Probability Change for Extreme Weather and Climate 25 4.2 Climate Change in 2030s Period and 2080 Period 28 4.2.1 Projection of Surface Temperature Change 28
4.2.2 Projection of Rainfall Change 31
4.2.3 Projection of Probability Change for Extreme Weather and Climate 31
5.GENERAL RECOMMENDATION FOR SECTORAL ADAPTATION 33
5.1 Description of Climate Change for Each Region 34
5.1.1 Climate Change in Java-Bali Area 34
5.1.2 Climate Change in Sumatera Area 34
5.1.3 Climate Change in Kalimantan Area 35
5.1.4 Climate Change in Sulawesi Area 35
5.1.5 Climate Change in Nusatenggara Area 35
5.1.6 Climate Change in Moluccas Area 36
5.1.7 Climate Change in Papua Area 36
5.2 Additional Notes 36
5.2.1 Long Term Climate Variability 36
5.2.2 Climate Projection Uncertainties 38
6. CLOSING REMARK 41
References 43
APPENDIX A : RAINFALL BASELINE BASED ON GPCC DATA 45
APPENDIX B1 : RAINFALL CHANGE PROJECTION 2010-2015 47
APPENDIX B2 : RAINFALL CHANGE PROJECTION 2015-2020 51
APPENDIX C : AREA DIVISION 54
APPENDIX D1 : TEMPERATURE PROJECTION FOR 2030s AND 2080s IN JAVA BALI 56 APPENDIX D2 : TEMPERATURE PROJECTION FOR 2030s AND 2080s IN KALIMANTAN 57 APPENDIX D3 : TEMPERATURE PROJECTION FOR 2030s AND 2080s IN MALUKU 58 APPENDIX D4 : TEMPERATURE PROJECTION FOR 2030s AND 2080s IN NUSA TENGGARA 59 APPENDIX D5 : TEMPERATURE PROJECTION FOR 2030s AND 2080s IN PAPUA 60 APPENDIX D6 : TEMPERATURE PROJECTION FOR 2030s AND 2080s IN SULAWESI 61 APPENDIX D7 : TEMPERATURE PROJECTION FOR 2030s AND 2080s IN SUMATERA 62 APPENDIX E1 : RAINFALL PROJECTION FOR 2030s AND 2080s IN JAVA-BALI 63 APPENDIX E2 : RAINFALL PROJECTION FOR 2030s AND 2080s IN KALIMANTAN 64 APPENDIX E3 : RAINFALL PROJECTION FOR 2030s AND 2080s IN MALUKU 66 APPENDIX E4 : RAINFALL PROJECTION FOR 2030s AND 2080s IN NUSA TENGGARA 67 APPENDIX E1 : RAINFALL PROJECTION FOR 2030s AND 2080s IN PAPUA 68 APPENDIX E1 : RAINFALL PROJECTION FOR 2030s AND 2080s IN SULAWESI 69 APPENDIX E1 : RAINFALL PROJECTION FOR 2030s AND 2080s IN SUMATERA 70
nfall ICCSR - SCIentIfIC BaSIS: analySIS and PRojeCtIon of temPeRatuRe and RaInfall
xi
LIST OF TABLES
LIST OF ABBREVIATION
AMO Atlantic Multidecadal Oscillation
ASEAN Association of South East Asian Nations Bappenas National Development Planning Agency
BMKG Meteorology Climatology and Geophysics Agency CDF Cumulative Distribution Function
CGCM Coupled General Circulation Model
CO2 Carbon Dioxide
CH4 Methane
EN El Nino
ENSO El Niño Southern Oscillation
FGD Focus Group Discussion
GCM General Circulation Model
GHCN Global Historical Climatological Network
GHG Greenhouse Gas
GPCC Global Precipitation Climatology Center
IOD Indian Ocean Dipole
IPCC AR-4 Intergovernmental Panel on Climate Change Assessment Report 4 LAPAN National Aeronautics and Space Agency
LN La Nina
MJO Madden-Julian Oscillation
MRI Meteorological Research Institute
NOAA National Oceanic and Atmospheric Agency PDO Paciic Decadal Oscillation
PPM Part per Million
SRES Special Report on Emission Scenario UNEP United Nations Environmental Program
SCIentIfIC BaSIS: analySIS and PRojeCtIon of temPeRatuRe and RaInfall ICCSR - SCIentIfIC BaSIS: analySIS and PRojeCtIon of temPeRatuRe and RaInfall
1.1 Background and Objectives
Since the IPCC (Intergovernmental Panel on Climate Change) was established in 1988 by WMO (World Meteorological Organization) and UNEP (United Nations Environmental Program), and thereafter published the reports of their studies, the global climate change issue has inluenced the opinion of most of the people in the world and started to affect development policies in many countries, including Indonesia. The main problem of the global climate change issue is the increase of Earth surface temperature due to the greenhouse effect caused by accumulated greenhouse gases such as CO2 (carbon dioxide) and CH4 (methane) in the atmosphere. It is known that the concentration of atmospheric greenhouse gases increases as a result of - among others - industrial activities, use of fossil fuels and land use, land use change and forestry processes. Further increase of Earth surface temperature in the future, is predicted to induce thermal expansion of ocean water and the melting of icecaps in both poles, North Pole and South Pole (Greenland and Antarctic), that lead to the rise of global mean sea level. Furthermore, it is assumed with increasing certainty that global warming will also inluence or has already inluenced the global climate pattern that triggers the increasing frequency of extreme weather and climatic events. Considering the abundance of negative impacts that are predicted to occur in the future, the international community has made efforts to mitigate (by means of reduction of anthropogenic greenhouse gas emissions) and to adapt to (by means of development strategies and policies to increase resilience or enhance protection against the negative impacts) the global climate change. However, any mitigation or adaptation action plan will create complex socio-economic problems as its implementations will directly inluence a broad spectrum of societies.
In general, adaptation and mitigation actions and plans devised in various international forums have been based on IPCC climate projections which are formulated on the basis of studies using global climate models. However, climate model output has its inherent uncertainties (IPCC, 2007) and, according to Schneider (2002), the uncertainty propagates and grows from various levels: from the response of the global climate system according to emission scenarios, to regional climate change scenario, and to the possible impacts that may occur. The problem of uncertainties in climate models is still debated among climate scientists but the decision to mitigate and adapt must still be taken regardless the discrepancy between academic understanding and policy-making (Pielke, 2003).
a Roadmap for Mainstreaming of Climate Change into National Development Planning (hereafter the Roadmap for brevity). The objectives of this study are:
1) Identiication of climate change in Indonesia, to gain scientiic evidence on its characteristics and various probable impacts on the national development.
2) Understanding of the general characteristics (pattern and magnitude) of future climate change hazard in Indonesia so its impacts to the development sectors can be estimated, and
3) Preparing climate data that can be used to analyse the risk of climate change to the development sectors with a temporal and spatial resolution that is tailored as best as possible with the unique characteristics of each region (and/or sub-region).
With all shortcomings and numerous obstacles faced during its implementation, it is hoped that this study can contribute signiicantly to the process of developing the Roadmap.
1.2 Scope of Discussions and Contents of This Report
This Analysis and Projection of Climate Change in Indonesia incorporates results from existing studies, be it from individual studies or studies conducted by institutions such as BMKG (Agency for Meteorology, Climatology, and Geophysiscs/Badan Meteorologi, Klimatologi, dan Geoisika), LAPAN (National Aeronautics and Space Agency/ Lembaga Penerbangan dan Antariksa Nasional), etc. Therefore, this study was initialised by conducting a Scientiic Basis FGD (Focus Group Discussion) on February 4, 2009 meant to map the products of climate change studies relevant to Indonesia that meet the previously mentioned three objectives. However, we could only gather very limited information from the FGD. It was then necessary for us to conduct data analysis in this study and to include data processing methods in the scope of discussion. The contents of this report are outlined below.
The general description of review of the problems related to the analysis and projection of climate change is discussed in Chapter 2. Whereas, Chapter 3 contains a description of methodology, data, and data processing techniques used in the analysis and projection of climate change in Indonesia. The result of the data analysis is discussed in Chapter 4, while Chapter 5 contains additional discussions related to conidence level of the results and other notes on aspects of long-term climatology, as well as general recommendation for sectors. In the last chapter we provide some suggestions on how to strengthen academic study on climate change in Indonesia.
nfall ICCSR - SCIentIfIC BaSIS: analySIS and PRojeCtIon of temPeRatuRe and RaInfall
SCIentIfIC BaSIS: analySIS and PRojeCtIon of temPeRatuRe and RaInfall ICCSR - SCIentIfIC BaSIS: analySIS and PRojeCtIon of temPeRatuRe and RaInfall
2.1 Global Climate System and Defi nition of Climate Change
Academically speaking in the broadest sense, climate can be dei ned as the state of the climate system that comprises the components such as: atmosphere (air), hydrosphere (water), lithosphere (the solid part of the Earth, including Earth crust, and volcanoes), cryosphere (ice sheets), and biosphere (vegetation). All components of the climate system interact with one another to preserve the system and create a particular condition in a particular time and space. The interactions in the climate system involve complex processes with timescales ranging from seconds to millions of years and spatial dimensions that range from molecular to planetary scales.
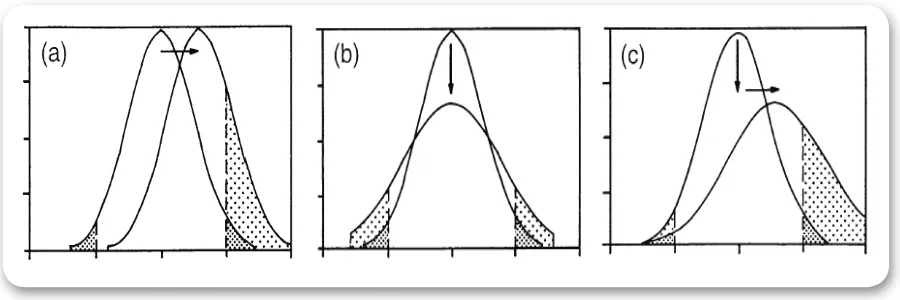
Climate can be dei ned as the statistical description of the elements of climate/weather such as temperature, precipitation (rainfall), wind, etc., that at least describe the average value (mean) and its variance for several decades (30 years by WMO’s dei nition). According to Meehl (2000), climate change can be identii ed by comparing the probability distributions as illustrated in Figure 1 so that the changes (between two 30-year consecutive periods) in the mean or variance, or in both values, could be identii ed. Based on this dei nition, all changes that occur within each of the 30-year period are referred to as the climate variability. Another consequence is that to identify the current climate change, we need historical climate data for at least 60 years. However, this is not the only dei nition that is used internationally; in the UNFCCC (United Nation Framework Convention on Climate Change), for example, climate change is dei ned as the changes in climate that occur in addition to its natural variability over a similar timescale, and it can be attributed either directly or indirectly to human activities that cause changes in global atmosphere composition and/or land uses.
Figure 2.1Identii cation of climate changes statistically from (a) change in mean, (b) change in
SCIentIfIC BaSIS: analySIS and PRojeCtIon of temPeRatuRe and RaInfall ICCSR - SCIentIfIC BaSIS: analySIS and PRojeCtIon of temPeRatuRe and RaInfall
7
In reality, when global climate change occurs, it is very difi cult to scientii cally distinguish between natural changes and the changes attributed to human activities. Moreover, in the context of adaptation, it is unnecessary and irrelevant to associate the impact of climate change with the cause of the climate changes. For this reason, we adopt Meehl’s (2000) structure of thinking to formulate the identii cation of climate change operationally (Figure 2.1) so that, in principle, climate change hazard can be identii ed statistically without addressing the problem of whether a human (anthropogenic) factor is involved or not.
2.2 Global Climate Change Scenario and Projection
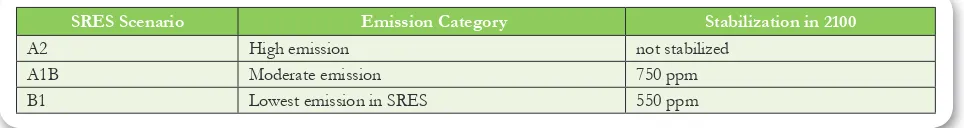
IPCC has comprehensively discussed global climate projection problem based on GCM (Global Circulation Model ) simulations as described in Climate Change 2007: The Physical Science Basis (IPCC AR-4, The Fourth Assessment Report). In general, IPCC models mainly produce features of climate change that are caused by increased concentrations of greenhouse gases in the atmosphere resulting from anthropogenic actions and based on known mechanisms. In regard to that, the scenarios of increasing greenhouse gases concentration become an inseparable part of climate change projection. These scenarios are determined typically by some alternative assumptions of global economic and population growth, technology development, etc. A widely used set of scenarios are described in the SRES (Special Report on Emissions Scenarios) published by IPCC in 2000. Aside from SRES, there are other scenarios like IS92 and SA90 that were used in previous IPCC reports. A detailed explanation of these scenarios can be found for example in IPCC-TGICA (2007). To simplify the problem, in this study we will only use IPCC data that are related to three SRES scenarios B1, A1B, and A2 that are selected based on CO2 concentration level as shown in Table 2.1.
Table 2.1 SRES scenarios and emission level discussed in this study (adapted from IPCC, 2007b)
SRES Scenario Emission Category Stabilization in 2100
A2 High emission not stabilized
A1B Moderate emission 750 ppm
B1 Lowest emission in SRES 550 ppm
projected rainfall, as different models produce different rainfall values that vary signii cantly in space and time. Aside from that, for the needs of a climate change impact study, a commonly known problem in using GCM data is inadequate resolution to represent climate variability at any specii c location. For this reason, to i t the needs for impact study, a process called downscaling is needed.
In principle, downscaling is a technique to process the global model output to obtain a higher resolution data. According to the tools being used, the methods for downscaling can generally be classii ed either as (1) statistical or (2) dynamical downscaling. Dynamical downscaling is based on the application of a mathematical model that is consistent with the physical description of the climate system. The disadvantages of this method are that it requires a huge amount of computational resources and the estimated values usually have large bias against observational data. On the other hand, the statistical downscaling method can produce an estimation with sufi cient accuracy using much less computational resources but the results may not be able to be interpreted physically as the model parameters for different variables may largely vary (models are less consistent). Furthermore, the implementation of statistical downscaling requires a relatively complete observational data. In principle, both models can be used for downscaling climate projection as both produce results with comparable accuracy (Wilby et al., 2004). As previously discussed, the source of climate projection is the output of global model (GCM). Before implementing any downscaling procedure, it is necessary to investigate whether the GCM output data under consideration are good indicators for climatic variations in the studied region.
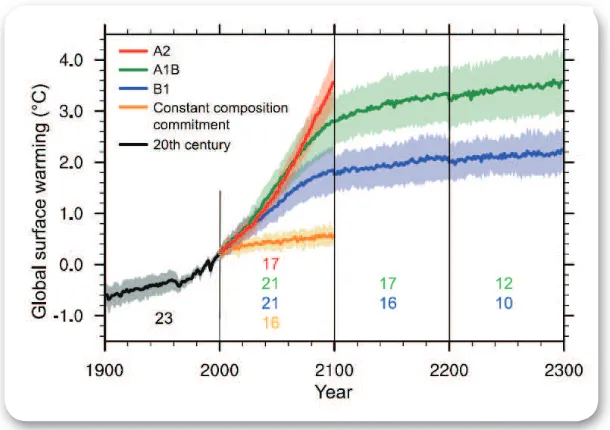
Figure 2.2 Global surface temperature change projection using three SRES scenario, B1, A1B and A2.
nfall ICCSR - SCIentIfIC BaSIS: analySIS and PRojeCtIon of temPeRatuRe and RaInfall
9
2.3 Global Circulation Model (GCM) Performance in Tropical AreaThe climate of the Indonesian region is mainly controlled by the monsoon circulation system with two basic patterns of rainy and dry seasons. Based on the pattern of the peak rainfall periods during rainy season, there are three types of climate region (e.g. Aldrian and Susanto, 2003); they are: (1) monsoonal (with one peak rainfall period around December-January-February), (2) equatorial (with two peaks around April-May and October-November), and (3) local (one dominant peak around June-July). In addition to monsoon, Indonesia is also climatologically inluenced by the global ocean-atmosphere dynamics that create various climate variability phenomena so that the rain characteristic for a given month can vary greatly from year to year. The most signiicant interannual (with the period of occurrence between 2 and 5 years ) climate variability phenomena in Indonesia are associated with ENSO (El Nino Southern Oscillation) in the Paciic Ocean and, more recently found, IOD (Indian Ocean Dipole) in the Indian Ocean. Furthermore, there are also MJO (Madden-Julian Oscillation) phenomenon that can induce rainfall variation in 30-60 days period and other phenomena that are still being studied by scientists. The existence of various climatological phenomena in the tropical region leads to a highly complex interaction with the monsoon circulation system and cause a variability that is dificult to be perfectly simulated in climate models.
Several scientists have conducted studies to evaluate the performance of global climate model for South East Asia region that is inluenced by monsoon circulation system. It is found that various models produce different results. Nevertheless, one of the important aspects studied in global model performance study is the ENSO-Monsoon correlation and the correspondence between the model results and observation. Joseph and Nigam (2006) reported that HadCM3, the model run in England, produces the most realistic ENSO signal. Meanwhile, Annamalai et al. (2006) found that from 16 IPCC AR-4 models evaluated; only 4 of them show a robust ENSO-Monsoon tele-connection. The four models are GFDL 2.0, GFDL 2.1 (USA), MRI (Japan), and ECHAM-5 (German). A (literature) study on IPCC model performance was conducted by Smith (2009) from various existing validation results (not limited to tropical areas). The result was a ranking of 22 models that is consistent with the previous studies. The top ten models are: (1)HadCM3, (2)MIROC3.2(hires), (3)GFDL2.1, (4)GFDL2.0, (5)MIROC3.2(medres), (6)ECHO-G, (7)HadGEM1, (8)ECHAM5, (9)MRI-CGCM2.3.2, and (10)CCSM3. Reichler (2008) stated that the average of global model outputs gives a better result than any individual model. Therefore, we can assume that if we use models that are known to perform well in tropical areas, the composite (mean) value will also give a better estimate for any parameter of interest compared to that of individual models.
2.4 Study of Climate Change and Its Impact in Indonesia
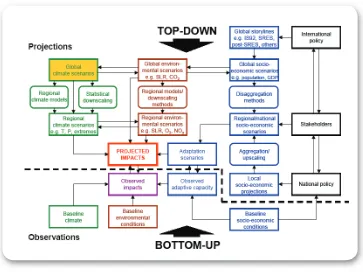
parameters, while the top-down approach is based on GCM simulation results in correlation to scenarios of changes in global environment and socio-economic conditions. The bottom-up approach can be used to study climate changes that are currently happening or may occur in near future. On the other hand, the top-down approach is the only way to obtain climate projections for the distant future.
Figure 2.3 Flowchart of the analysis of climate change and its impacts for two approaches, bottom-up
and top-down. (Source : IPCC, 2007b)
SCIentIfIC BaSIS: analySIS and PRojeCtIon of temPeRatuRe and RaInfall ICCSR - SCIentIfIC BaSIS: analySIS and PRojeCtIon of temPeRatuRe and RaInfall
11
The most recent information on changing trends in rainfall in Indonesia is obtained from Soetamto (2009). In the presentation delivered during FGD discussion on February 24, 2009, an analysis of monthly data for rainfall in Indonesia over 50 years (1951-2000) shows a linear trend. This result suggests that the rainfall change trend is different for each month. However, the validity of this result is difi cult to evaluate as there are no information on the data source and its processing methodology. For this reason, to meet the objective of this study, more data collection and analysis were needed.
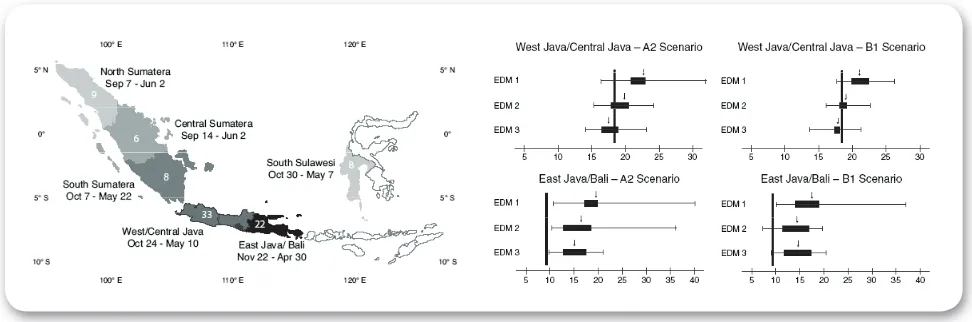
The use of the top-down approach (using GCM data) for scientii c studies on climate change in Indonesia is also still very limited. Boer and Faqih (2004) analyse some GCM results including those of CSIRO Mark 2 (Australia), HadCM3 (England), and ECHAM-4 (Germany). They obtained a varied climate projection particularly for rainfall. Santoso and Forner (2006) reviewed several existing studies and found that GCM projections for rainfall in Indonesia have large uncertainties. A more comprehensive study that also covers climate change risk analysis for agriculture is reported by Naylor, et al. (2007). Climate projection is done using empirical (statistical) downscaling model for 20 GCM outputs and average rainfall for areas dei ned in 8 regions. One of the important results of this study is the identii cation of climate change threat in the form of increased probability of delay by up to 30 days in the onset of the rainy season in year 2050, particularly in Java and Bali (Figure 2.4), which are the centre of rice agriculture in Indonesia. This threat will greatly inl uence the rice planting activities, as these activities rely on water availability during the rainy season. The applicability of the study done by Naylor et al. (2007) is quite limited because the analysis was only performed for average rainfall in the dei ned areas for the year 2050.
Figure 2.4 Division of areas for study on climate change impact using IPCC AR-4 model by Naylor
SCIentIfIC BaSIS: analySIS and PRojeCtIon of temPeRatuRe and RaInfall ICCSR - SCIentIfIC BaSIS: analySIS and PRojeCtIon of temPeRatuRe and RaInfall
13
ANALYSIS AND
PROJECTION OF
CLIMATE CHANGE
IN INDONESIA
As explained earlier and following Boer and Faqih (2004), the analysis and projection of climate change in Indonesia was carried out using two approaches: (1) historical data analysis (bottom-up) and (2) GCM output analysis (top-down). In principle, the method is designed to be as simple as possible but still to produce output that can be used by all sectors in estimating climate change risks. The data and methodology that we used are explained below.
3.1 Data Availability
3.1.1 Observational Data
As detailed by Manton et al. (2001), climatology data with a good quality and continuity is not easy to obtain for all of Indonesia. Considering that these analyses needed to be done immediately, we obtained the data from sources on the internet that can be easily and immediately accessed. Here is the description of the data available on the internet:
• GHCN (Global Historical Climatological Network) provides temperature and rainfall data for quite a long period (1860s – now). However, data for the stations in Indonesia is generally only available up through year 1975, except for a few stations. This data can be accessed online at http://www. ncdc.noaa.gov/.
• GPCC (Global Precipitation Climatology Center) provides rainfall data in 0.5º x 0.5º grid form. The data are available for a long time range of 1901-2007, even though some of the data are the result of interpolation. This data can be accessed online at: ftp://ftp-anon.dwd.de/pub/data/ gpcc/html/fulldata_download.html.
Aside from the data mentioned above, we also had access to ASEAN Compendium of Climate Statistics data (1975 – 1999). These datasets include rainfall and daily temperature data from all over Indonesia, but the quality of data is limited, as there are many missing data. Even so, the data from several stations can be processed as monthly data and can be used to complement GHCN data.
3.1.2 GCM Output Data
SCIentIfIC BaSIS: analySIS and PRojeCtIon of temPeRatuRe and RaInfall ICCSR - SCIentIfIC BaSIS: analySIS and PRojeCtIon of temPeRatuRe and RaInfall
15
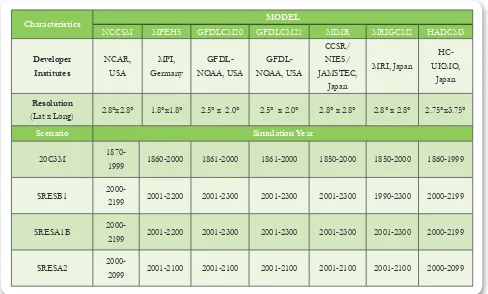
Table 3.1 Short description of GCM output data analysed in this study.
Characteristics MODEL
NCCSM MPEH5 GFDLCM20 GFDLCM21 MIMR MRIGCM2 HADCM3
Developer
1999 1860-2000 1861-2000 1861-2000 1850-2000 1850-2000 1860-1999
SRESB1
2000-2199 2001-2200 2001-2300 2001-2300 2001-2300 1990-2300 2000-2199
SRESA1B
2000-2199 2001-2200 2001-2300 2001-2300 2001-2300 2001-2300 2000-2199
SRESA2
2000-2099 2001-2100 2001-2100 2001-2100 2001-2100 2001-2100 2000-2099
From Table 3.1 it can be seen that GCM outputs resolution in general are very coarse; ranging around 2º, or more than 200 km for tropical areas. Even so, for regional or macro-scale study, these data can already give a description for climate projection. In several existing studies (Boer and Faqih, 2004; Santoso and Forner, 2006), the GCM data used only has coarse (global) resolution. On the other hand, although already using empirical downscaling, Naylor et al. (2007) did not produce data with high resolution, but only areal average data (or even provincial data) which are then corrected (calibrated) with observational data.
3.1.3 High-Resolution GCM Output Data
3.2 Data Processing Method
3.2.1 Observational Data Processing
Observational data processing in general is meant to obtain climate change indicators by looking at the mean and variance (standard deviation) of changes in the underlying trends. Overall, the analyses done are basic statistical analysis and can be explained as follows:
(a) Moving average calculation of climate period (30 years) for each particular year interval. This calculation is done for each month in a year.
(b) For each averaging period, the standard deviation is also calculated so that changes in climate variability can be analysed.
(c) Empirical CDF (Cumulative Distribution Function) calculation is used to analyse the change in the probability (frequency of occurrence) of high or low (rainfall) extreme.
(d) Projection of rainfall average value using polynomial trend analysis, which is different from previous analyses that assumed a linear trend (e.g., Aldrian, 2006; Soetamto, 2009).
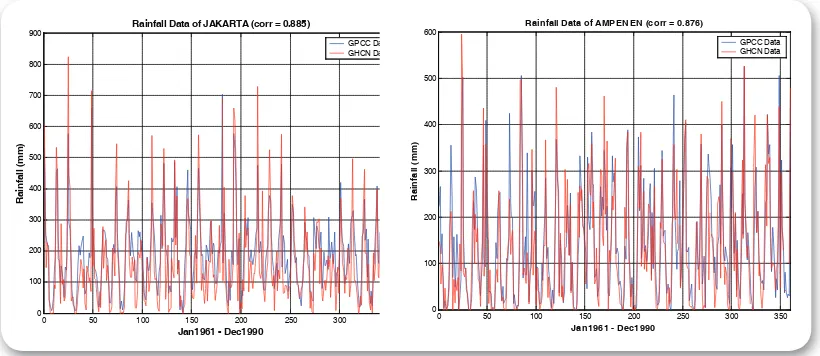
To analyse the changing spatial trends in rainfall, GPCC data is used because the GPCC data grid has a size of 0.5º. In order to ensure its compatibility with data from station (GHCN), the GPCC data needs to be evaluated i rst. We conducted the evaluation by choosing data samples from two stations i.e. Jakarta and Ampenan (Lombok) as samples to compare the two sources of data and the result can be seen in Figure 3.1 as a time series and in Figure 3.2 as a scatter plot. In this i gures, the GPCC data value are the result of interpolation to the coordinate of the station or its nearest point. It is noteworthy that the station data are composite of GHCN data with other available data (ASEAN Compendium data for Jakarta and data from BMKG for Ampenan).
0 50 100 150 200 250 300 350
Rainfall Data of JAKARTA (corr = 0.885)
GPCC Data
Rainfall Data of AMPENEN (corr = 0.876)
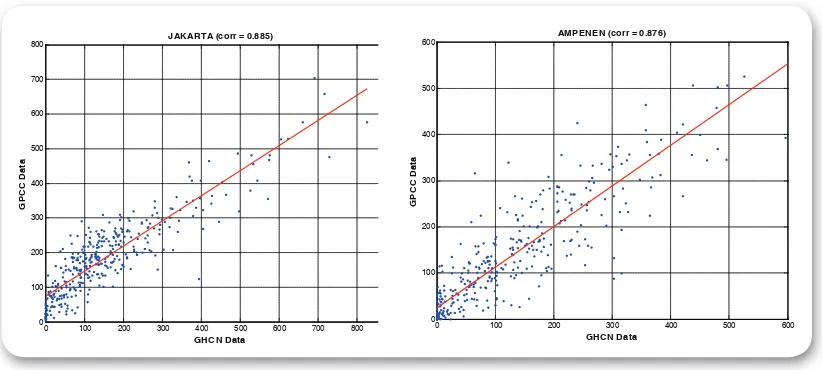
Visually, we can see that there are differences between station data and GPCC data but both exhibit similar trends. Figure 3.2 also shows that although the scattering of value is quite large, there is a signii cant linear correlation, with a coefi cient larger than 0.8. Hence, we can conclude that GPCC data can represent observational data quite well. Nonetheless, it is to be noted that not all GPCC grid data are estimated from the observation in the station because some data are purely derived from interpolation.
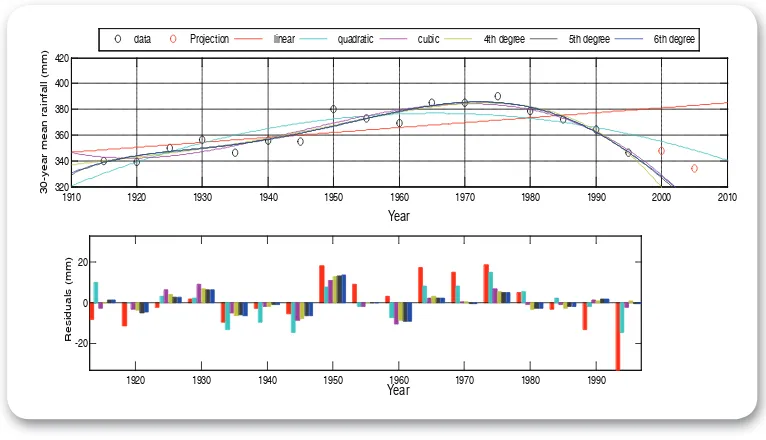
Under the assumption that GPCC data can represent observational data, most of our analysis has used this set of data to obtain the current climate change trend, including the projection of mean value and its standard deviation. As previously mentioned, the projection of mean value was done using polynomial trend. This is because the changes in rainfall over time, in general, are not linear. For example, Figure 3.3 shows the moving average data for rainfall in January for 30 years in Jakarta station and its polynomial trend analysis. In the i gure, every data point represents the average for 30 years, although it is to be noted that most of the data between 1940-1950 are empty and the average for 1995 only represent the data between 1980-2007 (which is less than 30 years)
Figure 3.2 Comparison of two rainfall datasets from station (GHCN) and GPCC in scatter plot for
the same location as in Figure 5.
0 100 200 300 400 500 600 700 800 900
SCIentIfIC BaSIS: analySIS and PRojeCtIon of temPeRatuRe and RaInfall ICCSR - SCIentIfIC BaSIS: analySIS and PRojeCtIon of temPeRatuRe and RaInfall
From Figure 3.3, it can be seen clearly that the changes of 30 year mean value follows a polynomial pattern. Even so, we did not check for every data point and every month what degree of polynomial best i ts the data. For this reason, the best projection is found by calculating a weighted average value from the available six estimations. This averaging method can be written mathematically as
Here the weighted function for every polynomial estimation is determined by
using RMSE (root mean square error) calculated from the difference between polynomial value and that of observation for every data points, and Npoly = 6 is the number of polynomial function from i rst order (linear) to sixth order.
Npoly
1920 1930 1940 1950 1960 1970 1980 1990
-20 0 20
1910 1920 1930 1940 1950 1960 1970 1980 1990 2000 2010
320
Figure 3.3 An example of 30 years moving average analysis using i rst order polynomial equation
3.2.2 GCM Data Processing
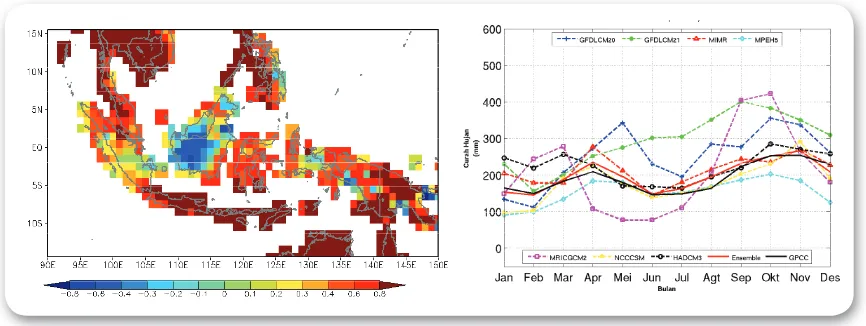
GCM data processing is basically done to i nd one model output or combination of several model outputs that i ts observational data. Based on the results of Reichler (2008) study, we assume that the ensemble average of several model which are quite consistent for tropical area will be better representing climate condition in Indonesia than an individual model. Figure 3.4 shows the spatial distribution of correlation coefi cient between baseline (1961-1990) composite annual rainfalls (average for every month) from the output of one GCM (GFDLCM20) and GPCC data. From the i gure we can see that the output of GFDLCM20 model can represent the baseline climate pattern quite well for Java islands, Nusa Tenggara islands, and some other areas in Sulawesi and Papua. But this is not the case for most of the area in Kalimantan. Therefore, for each grid point the correlation coefi cient for each model must be calculated and only models with good enough correlation is averaged to obtain climate projection value. In this case to obtain the projected value in every grid, we choose the best four models based on the correlation coefi cient value to be averaged. This approach is referred to as selective ensemble mean method. From Figure 3.4, it can also be seen that using the ensemble mean, the output of mean rainfall gives the best i t to observational data (GPCC data) although there is quite large in the GCM output values.
Figure 3.4 Distribution of composite baseline (1961-1990) correlation coefi cient between the outputs
of rainfall data from GFDLCM20 model compared to GPCC (left), and an example of the result from ensemble pattern for composite rainfall baseline for an area in Kalimantan (left). The full line with red
and black colour respectively represents the average value of ensemble and observation.
SCIentIfIC BaSIS: analySIS and PRojeCtIon of temPeRatuRe and RaInfall ICCSR - SCIentIfIC BaSIS: analySIS and PRojeCtIon of temPeRatuRe and RaInfall
The processing of GCM output data for projection of spatial pattern of temperature is more difi cult to be done as there are no representative spatial observation data available because the global data is only available on 2.5 degrees. For several observation points with the data available, we compare GCM ensemble data with observational data. Figure 3.5 shows an example of comparison of GCM data with observational data for surface temperature in two stations, Polonia-Medan and Penfui-Kupang. The comparison for the two stations shows a quite similar pattern and order of magnitude between GCM output data and observation, although it can also be clearly seen that there are bias or difference of average and variance value. This is because of the coarse grid from GCM model so that the representation of terrain condition is not quite good.
Considering the shortcomings of climatology baseline data for both rainfall and temperature, the analysis of climate projection from GCM output data here will focus more on the trend of change in climatological average value for rainfalls and temperature in the future relative to baseline period using only model data (GCM). It is expected that this analysis will be still able to provide a description about the existence of future climate change hazard.
Figure 3.5 Comparison of surface temperature data from GCM model output with the observed
SCIentIfIC BaSIS: analySIS and PRojeCtIon of temPeRatuRe and RaInfall ICCSR - SCIentIfIC BaSIS: analySIS and PRojeCtIon of temPeRatuRe and RaInfall
21
RESULTS AND
4.1. Current Climate Change Trends in Indonesia
4.1.1 Rainfall Change
Based on the climate change detection criteria discussed above, the analysis for current climate change trend has been viewed in terms of the changes for 30-year mean value. For example, Figure 4.1 shows a moving average graphic of 30-year mean rainfall value for every 5 years from Jakarta station data. It shows a quite signii cant increase of rainfall in January for the decade of the 1970s period compared to the decade of 1900s period, with a difference in 30-year mean value that is close to 100 mm. Generally, it is also shown that the rainfall in months around January to April is more sensitive to changes than other months. Moreover, it can also be seen that rainfall in January tends to decline when it is close to year 2000s, while on the other hand rainfall in February tends to increase.
Figure 4.1 Changes in 30-year mean rainfall value for every month several period (left) and its moving
average graph for months in wet season D(ecember)-J(anuary)-F(ebruary) (right).
The above analysis shows that climate changes has occurred in Jakarta in certain level, as seen from the changes in mean rainfall value from one 30-year period to the next. To i nd out the rainfall change trend in all areas of Indonesia, a similar analysis is done for GPCC data in 0.5º grid size. As explained earlier, we also try to project mean rainfall values based on polynomial trend analysis. Other examples of analytic results are shown in Figure 4.2 and 4.3, while the detailed results are attached in Appendix A and B. In Figure 4.2 can it be seen that, compared to the baseline period, there is a non-uniform change of mean rainfall value for January. In Sumatera Island, most of the areas undergo an increase of mean rainfall values ranging in 10-50 mm, while there are areas in which the average rainfall is increasing but in other areas the average rainfall is declining. It is noteworthy that for example, in Java, Bali, and Nusa Tenggara,
J A S O N D J F M A M J
JAKARTA OBSERV. (30-year Annual Pattern) Lat = -6.17 , Lon = 106.82
1896 1906 1916 1926 1936 1946 1956 1966 1976 1986
Figure 4.2 An example of January rainfall trend analysis result from GPCC data: baseline 1961-1990 mean value (left) and the difference of current period 1980-2010 with baseline
(data available up to 2007)
The previously discussed results of trend analysis give an illustration of the current climate condition compared with baseline period of 1961-1990. Furthermore, results of the polynomial extrapolation in Figure 4.3 shows the trends for rainfall that may occur until year 2020 (see also Appendix B). Beside mean value projection, using the same method, we also tried to produce projections of standard deviation that can be used as an indicator of climate variability. The increasing value of the standard deviation value can be interpreted as an increase in climate uncertainties as a result of the strength of climate variability in a particular area. Both changes in mean value and standard deviation value contribute some to the potential hazard of climate changes.
For the examples in January, it can be seen that almost all area in Sumatera, on average, still have the potential to undergo rainfall increase until year 2020, with increasing uncertainties in the pattern of rainfall, particularly for West Sumatera. The potential threat of changes in mean rainfall value and its variability are projected to happen in 2015-2020 period. Decline of January rainfall tends to occur in parts of Nusa Tenggara area. In Java Island, while some area undergo decline in rainfall, variability is in general increasing although not to a great extent. In this case, the changes in mean rainfall value or its variance is considered signii cant if it increases in the range of 25-50 mm or greater.
SCIentIfIC BaSIS: analySIS and PRojeCtIon of temPeRatuRe and RaInfall ICCSR - SCIentIfIC BaSIS: analySIS and PRojeCtIon of temPeRatuRe and RaInfall
Figure 4.3 An example of January rainfall projection result expressed in the difference of 30-year mean value (top) and standard deviation (bottom) for 1985-2015 period (left) and 1990-2020 period
(right) against baseline.
4.1.2 Surface Temperature Change
Figure 4.4 Example of result from the analysis of temperature changes in Jakarta: (a) monthly temperature time series data, (b) composite graph of 30-year temperature for each month (from July to
June), (c) Graph of 30-year moving average for December, January, February, and (d) similar to (c) for June, July, August.
4.1.3 Probability Change for Extreme Weather and Climate
The analysis for extreme weather events actually needs more complete data. The analysis of extreme rainfall events, for example, needs at least daily rainfall data, or even hourly data. Nonetheless, more information can be retrieved from monthly rainfall data from the observation in the stations. In Figure 4.5 an empirical Cumulative Distribution Function (CDF) graph is shown from different 30-year periods just as seen in Figure 4.1. From the i gure it can be seen that for December-January-February months (DJF), the chance of monthly rainfall value of 500 mm increased by 10% (from 10% to 20%)in 1961-1990 period compared to 1901-1930 period and 1931-1960 period. On the other hand, the change in probability distribution for rainfall in the months of March-April-May (MAM) is not quite clear. It needs to be noted that rainfall probability distribution for year 1991-1997 is difi cult to interpret as there are not
1860 1875 1890 1905 1920 1935 1950 1965 1980 1995 2010
24.5
Time Series of Monthly Mean Temperature JAKARTA OBSERV. Lat = -6.18 , Lon = 106.83
(Jan1866 - Feb2009)
1904 1914 1924 1934 1944 1954 1964 1974 1984 1994
26
1904 1914 1924 1934 1944 1954 1964 1974 1984 1994
26
SCIentIfIC BaSIS: analySIS and PRojeCtIon of temPeRatuRe and RaInfall ICCSR - SCIentIfIC BaSIS: analySIS and PRojeCtIon of temPeRatuRe and RaInfall
enough data to form a normal graph. The correlation of high and extreme rainfall probability is not quite clear. However, the average rainfall in Jakarta is around 200-300 mm/month during DJF, and rainfall value of 500 mm/month is almost twice the average. If we assume the number of rainy days is constant, then it can be estimated that there is an increase of daily rainfall intensity as well.
Figure 4.5 Empirical Cumulative Distribution Function (CDF) graph, from Jakarta monthly rainfall
data for some 30-year periods.
In projection of extreme weather events probability, GCM output data with resolution of 20 km from MRI can provide additional information. Nonetheless, it needs to be noted that the data require a calibration process. We selectively tried to analyse the distribution of rain probability from the MRI-GCM model output for the following years: 2015, 2020, 2025, and 2030. Figure 4.6 shows a graph of the cumulative probability for rainfall value for Java-Bali area (land area only). This i gure shows that the rainfall value of 20 mm/day is already located within 5% of the upper limit.
SCIentIfIC BaSIS: analySIS and PRojeCtIon of temPeRatuRe and RaInfall ICCSR - SCIentIfIC BaSIS: analySIS and PRojeCtIon of temPeRatuRe and RaInfall
27
Figure 4.6 Similar to i gure 4.5 but for daily rainfall from MRI-GCM model output data for Java-Bali
area. The dashed red line show the value of 1 mm (vertical) and the 0.95 probability function value (horizontal)
To see the change in probability of extreme rainfall, a distribution map of probability of rainfall greater than 20 mm is shown in Figure 4.7. According to MRI-GCM simulation result, it can be seen that areas with probability of extreme rain in Java Island are more scattered in 2015 than in 2020. However, the chances of extreme rainfall events around Jakarta area will be greater in 2020 than in 2015. This projection is consistent with the analysis result using GPCC data (Appendix B2) where the trend change from 1981-2010 period to1990-2020 period shows a higher variability compared to the trend change from 1981-2010 to 1985 -2015 for Jakarta area.
Figure 4.7 Distribution of high daily rainfall probability (>20 mm/day based on GCM model output) in Java-Bali area for year 2015 (left) and 2020 (right).
4.2 Climate Change in 2030s Period and 2080 Period
A climate projection for distant future can only be obtained from GCM output analysis. Because GCM output is a 4-dimensional data (latitude, longitude, time, scenario), it is very difi cult to present all data. To present the information in a simpler way, we only review the change in temperature and rainfall for 2020-2050 (2030s) period and for 2070-2100 (2080s) period against baseline period (1961-1990). Then every region is divided into several areas and GCM output data is averaged for each area. For example, as seen in Figure 4.8, Java-Bali region is divided into 4 areas: (1) Western Part, (2) Central Part, (3) Eastern Part, and (4) Bali.
4.2.1 Projection of Surface Temperature Change
Figure 4.8 The division of Java-Bali region into four areas for the analysis of climate projection.
Different scenarios give signii cantly different temperature in the projection for 2080s period, while the average temperature increase in 2030s period does not show a substantial change. As expected, the A2 scenario with the highest CO2 concentration in 2100 gives the highest increase, around 3º C. On the other hand, the B1 scenario only gives an increase of 2º C, and A1B scenario gives a value in-between these two extremes. This result shows that in the modelling, the increase of averaged surface temperature indeed follows a relatively simple mechanism where the addition of heat is determined by the balance of infrared radiation, which is dictated by CO2 concentration The graph for temperature increase for other areas can be seen in Appendix D1-D7.
SCIentIfIC BaSIS: analySIS and PRojeCtIon of temPeRatuRe and RaInfall ICCSR - SCIentIfIC BaSIS: analySIS and PRojeCtIon of temPeRatuRe and RaInfall
4.2.2 Projection of Rainfall Change
The projection of changes of rainfall pattern over Java-Bali region in general is more varied than the pattern of temperature increase, which has linear tendency. In principle, the potential danger we need to be wary of is the tendency of increasing rainfall in wet months and the decline of rainfall in transitional months compared to the baseline condition (1961-1990). According to GCM output analysis, this condition will be exacerbated near 2080s period. In regard to the decline of rainfall in dry months, Western Java area is the area with higher potential hazard compared to the other areas. It should also be noted that there are a large variation for January rainfall projection for all three SRES scenarios.
Although it is not as simple as temperature pattern, the inluence of the scenario used also seems to be proportional to the CO2 concentration, where scenario A2 with the highest concentration also produces the largest magnitude of rainfall change. This GCM output analysis also gives an illustration of changes in the monthly pattern so it will be known that, for example, Eastern Java and Bali will undergo rainfall increase in February compared to the Western Java area in the 2030s period.
4.2.3 Projection of Probability Change for Extreme Weather and Climate
The analysis for projection of change in extreme weather and climate probability is yet to be done so in this stage the result is not presentable. Because of the limited data availability, there is not much that we can do to identify potential hazards due to extreme weather. Even so, the hazard of extreme climate such as the occurrence of consecutive dry years become one of many things that we should be wary of. This issue will be best discussed and reviewed in future revision of this study.
nfall ICCSR - SCIentIfIC BaSIS: analySIS and PRojeCtIon of temPeRatuRe and RaInfall
SCIentIfIC BaSIS: analySIS and PRojeCtIon of temPeRatuRe and RaInfall ICCSR - SCIentIfIC BaSIS: analySIS and PRojeCtIon of temPeRatuRe and RaInfall
33
GENERAL
RECOMMENDATION
FOR SECTORAL
5.1 Description of Climate Change for Each Region
As the basis for the making of Roadmap, we tried to formulate the scientiic basis study result in a simple form that is highly informative. However, this is not easily done both because the climate problem in Indonesia is very complex and also because of numerous limitations in the availability of climate projection data. Below we present concisely the general description of climate change projections and its probable hazard for each region based on polynomial trend analysis (for rainfall until year 2020) and GCM output analysis (for 2030s and 2080s period), while the detailed version of these results can be seen in Appendix B, D and E.
5.1.1 Climate Change in Java-Bali Area
Climate changes in Java-Bali area has been discussed in the examples of climate projection analysis above. Based on polynomial trend analysis, in short, we note that relative to the current condition (averaged over 1981-2007), rainfall change between 2010 until 2015 is not a signiicant departure form recent climatological mean. However, the average rainfall for year 2010 until 2020 shows a decline in rainfall for January and an increase of rainfall for December and February in most of the areas in West Java and East Java. Only in some areas on northern coast of Central Java there are increases of rainfall for both January and February. As previously mentioned, rainfall changes are considered as signiicant when it is in the range or exceed the range of 25-50 mm.
Projections using GCM models show that the increase of average surface temperature in 2020-2050 period is about 1º C for all scenarios relative to baseline. In the 2070-2100 period, the temperature increase is around 2º C for scenario B1, 2.5º C for A1B and 3º C for A2. The pattern of rainfall change shows a general tendency that rainfall in dry months (June-July-August) tends to decline while the increase of rainfall happens during wet months (December-January-February), especially on 2080s period for A1B and A2 scenario. It is also to be noticed that the January rainfall in A2 and A1B scenario show a pattern of larger spatial variation, with a tendency of increasing rainfall in February.
5.1.2 Climate Change in Sumatera Area
0-2º C. During 2070-2100 period, the temperature increase is around 2º C for B1 scenario, 2.5º C for A1B, and 3º C for A2, but the largest increase can reach 4º C. Rainfall change pattern shows difference for Southern Sumatera compared to other parts of Sumatera. The general tendency for Central to Northern Sumatera area can be regarded as the contrast to the pattern occurring in Java-Bali and Southern Sumatera, particularly the pattern of increasing rainfall for January.
5.1.3 Climate Change in Kalimantan Area
The estimated increase of rainfall in Eastern Kalimantan is based on trend analysis and occurs particularly around January when the variability also increases during 2010-2020.
General changes in temperature in Kalimantan area follow the global trend, which is 1º C for the 2030s period and 1.5º C - 3º C for the 2080s period, with a greater variation compared to Java but less than the variation in Sumatera. The estimated change of rainfall from GCM output analysis does not show a clear pattern but rainfall increase is more dominant for 2080s period for A1B and A2 scenarios. However, rainfall is projected to decline during the months of January-February-March in North Western Kalimantan area.
5.1.4 Climate Change in Sulawesi Area
Potential hazard of changes in rainfall for Sulawesi area during 2010-2020 lies in the increase of rainfall in December and January, particularly for Northern Sulawesi area.
Temperature change in general follows global trend which is around 0.8º C in the 2030s period and 1.5º C - 3º C for 2080s period, with a quite small variation. Changes in rainfall show a highly varied pattern with a striking difference between Southern and Northern Sulawesi Areas, particularly for A1B scenario in the 2080s period.
5.1.5 Climate Change in Nusatenggara Area
Projection using GPCC data shows a striking increase in potential danger of climate variability in Western Nusatenggara for November months during 2010-2020 period. Meanwhile, January rainfall tends to decline signiicantly.
Based on GCCM output analysis, change of temperature in general follows a global trend which is increasing by around 0.8º C during 2030s period and 1.5º C - 3º C during 2080s period with a quite large variation between wet months and dry months. Change of rainfall shows a highly varied pattern with more dominant tendency to decline slightly in the 2080s period for months between March to September. The increase of rainfall in October appears signiicantly in almost all scenarios and periods.
nfall ICCSR - SCIentIfIC BaSIS: analySIS and PRojeCtIon of temPeRatuRe and RaInfall
5.1.6 Climate Change in Moluccas Area
Change in rainfall in Moluccas area has a potential to undergo increase and decline during 2010-2020 period in different months. The potential of increased mean rainfall value and its variability mainly lies in June around Seram Island, which contrasts with the tendency of rainfall increase for Halmahera Island that is projected to occur in January.
Temperature change in general follows global trend of GCM output but is slightly smaller than 1º C-3º C between 2030 period until 2080s. Changes in rainfall are highly varied with a tendency of declining rainfall in 2030s but then increase happens in 2080s particularly in Northern area. Rainfall projection is quite varied among scenarios, showing high model uncertainties for Moluccas area.
5.1.7 Climate Change in Papua Area
Change in rainfall in Papua area has the potential for declining tendency during 2010-2020 period, except for June and July months when increase occurs. Meanwhile, the potential of increasing climate variability lies particularly in July.
In general, changes in temperature follow the global trend which is 1 º C-3 º C between 2030s period until 2080s period, with a variation that is quite small except for Southern Papua. Furthermore, GCM output data analysis shows that the changes in rainfall tend to increase signiicantly, except for Southern Papua, particularly for 2080s period and show a consistent pattern for all scenarios.
5.2 Additional Notes
5.2.1 Long Term Climate Variability
decadal) such as PDO (Pacii c Decadal Oscillation), which is related to the sea surface temperature variation in Northern Pacii c and Central Pacii c (Mantua, 1997), and AMO (Atlantic Multidecadal Oscillation) which is related to the thermohaline (deep sea) circulation changes in the Atlantic Ocean (Soon, 2009). The existence of long-term climate variability has caused the attribution of global warming to climate change be debated more i ercely among world’s climate scientists. The IPCC report (2007, Chapter 6) discussed the debate on long-term climate variability, but concluded that the current and historical climate change cannot be separated from anthropogenic inl uence.
The effect of long-term variability also needs to be considered in the analysis of projections of future climate impacts so that not all climate pattern shifts will easily be attributed to global warming. In Figure 5.1 it is shown PDO index time series and rainfall data taken from rainfall observation data from Ampenan Station (Lombok Island) after smoothing out for 20-year variation. The PDO index data can be obtained from the site http://jisao.washington.edu/pdo/PDO.latest . In this analysis the rainfall data is converted to rainfall index and by calculating the anomaly and dividing it by a scale factor. From Figure 5.1 we see that there is a correspondence in temporal variation pattern between PDO index variations with the rainfall in Lombok Island. This shows a strong possibility of the connection between current climate changes and long term variability that affects inter-decadal (30 years) rainfall statistics. The linear correlation tendency is also visible when the rainfall index is shifted 14 years backward (Hadi et al., 2009)
Figure 5.1 Time-series graph of Pacii c Decadal Oscillation (PDO, red) and rainfall index (blue) from
Ampenan Station (Lombok Island) after smoothing with 20-year period.
The latest study by Soon (2009) shows that the long term atmosphere variability is affected by the dynamical processes in the Atlantic Ocean through a mechanism known as meridional overturning circulation (MOC), which is generated by solar radiation variability. Figure 5.2 shows a time series graph of sea surface temperature in Atlantic and total solar irradiance that show a quite clear similarity of long-term variation pattern. In this note we i rst want to emphasize the importance of strengthening
1900 1910 1920 1930 1940 1950 1960 1970 1980 1990 2000 2010 -1
SCIentIfIC BaSIS: analySIS and PRojeCtIon of temPeRatuRe and RaInfall ICCSR - SCIentIfIC BaSIS: analySIS and PRojeCtIon of temPeRatuRe and RaInfall
the academic basis of study on climate dynamics in Indonesia so that the climate change behaviour can be understood more comprehensively. Secondly, the potential hazard of climate change from long-term climate variability is not of lesser importance to be considered compared to climate change due to global warming.
Figure 5.2 Time-series graphic of annual sea surface temperature anomaly in Atlantic (dashed line) and
total solar irradiance (red line). (Source: Soon, 2009)
5.2.2 Climate Projection Uncertainties
hundreds of possibilities from which the statistics can be studied. In the present work, we only presented the best estimate in the form of selective ensemble mean value with uncertainty information taken only from three SRES scenarios.
nfall ICCSR - SCIentIfIC BaSIS: analySIS and PRojeCtIon of temPeRatuRe and RaInfall
SCIentIfIC BaSIS: analySIS and PRojeCtIon of temPeRatuRe and RaInfall ICCSR - SCIentIfIC BaSIS: analySIS and PRojeCtIon of temPeRatuRe and RaInfall
In supporting the decision-making process of the Roadmap, we have tried to conduct our study on future climate change in Indonesia as comprehensively as possible. Even so, considering the numerous limitations on data and methodology that we confront, the results presented here must be considered as provisional and far from meeting the national needs for more accurate climate change information. For this reason, in the future a more coordinated effort to strengthen the climate change scientiic basis is needed by empowering relevant institutions in a more optimal way. Therefore, the Roadmap is not only needed to guide sectoral adaptation action but must also be used as a foundation for strengthening the scientiic basis.
Currently there are numerous studies on the impacts and the risks of climate change conducted without adequate scientiic basis study. For climate change issue not to become a mere political commodity, in the future we see the need to compose a book that is equivalent with Climate Change 2007 The Physical