Adaptive Capacities for Food Security: Implications
for Land Use Policy in the Santa Cruz Watershed,
Laguna, Philippines
AGNES C. ROLA*, DULCE D. ELAZEGUI,
GIRLIE NORA A. ABRIGO, CRISTINO L. TIBURAN JR., JOSE NESTOR M. GARCIA, ZENAIDA M. SUMALDE,
and MANOLO G. VILLANO
Abstract
Using watershed as a context, this paper seeks policy solutions to the agricultural-related externalities observed across communities as a result of climate hazards and aggravated by improper land use practices. The authors used both primary and secondary data to analyze the trends in land cover and land use, water supply variability and its impact on crop production, and the corresponding community adaptation strategies in the study watershed. Results show that forest land conversion gave way to intensive upland agriculture. This land use, however, was observed to create frequent flooding in the low lying areas destroying rice crops. Authors recommend a watershed development plan that contains assignment of forest reserves, purely agricultural areas, built-up areas, and other land uses that will not be harmful especially to the lowland areas that suffer from flooding and siltation.
Keywords: vulnerability, adaptive capacity, food security, climate change, watershed, Philippines
* Corresponding author. Email: [email protected]
Introduction
Climate change constrains agricultural productivity in two ways: directly via exposure to heat and floods; and indirectly via the effects of climate change on the natural resources, soil and water, used in agricultural production. Rincon and Virtucio (2008) observed that in agricultural sector and forest and watersheds, increase in temperature results in the changing of growing seasons, heat stress in plants, incidence of pests and diseases and changes in the hydrologic cycle.
With long-term changes in temperature and precipitation and increased frequency of extreme events, there is growing concern over its impact on future global food production and food security (Kurukulasuriya and Rosenthal 2003).
Indirect effects of climate change to agriculture are derived from the damages brought about by landslides and flooding resulting to production damages.
An important approach that minimizes the climate change impacts on agriculture is to require best management practices in soil and water conservation (Tongson 2011). However, it is important to understand the physical interactions across farm communities in a particular watershed and the actors who pay for the damages. In times of water scarcity, there are water allocation issues from upstream to downstream, where farmers downstream may not have water supply for their farming activities. On the other hand, floods will damage downstream communities’ crops more than the upstream. Floods downstream are also a factor of land use patterns upstream. Understanding adaptive capacities of watershed communities to these climate hazards is key in attaining food security.
Policy Problem
In meeting food security, both intensive agricultural production and agricultural land expansion are observed but these lead to unsustainable agricultural practices. Intensive agricultural production of sloping lands results in soil erosion, which contributes to the siltation of irrigation systems. Siltation caused by land use upstream is observed to affect rice yields downstream (Lantican et al. 2003). On the other hand, agricultural land expansion cuts through the forest and other marginal areas sometimes not fit for agriculture.
This upstream-downstream interaction is a watershed based phenomenon.
Watershed is the area of land where all of the water that is under it or drains off of it goes into the same place. Watershed is composed of communities usually divided into administrative regions. In the Philippines, towns have their own comprehensive land use plans that are not linked to the rest of the towns within the same watershed.
This paper then problematizes the specific policy of the increasing vulnerability of water resource used for food production especially during extreme events such as floods. Forest land conversion has given way to intensive upland agriculture.
This land use, however, was observed to create frequent flooding in the low lying areas destroying rice crops. Such a situation, if not addressed properly, can result in unsustainable food production leading to food insecurity.
Objectives
Using the watershed as the unit of analysis, this paper will:
a. analyze the trends in land cover and land use and their potential impact on food security;
b. analyze the water supply variability and its impact on crop production;
c. describe the community adaptation strategies; and
d. recommend policy actions to develop a comprehensive land use plan in a watershed scale.
Study Framework
The Philippines is largely exposed to climate hazards due to its geographical location. Communities are exposed to climate hazards such as flooding, drought, and landslide. Exposure is referred to by Field et al. (2012) as “the presence (location) of people, livelihoods, environmental services and resources, infrastructure, or economic, social, or cultural assets in places that could be adversely affected by physical events and which, thereby, are subject to potential future harm, loss, or damage.” The next factor to exposure that is considered is the sensitivity of the area to a particular climate hazard. Sensitivity is defined by Watson and Core Writing Team (2001) as “the degree to which a system is affected, either adversely or beneficially, by climate-related stimuli [in which] the effect may be direct (e.g., a change in crop yield in response to a change in the mean, range or variability of temperature) or indirect (e.g., damage caused by an increase in the frequency of coastal flooding due to sea level rise).” Sensitivity, unlike exposure, differs depending on the conditions other than geographical location that are present in the area, and this will be manifested on the impacts brought to the different stakeholders in the area.
In this study, the impacts of the climate hazards across watershed elevation (low, medium, high) were investigated from the community perspective, with
particular focus on soil and water resources. Given these impacts, the nature of adaptation strategies employed by the communities was identified.
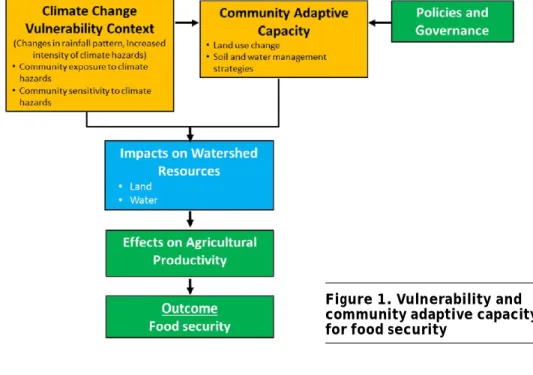
An important concept to the success of the adaptation strategies is the level of adaptive capacity of the community (figure 1). Adaptive capacity is determined by a number of factors, including favorable policies and governance. All of these directly affected food security.
Figure 1. Vulnerability and community adaptive capacity for food security
Review of Related Literature
Adaptation is a response mechanism that deals more on “adjusting the natural and human systems in response to actual or expected climatic stimuli.” It involves a wide range of stakeholders and is carried out at and across different levels—
starting from the individual/household, community, and the national and the international community. Adaptation is “a dynamic social process and the ability of societies to adapt is determined, in part, by the ability to act collectively” (Adger 2003). Another study by Adger et al. (2004) pointed out that the way society at large collectively acts to confront hazards and reduce risks is one of the determinants of vulnerability. These suggest that to combat the negative impacts brought about by climate change, on one side, it is necessary to encourage households for collective action. The arena for this collective action can be best reflected at the community level, wherein there are more sectors involved aside
from the households. The key stakeholders include members of the local government/council, peoples’ organizations, civil society groups, and nongovernment organizations. Here, it must be mentioned that it is not only climate-related issues that undermine community and households’ adaptive capacity and local development. Other factors, including institutional organization, and access to information and governance in the area, reduce the ability of farmers to secure sustainable livelihoods (Reid 2006).
Adaptation practices in the Pacific illustrate the importance of an “open, transparent and highly-participatory process” (PCESD-USP 2011) in climate change adaptation efforts. The process suggests that the community must participate in deliberating options and solutions to climate change. Furthermore, there is a need to enhance people’s skills and capacity to deal with climate change impacts. The significance of adaptation activities enacted at the community level provides a strong foundation of collaboration in the national and international policy levels (Huq and Ayers 2009). Pandey and Okazaki (2011) also adds that community participation is critical in making sustainable disaster management practices which entails “partnership, participation, empowerment and ownership by local people.” The significance of adaptation activities enacted at the community level provides a strong foundation of collaboration in the national and international policy levels (Huq and Ayers 2009). Strong community engagement on their design, implementation, and monitoring ensures the effectiveness of adaptation activities (Ebi 2009). Dazé, Ambrose, and Ehrhart (2009) reiterated the need to conduct institutional mapping, a tool used to examine institutions that are most important to people, employing questions on the nature of organizations, their interactions with the population and with other local organizations, their strengths and weaknesses, and the gaps in their capacity and level of influence over adaptation planning and implementation.
Adaptation strategies to food security and climate variability issues in Maradi district (Niger) focused on the adaptation/coping strategies driven by social networks formed within the community (Mamouda 2011). The adaptation strategies include: cooperation of the extended family, village, or focus group level to strive for better harvest, search and purchase of food from intercommunity/
other districts’ or countries’ cereal banks, temporary/permanent migration for work opportunities, food banks (pertaining to community-based organizations managing food stock) and water resource management for MaradiGoulbi River, shared by Niger and Nigeria. It was found that food security issues are addressed with the help of community organizations and institutions in their area. Each played a role in the process, from capacity building to planning to fund generation to implementation.
In Mali and Ethiopia in Africa, interventions from outside institutions include livelihood diversification programs, school feeding, micro-finance, motor pumps for (irrigation), dikes, dune fixation, construction and technical improvement of wells and reforestation, and afforestation (Naess et al. 2010).
In the Philippines, the implementation of Albay in Action on Climate Change (A2C2), in the Bicol Region, is one of the local initiatives developed for climate change adaptation (Lasco et al. 2008). Climate change adaptation programs and projects implemented in the province included information, education, and communication (IECs) campaigns, LINIS KALOG or clean-up of rivers and creeks, Albay Integrated Agricultural Rehabilitation Program (AIARP) which formed farm clusters to assist farmers and fisher folks in their needs, and barangay level composting and reforestation activities such as mangrove plantation. One lesson A2C2 learned is that the frequency and severity of climate hazards in an area determined the knowledge and responsiveness of stakeholders to adaptation efforts.
Furthermore, Predo (2010) documented the actual experiences and planned adaptation to flooding brought by extreme climatic events of the communities and selected municipalities in Ormoc, Leyte, and along Cabalian Bay in Southern Leyte. It was found that the respondents implemented adaptation strategies which are accessible alone at the household level (evacuation measures, reconstruction of houses) rather than those that required community cooperation (usually engineering work, like construction of dikes/canals). This is mainly due to the
“lack of confidence to rely on cooperative solutions or to depend on the local government units for defensive strategies and actions.” Perras et al. (2008) discussed the various adaptation practices employed by farmers in Pantabangan- Carranglan watershed area to reduce the impacts of climate variability. The study suggested that further research should elaborate on the limitations and challenges to adaptation in the household and societal levels to be effective. It also highlighted the importance of bottom-up assessment and planning and participatory processes in research.
Many traditional adaptation practices in the Philippines cushion poor households against seasonal stress by redistribution of wealth. The most popular are gifts of grains and other foods, loan of grains, and lending of animals or farm equipment for plowing the land. Gift-giving is an investment both as a means of gaining prestige and as security to guarantee subsistence in hard times (Balatibat 2004). It is also a means of spreading out risks. Such practice could entail obligations to wealthier households, thereby reinforcing the dependency relationships in the community.
Adaptation strategies in the Philippines are still on the verge of recognizing the role of community (e.g., collective action) as an important driver of adaptation. The number of household-employed strategies in literature because of prevalent issues (usually political) suggests that there is a need to look into the dynamic processes and interactions involved in a community. What are also lacking in the literature are adaptation strategies of communities with horizontal linkages such as those communities belonging to a watershed. This is an important consideration because of the externalities that are embedded in this physical relation.
Methodology The Study Site
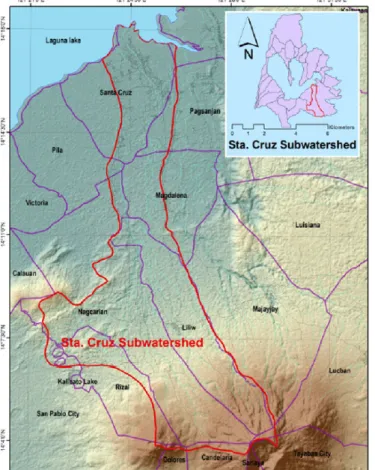
This interdisciplinary study was conducted in the Santa Cruz sub-watershed (SCW) of Laguna, Philippines (figure 2). The choice of site was based on the accessibility of the location, plus the presence of secondary information for the biophysical characterization and the other climate related variables.
Figure 2. Map of Santa Cruz Subwatershed, Laguna, Philippines Source: Philippine GIS Clearinghouse (PhilGIS)
The Santa Cruz watershed area consists of the following municipalities: Liliw, Magdalena, Santa Cruz, Majayjay, Rizal, and Nagcarlan. Three municipalities were selected to represent low, medium and high elevation levels. In each municipality, two barangays classified as more vulnerable and less vulnerable, (according to the MGB classification) were further chosen as study sites for a total of six barangays.
Land Use and Land Cover Change
Land use and land cover change (LULCC) has been regarded as one of the most important alterations of the earth’s land surface (Lambin et al. 2001). This is mainly driven by the interaction in space and time between biophysical and social dimensions (Veldkamp and Verburg 2004). Land use is described by how humans use the biophysical or ecological properties of the landscape while land cover refers to the physical and biological cover of the land surface, including vegetation, bare soil, water, and/or artificial structures (Ellis 2013). Yadav et al. (2012), on the other hand, stated that land cover is a basic parameter that evaluates the content of earth surface as an important factor that affects the condition and functioning of the ecosystem while land use mostly relates to utilization of land resources by human beings. To better understand the dynamics of LULCC, both historical and present data were accounted properly to identify patterns that would provide comprehension of how these changes happened. One method of addressing such phenomenon is through the use of remotely sensed images.
For this paper, satellite imagery at three different periods was utilized to determine several land use and land cover types in the area (Tiburan et al. 2016).
Change detection analysis was then employed across these periods to further assess what has evolved over the years. According to Anderson (1977), as cited by Yadav et al. (2012), change detection is the process of identifying difference in the state of an object or phenomenon by observing it at different times. These landscape changes are mainly caused by anthropogenic activities such as rapid growth of population and demands of food resources (Gibson and Power 2000).
In particular, the change detection analysis focused on land use and land cover types that are related to food security such as agriculture and perennial crops.
Water Resources and Water Use
The following data characterized water resources, water use, and water adaptation strategies in the watershed (Villano et al. 2016): (a) water resources status of the Santa Cruz Watershed; (b) water supply management strategies; (c)
water adaptation strategies and technologies; and (d) existing policies and institutional linkages in the watershed.
Data were obtained from both secondary and primary sources. Secondary information were obtained from published and unpublished literatures, profiles and comprehensive land use plans (CLUP) of municipalities within the Santa Cruz Watershed, and documents provided by the National Irrigation Administration (NIA) of Region IV-A in Pila, Laguna. Primary data were collected through focus group discussions (FGDs) and key informant interviews (KIIs) in the sample barangays within the watershed. Ocular inspections of some relevant sites were also undertaken.
Community Level Information
Table 1 describes the study sites relative to the vulnerability to climate change hazards. Lowland communities are vulnerable to flooding, while upland communities are vulnerable to landslides. For community level analysis, secondary data collected in the municipalities include: socioeconomic profiles, comprehensive land use plans (CLUPs), disaster risk reduction management (DRRM) plans, municipal ordinances, and programs on agriculture and environment. Secondary data collected in the barangays are as follows: barangay integrated development plans (BIDPs), DRRM plans, profiles and barangay
Table 1. Study areas by elevation and type of hazards
ELEVATION MUNICIPALITY
Santa Cruz Liliw Nagcarlan Low San Pablo Sur Patimbao
(10-20 masl) Flooding Flooding
(more (less
vulnerable) vulnerable)
Medium Calumpang Bungkol
(20-470 masl) Flooding Flooding
(more (less
vulnerable) vulnerable)
High Bukal San
(above 480 masl) Landslide Francisco
(more Landslide vulnerable) (less
vulnerable)
ordinances. Focus group discussions (FGDs) were conducted in the six barangays to gather information on perceptions and knowledge on climate change, recollection of the worst extreme event/s experienced in their area, impact of these extreme event/s to the agriculture sector, adaptation strategies/measures/
responses (practiced and planned) to the impacts identified and available resources within their community to execute adaptation to extreme events. The participants include barangay captains, barangay councilors, and representatives of farmers associations.
Findings and Analysis
Land Cover and Land Use and Potential Impact on Food Security
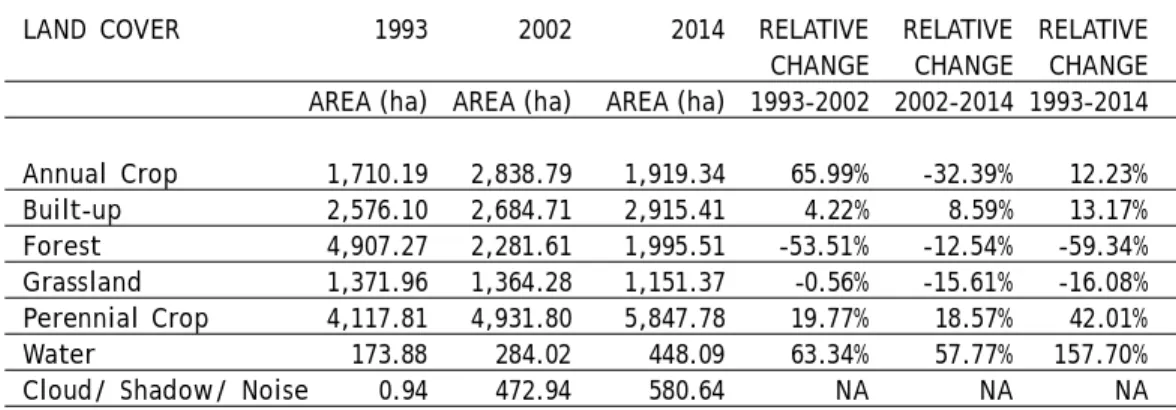
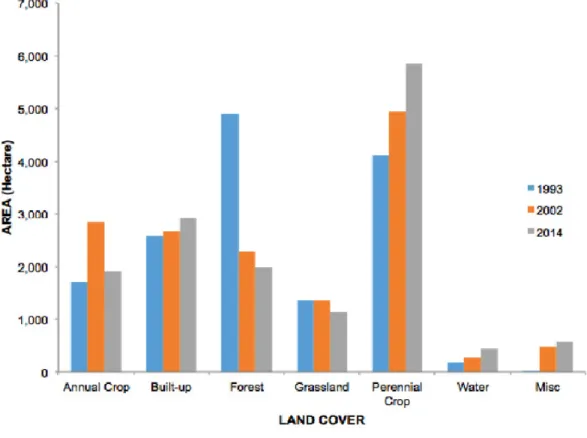
Data on the relative changes of land cover in SCW are shown in table 2 and figure 3. From 1993 to 2014, forest and grassland areas decreased approximately 2,912 ha (59 percent) and 221 ha (16 percent), respectively, while annual crop increased 209 ha, built-up area increased 339 ha, perennial crop increased 1,730 ha and water increased 274 ha. Based on table 2, it can also be noted that forest has its greatest loss from 1993 to 2002 accounting to about 2,626 ha (54 percent) as compared to its loss from 2002 to 2014 which is only around 286 ha (13 percent). Grassland, on the other hand, experienced higher decrease from 2002 to 2014 (213 ha or 16 percent) than from 1993 to 2002 (8 ha or 1 percent). The difference in perennial crops and built-up areas between 1993-2002 and 2002- 2014 is relatively close in each period. Perennial crops had a relative increase of 814 ha (20 percent) from 1993 to 2002 and 916 (19 percent) from 2002 to 2014. As for the built-up areas, an increase of 109 ha (4 percent) was experienced from 1993
Table 2. Relative changes of land cover classes of santa cruz watershed from 1993 to 2014
LAND COVER 1993 2002 2014 RELATIVE RELATIVE RELATIVE
CHANGE CHANGE CHANGE AREA (ha) AREA (ha) AREA (ha) 1993-2002 2002-2014 1993-2014 Annual Crop 1,710.19 2,838.79 1,919.34 65.99% -32.39% 12.23%
Built-up 2,576.10 2,684.71 2,915.41 4.22% 8.59% 13.17%
Forest 4,907.27 2,281.61 1,995.51 -53.51% -12.54% -59.34%
Grassland 1,371.96 1,364.28 1,151.37 -0.56% -15.61% -16.08%
Perennial Crop 4,117.81 4,931.80 5,847.78 19.77% 18.57% 42.01%
Water 173.88 284.02 448.09 63.34% 57.77% 157.70%
Cloud/ Shadow/ Noise 0.94 472.94 580.64 NA NA NA
to 2002 while an increase of 231 ha (9 percent) from 2002 to 2014 was observed.
Meanwhile, the annual crops showed a relative increase of approximately 1,129 ha (66 percent) from 1993 to 2002 while a relative decline of about 919 ha (32 percent) from 2002 to 2014.
In 1993, Nagcarlan and Liliw showed high coverage of forest areas with 2,209 ha and 1,841 ha, respectively. However, significant decrease in forest areas in Nagcarlan (1,195 ha) and Liliw (527 ha) was observed already in 2002. Most of these areas were converted into perennial crops that imply increased activities on agriculture in the watershed. From 2002 to 2014, Nagcarlan further demonstrated a decrease in forest cover (480 ha) while an increase in built-up area (367 ha) was evident in the same period. Liliw, on the other hand, experienced a decline in its annual crops and an increase in built-up areas and perennial crops from 2002 to 2014. Meanwhile, Santa Cruz showed some reduction of about 445 ha already in its annual crops from 1993 to 2014 which were converted into perennial crops.
Figure 3. Trends of land cover classes in Santa Cruz Watershed from 1993 to 2014
Potential Impacts to Food Security and Climate Change
The increase in built-up areas from 1993 to 2014 in SCW may have been attributed to the increasing population in the different municipalities within the watershed. This continued growth in population also signifies more demand for food, and this can be addressed by further expanding agricultural areas or increasing agricultural productivity and quality. In SCW, it is already evident in the change detection analysis that annual and perennial crops have significantly increased from 1993 to 2014. Most of the conversions into these land cover classes were from forest and grassland areas. This increase in area for agricultural production may be viewed as a solution to food security issues on the one hand, but one may perceive it as a problem that can exacerbate the adverse impacts of climate change on the other hand.
According to the Philippine Atmospheric, Geophysical and Astronomical Services Administration (PAGASA), the projected annual rainfall change in 2020s (2006-2035) using the PRECIS (Providing Regional Climates for Impact Studies) model is about -7.8 mm. Highest decrease of rainfall is expected to be observed in the months of March, April, and May (34.0 mm) and in the months of December, January, and February (21.9 mm). However, the model also projected that there will be an increase of 3.3 mm and 2.4 mm in the months of June, July and August and in the months of September, October and November, respectively. In terms of mean temperature, PAGASA has projected an annual increase of approximately 1.00 C in 2020s (2006-2035). This implies that further degradation or conversion of the remaining forest areas into other land cover classes would significantly aggravate the future state of the watershed. Given the current trend of land cover changes from 1993 to 2014 and with the projected annual and seasonal changes in rainfall and in mean temperature in Laguna, SCW may experience severe drought during the dry season and a significant higher rainfall amount during the rainy season that may cause flooding in low-lying areas. Furthermore, future climate scenarios also indicate that it may affect the growth, productivity, and quality of agricultural crops in the area. Hence, appropriate adaptation strategies at the watershed level must be developed to wane the effects of climate change.
Water Supply Variability and Impacts on Crop Production Climate and Rainfall
Based on the Corona Climate classification method, most areas on the South Western portion of the Santa Cruz watershed are under Type III which resembles
Type I. That is, the seasons are not very pronounced but with short dry season.
This is confirmed by the rainfall data of Nagcarlan which shows that only three months (February to April) are considered dry (Corona classifies a month as dry if its average monthly rainfall is less than 50 mm). Based on FGDs, the high- elevated barangays usually do not experience dry months, enabling the planting of vegetables two times a year. The southeastern areas of the watershed are classified as Type IV resembling Type II climate since rainfall is more or less evenly distributed throughout the year with no dry season. The climate of the low- elevated barangays of the watershed is quite different as manifested by the nineteen-year (1994 to 2012) average monthly rainfall of the PAGASA Weather Station in Santa Cruz, Laguna. Using the Corona method, it could be observed that on the average there are four dry months from January to April and eight wet months from June to December.
Surface and Groundwater Sources
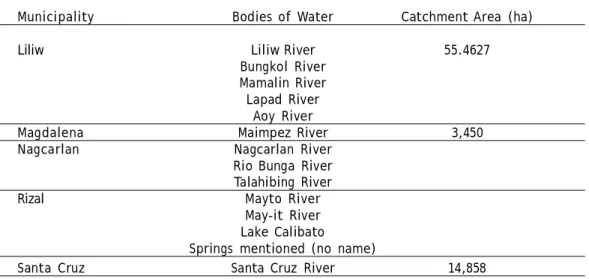
The Santa Cruz Watershed, one of the 24 sub-basins of the Laguna Lake, is endowed with numerous rivers, springs, and groundwater. Santa Cruz River is the main stream of the Santa Cruz Watershed and the other major tributaries (table 3). There are also several springs within the Santa Cruz Watershed which are the main sources of domestic water supply of high-elevated barangays. In Liliw, several barangays are getting their domestic water supply from fifteen
Table 3. Major rivers passing each municipality within the Santa Cruz Watershed
Municipality Bodies of Water Catchment Area (ha)
Liliw Liliw River 55.4627
Bungkol River Mamalin River Lapad River
Aoy River
Magdalena Maimpez River 3,450
Nagcarlan Nagcarlan River
Rio Bunga River Talahibing River
Rizal Mayto River
May-it River Lake Calibato
Springs mentioned (no name)
Santa Cruz Santa Cruz River 14,858
Source: CLUPs of Municipality
springs. According to the farmer who guided the project survey team, there is a nearby spring that used to be a source of domestic water supply for some households in the barangay, but water became scarce especially during the summer months. Almost all households are now dependent on a water supply pipe extracting water from another spring quite far from the Poblacion.
Based on a rapid ground water supply assessment made by the National Water Resources Council (NWRC) (1982), the flood plain portions of Santa Cruz are classified as shallow well areas where the static water level is generally within six meters below grown surface and that the depth of wells constructed is normally not more than 20 meters. Most of the areas up to the mountains are deep well or difficult areas in terms of abstracting groundwater through wells.
Utilization of Water Supply from the Watershed
Approximately 80 percent of the water being abstracted from the watershed is devoted to agriculture through irrigation. The Santa Cruz River Irrigation System (SCRIS) is the lone National Irrigation System (NIS) abstracting irrigation water from the watershed. At present, it is irrigating about 2,160 hectares benefiting around 1,577 farmers. In addition to the NIS irrigated area, around 400 hectares of rice farms are being served by the ten communal irrigation systems (CIS) also abstracting water from the watershed. These are constructed with the assistance of NIA but totally managed by the farmers.
Manifestations of Rainfall Variability in the Study Area
The extent and changes of water in the area can be attributed to the annual variation in temperature and precipitation. Pronounced climate variability in the Philippines may be gleaned from the experience and recorded occurrences of strong typhoons, southwest monsoons, and the El Niño phenomenon. From 1972 to 2003, not less than nine El Niño episodes affected the country; most notable was that of 1997 to 1998 with more than nine months of very warm period. In 2004 onwards, the occurrence of destructive typhoons in the province of Laguna seemed more frequent. The more recent ones were Typhoon Mirinae (Santi) in 2010 and Typhoon Rammasun (Glenda) which directly hit Quezon and Laguna in July 2014.
Analyzing the nineteen-year (1994 to 2012) rainfall data of Santa Cruz, Laguna, there appears to be marked variations in the average monthly rainfall and maximum daily rainfall per month between the ten-year period of 1994-2003 to the nine-year period from 2004 to 2012 (Villano et al. 2016).
Potential Impacts of Climate Change on Water Resources and Crop Production
Historical records of damages to agriculture, local people’s experiences, and rainfall data analysis all indicate that the more dominant climate hazards affecting the Santa Cruz Watershed and the nearby communities benefiting from its natural resources are the increasing frequency of strong or super typhoons and the southwest monsoon (popularly known as habagat). Aside from causing direct physical damage to crops, forest trees, fruit trees, animals and building, super strong winds, very intense rainfall intensity and long duration of rainfall both contribute to the occurrence of sedimentation, water supply scarcity, and water pollution.
The rainfall behavior in Nagcarlan indicated increasing rainfall intensity and erosivity in the study area (Villano et al. 2016). When forest trees are cut or logged and the land is converted to agriculture without conservation measures as observed in upland communities, the soil is exposed to the erosive power of the rainfall. If the rainfall intensity exceeds the soil infiltration capacity, runoff occurs causing more detachment and transport of soil particles. The erosivity of runoff is further magnified by increase in land slope. Severe erosion removes the fertile top soil reducing its crop productivity and exposes the soil layer with less infiltration capacity, thereby more rainfall occurs as surface runoff. And without trees and vegetation to restrain the movement of water on sloping land, the increased runoff travels faster reaching the low-elevation at a shorter time and causing rivers and canals to overflow resulting in flooding. Some of the eroded soil particles are carried by the runoff as sediment downstream. Streambank erosion is also a potential source of sediments which could be easily carried downstream by high river flows.
The damage to the diversion dam of the Santa Cruz River Irrigation (SCRIS) brought about by Typhoon Milenyo in 2006 was due in part to the heavy volume of sediments entrained from the stretch of the river beds by the strong water flow.
The new diversion dam constructed just a few meters above the previous location in 2007 is already filled up with sediment carried by heavy river flow due to Typhoons Ondoy and Santi in 2010. The intake channels of the Calumpang CIS and Bungkol CIS were also blocked by big rock boulders brought down by very strong river flow high during Typhoon Santi in 2010. Considering that about 60 percent of the watershed area has slopes greater than 8 percent and that in general, conservation farming is not being practiced in the area, it is not unlikely that the severity of flooding and sediment problems in the study area will be further aggravated by climate change.
From the CLUPs of municipalities within the Santa Cruz Sub-Watershed, rice yield level ranges from 3.9 to 5.75 tons/ha or an average of 4.83 tons/ha.
Potential yield of traditional varieties may range from 6 to 7 tons/ha. Using the firmed-up service areas (FUSA), the average annual cropping intensity of the SCRIS is 182.15 percent. Based on the FGDs and KIIs, however, some farmers downstream claim that irrigation water does not normally reach their farm during the dry season.
Another and more serious potential impact on water sustainability will be the further reduction in the recharge of the aquifers if the present rate of deforestation is not seriously and adequately arrested. With a deforested watershed coupled with increasing area of non-sustainable practices of farming, strong typhoons and intense habagat will cause severe and widespread soil erosion removing the top soil and decreasing the soil infiltration rate. With less soil infiltration, more of the rainfall will move as surface runoff and less will percolate to recharge the aquifers underground. Such situation will eventually lead to reduced water out from springs, decreased dependable river flow, and drop in the groundwater table especially during the dry months thereby affecting the availability and adequacy of water supply for the different uses.
The above situation partly explains the observation in the midland barangay that a spring below their kaingin (swidden) area dries up during summer time (Villano et al. 2016). While there is no reported drying up of most of the springs supplying domestic water to majority of the upland communities, there are reports during the FGDs that the summer discharges of such springs show significant reductions. Consequently, the same situation is also the major reason why Santa Cruz River Irrigation System could not irrigate a considerable portion of its service area during the dry season.
Lastly, eroded soil particles brought down the streams by runoff is the main potential source of sediments degrading the physical quality of water. Waste materials like plastics from indiscriminate garbage disposal, residential and commercial areas carried by surface runoff from upstream and irrigation water was observed in the lowland study barangays. Possible sources of chemical and biological contaminants include fertilizer and pesticides residues from agricultural areas, existing waste water treatment plants/tanks of poultry and piggery businesses and even household septic tanks which abound along the banks of the watershed stream networks.
Community Profile and Vulnerabilities in the Study Sites Sociodemographic Profile
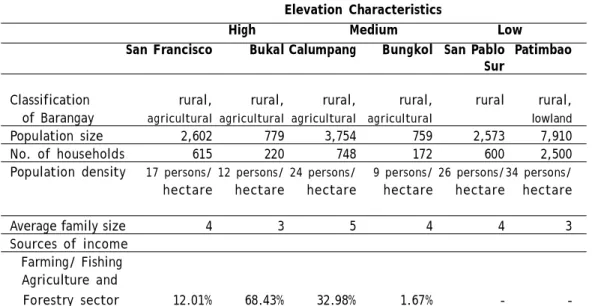
A brief barangay profile of each of the study sites captured the general situation (sociodemographic and agriculture) of each barangay (table 4). Among the six barangays, those in low elevation had the highest population size (7,910 and 2,573, respectively) and density (24 and 26 persons per hectare, respectively) compared to the barangays at the medium and high levels. The more vulnerable sites tended to have higher population and greater density than those less vulnerable, except for the communities at the high elevation where the lesser vulnerable barangay had more people and density than the more vulnerable one.
The average family size is four for all the barangays regardless of elevation.
Educational attainment data, obtained for the medium and high elevation barangays, indicated that only a small percentage (less than 0.05 percent) had no formal schooling. Average monthly income data were available only in barangays in high elevation. The less vulnerable barangay had a higher average monthly income.
Table 4. Sociodemographic characteristics of the study sites
Elevation Characteristics
High Medium Low
San Francisco Bukal Calumpang Bungkol San Pablo Patimbao
Sur
Classification rural, rural, rural, rural, rural rural,
of Barangay agricultural agricultural agricultural agricultural lowland
Population size 2,602 779 3,754 759 2,573 7,910
No. of households 615 220 748 172 600 2,500
Population density 17 persons/ 12 persons/ 24 persons/ 9 persons/ 26 persons/34 persons/
hectare hectare hectare hectare hectare hectare
Average family size 4 3 5 4 4 3
Sources of income Farming/ Fishing Agriculture and
Forestry sector 12.01% 68.43% 32.98% 1.67% - -
Sources: Barangay Management Information System (BMIS of Bukal, Nagcarlan) 2002.
Barangay Disaster Risk Reduction Management Plan (BDRRMP of Calumpang, Liliw, San Pablo Sur, Santa Cruz) 2013 and 2014.
Barangay Governance Performance Management System (BGPMS of Calumpang, Liliw, and Patimbao, Santa Cruz) 2011 and 2014.
The sources of income common to all the barangays were farming, fishing, and other agriculture-related work; skilled work (laborers); service work (company or government employees) and businesses. Service work as the main source of income was prevalent for residents in barangays at medium elevation. For the high elevation areas, skilled work comprised a high percentage as the main source of income, followed by farming, service work, and plant and machine operation and assembly.
No significant differences among the less and more vulnerable barangays could be observed in relation to the main sources of income (Abrigo et al. 2016).
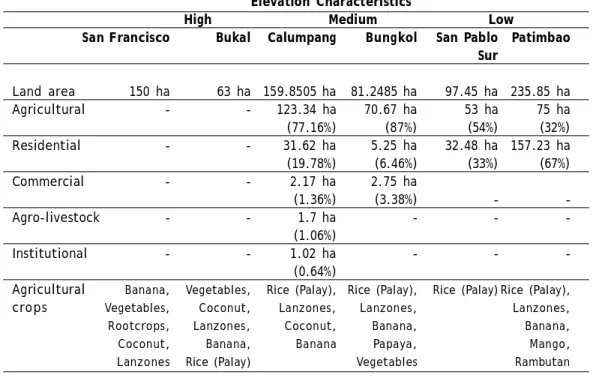
Land Use and Agricultural Profile
In terms of land use, agriculture is the major type, except for Patimbao, a low- lying barangay, where residential areas comprise the major land use. More than half of the total land area of the barangays is agricultural lands (table 5).
Rice is the most commonly grown crop in low elevation barangays. Other crops include fruit trees such as lanzones, banana, rambutan, and mango. In the barangays at medium elevation, crops grown include rice, coconut, and fruit trees such as lanzones and bananas. Vegetables are also common in medium elevation areas. The upland barangays, on the other hand, do not plant rice. Their main agricultural produce are coconuts, fruit trees (such as lanzones and banana), vegetables (tomato, cucumber, beans, etc.), and rootcrops (taro, sweet potato, cassava). All the agricultural lands in the low and medium elevation barangays are irrigated. The farms in the upland barangays are rainfed, with frequent rains reported throughout the year.
Knowledge and Understanding of Climate Change and Extreme Events
The participants in the FGDs noted that the usual dry and wet seasons are no longer distinct at all. Typhoons are more frequently occurring. Barangays in the low elevation areas experience sudden intense heat and untimely heavy rains because of climate change. They said that sometimes the weather is intensely hot particularly when there is severe drought. Likewise, flooding occurs after heavy rains. The elderly and younger people are getting sick as well as the animals.
The participants from the medium elevation and more vulnerable community were more concerned about the cause and effects of climate change on their crops.
They noted the seemingly longer dry season and that the heat of the sun seems to be more irritating on their skin. They also observed instances of flooding in their areas and there is flowing water in the river. However, because of climate change, the river seems to be drying up, in their view. On the other hand, participants
from the medium elevation and less vulnerable community shared that climate is changing as the dry and wet seasons are no longer distinguishable. Cold temperatures can no longer be felt.
The participants from high elevation and more vulnerable community observed stronger typhoons because of climate change. On the other hand, participants from high elevation and less vulnerable community noted the less than distinct dry and wet season have made the cropping calendar hard to follow. The dry season is longer, and rains are more intense. A growing awareness on the effects of climate change was observed in all barangays. They
Table 5. Land use and agricultural profile of the study sites
Elevation Characteristics
High Medium Low
San Francisco Bukal Calumpang Bungkol San Pablo Patimbao
Sur
Land area 150 ha 63 ha 159.8505 ha 81.2485 ha 97.45 ha 235.85 ha
Agricultural - - 123.34 ha 70.67 ha 53 ha 75 ha
(77.16%) (87%) (54%) (32%)
Residential - - 31.62 ha 5.25 ha 32.48 ha 157.23 ha
(19.78%) (6.46%) (33%) (67%)
Commercial - - 2.17 ha 2.75 ha
(1.36%) (3.38%) - -
Agro-livestock - - 1.7 ha - - -
(1.06%)
Institutional - - 1.02 ha - - -
(0.64%)
Agricultural Banana, Vegetables, Rice (Palay), Rice (Palay), Rice (Palay) Rice (Palay),
crops Vegetables, Coconut, Lanzones, Lanzones, Lanzones,
Rootcrops, Lanzones, Coconut, Banana, Banana,
Coconut, Banana, Banana Papaya, Mango,
Lanzones Rice (Palay) Vegetables Rambutan
Source of irrigation
Irrigated - - 100% 100% 100% 100%
Rainfed 97.31% 99.56% - - - -
Note: Blanks imply no data.
Sources: Barangay Management Information System (BMIS of Bukal, Nagcarlan) 2002.
Barangay Disaster Risk Reduction Management Plan (BDRRMP of Calumpang, Liliw, San Pablo Sur, Santa Cruz ) 2013 and 2014.
Barangay Governance Performance Management System (BGPMS of Calumpang, Liliw, and Patimbao, Santa Cruz) 2011 and 2014.
identified weather irregularities (unusually extreme heat or rains; prolonged duration of heat or rains resulting in indistinct dry and wet seasons; both rain and shine experienced within the day); stronger and more frequent typhoons; flooding; more sickness among the elderly, children, and even the animals; and a decreased yield in crops, fruit trees, and vegetables as related to the changing climate.
There were also differences in climate change knowledge among the barangays at each elevation level. The residents of barangays at low elevation linked climate change to flooding in their areas and increasing illnesses among the elderly, children, and even animals. The barangay residents in the medium elevation areas also attributed unusual instances of flooding during typhoons to climate change.
They also thought that climate change has affected their crops, particularly lanzones trees, which have taken three years before they started to bear fruits again. The barangays in the high elevation sites linked climate change to observed stronger typhoons and to aberration of the normal cropping calendar.
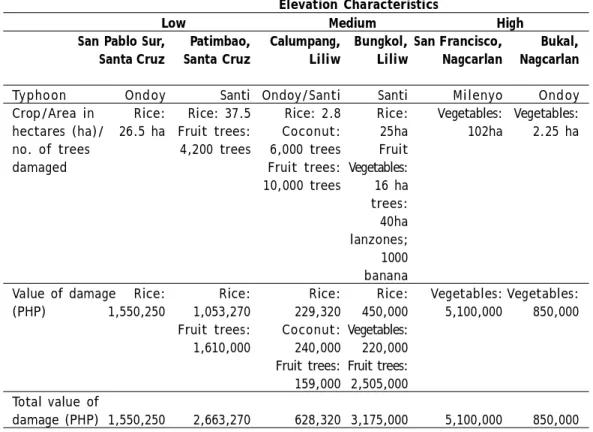
Extreme Events and Effects in the Agricultural Sector
FGD participants from lowland and midland barangays cite Typhoon Milenyo in 2006 as the most unforgettable extreme event. Milenyo brought strong winds and heavy rains that caused flooding, eventually damaging agriculture. Residents recalled the wrath of Typhoons Santi and Ondoy in 2009. In these barangays, heavy rains and flooding occurred, causing a number of casualties from the storms. Residents of low-lying areas had anticipated flooding in their barangay because of their location. Aside from the fact that they are in a low-lying area, their barangay is a catchment for the water from the surrounding mountains. It is in their area where the waters from the mountains and the lake meet.
Only the residents of Patimbao, Santa Cruz, a lowland barangay, experienced drought in 2005. They remembered not being able to harvest crops for two whole seasons. The upland and midland barangays have recently observed floods, which affected their crops and fruit trees (table 6).
The typhoons also damaged the irrigation facilities including the main dam and irrigation canals, thus disrupting the supply of water to the farms. This prevented farmers from planting for the next one to three cropping seasons. In low elevation areas, the repair of the dam suspended the operation of the irrigation system and the farmers were not able to plant rice the next three seasons.
Foregone income amounted to around PHP 10.5 million (Villano et al. 2016;
Abrigo et al. 2016). Funds amounting to around PHP 40,000 for the repair of the irrigation canals were taken from the barangay internal revenue allotment (IRA).
In the lowland Barangay of San Pablo Sur, floodwaters brought by typhoon Santi took one month to subside.
Crop Production Vulnerability
The vulnerability of a community’s agricultural production systems to strong and intense habagat varies with respect to their relative location within the watershed.
In high elevation (more than 470 masl) communities, Garcia et al. (2016) reported that the main agricultural products are vegetables (tomato, radish, beans, cucumber, cabbage, cassava, sweet potato, chayote, and mustard). Perennial crops such as lanzones and rambutan were also observed which are usually planted under coconut trees. Typhoons, especially if accompanied by strong winds, can cause lodging in vegetable crops and felling of perennial crop trees and plants like lanzones, coconut
Table 6. Damages to agriculture due to floods in the study sites
Elevation Characteristics
Low Medium High
San Pablo Sur, Patimbao, Calumpang, Bungkol, San Francisco, Bukal,
Santa Cruz Santa Cruz Liliw Liliw Nagcarlan Nagcarlan
Typhoon Ondoy Santi Ondoy/Santi Santi Milenyo Ondoy
Crop/Area in Rice: Rice: 37.5 Rice: 2.8 Rice: Vegetables: Vegetables:
hectares (ha)/ 26.5 ha Fruit trees: Coconut: 25ha 102ha 2.25 ha no. of trees 4,200 trees 6,000 trees Fruit
damaged Fruit trees: Vegetables:
10,000 trees 16 ha trees:
40ha lanzones;
1000 banana
Value of damage Rice: Rice: Rice: Rice: Vegetables: Vegetables:
(PHP) 1,550,250 1,053,270 229,320 450,000 5,100,000 850,000
Fruit trees: Coconut: Vegetables:
1,610,000 240,000 220,000 Fruit trees: Fruit trees:
159,000 2,505,000 Total value of
damage (PHP) 1,550,250 2,663,270 628,320 3,175,000 5,100,000 850,000
palms, and banana. Perennial crops like coconut and lanzones can withstand strong winds but considerable yield reduction is observed. Recovery period of perennial crops may take two to three years. The rejuvenation of felled trees requires additional cost and causes delay in fruit bearing (Garcia et al. 2016).
According to Garcia et al. (2016), the farmers in the medium elevation areas (21–
470 masl) grow diverse crops. They grow crops that are adapted and grown in both the low and high elevation areas. The major crops planted include rice, vegetables, fruit trees, banana, and coconut. Except for rice, the other crops grown in high elevation areas are also grown in the medium elevation areas; hence, they have similar sensitivities to the climate hazards. Irrigated farms within the mid-elevation areas are also threatened by strong typhoons or intense habagats. With inadequate intake gate control structures, extremely high river flow could damage the canals or add too much water to the farms causing lodging of rice or even collapse of rice terraces. Sediments and rock boulders may also destroy their diversion structures.
Low-elevation barangays are mainly irrigated rice producing areas with a small portion planted with coconut and fruit trees. Garcia et al. (2016) noted that around 90 percent of the respondents in both barangays do plant rice. Strong typhoons or intense habagat normally inundate rice plants, causing them to lodge and submerge resulting in heavy production losses. Garcia et al. (2016) noted that during a focus group discussion, the farmers estimated a reduction in the yield of around 51-100 percent in Barangay San Pablo Sur, and 30 percent in Bgy. Patimbao.
Vulnerability of Existing Irrigation Systems
With the potential threat of climate change, the productivity of the existing irrigation systems could be drastically reduced through infrastructure damages by extreme floods and sediments as what Typhoon Milenyo did to the SCRIS diversion dam.
Based on its original or design service area, the average cropping intensity of SCRIS during the dry season 63.5 percent and only 63.1 percent in the wet season.
That means the irrigation system could not supply water to about 37 percent of its design service area in both cropping seasons. The major reasons for the low dry season cropping intensity include significant reduction in the dry season flow of the Santa Cruz River and the inability of the system management in controlling over irrigation by upstream farmers thus denying the downstream farmers of their fair share to the water. On the other hand, damages to planted rice crops due to severe flooding during the rainy days is the main culprit for the low wet season performance of the system.
Based on FGDs, farmers also claimed that when the SCRIS diversion dam was severely damaged by Typhoon Milenyo in 2006, the system was not operational for about two cropping seasons to give way for its reconstruction. The tremendous river flow brought about by high intensity and prolonged rainfall carried down volumes of sediment including big boulders causing the collapse and washing out of the dam structures. Uncontrolled quarrying along the river bed and sides was also cited as contributing to the weakening of the dam foundation.
Using the results of the Survey on Food Demand for Agriculture Commodities, NIA estimated the rice self-sufficiency in the Province of Laguna as follows: 27.44 percent in 2007, 29.71 percent in 2008, and 23.63 percent in 2009. For the communities within the Santa Cruz Sub-watershed, however, rice self-sufficiency level was estimated to be 46.44 percent for 2013. This was based on the following data and assumptions: population of 184,000 estimated rice farm area within the sub-watershed of 1,900 ha (assuming about 70 percent of SCRIS FUSA is within the watershed plus CIS FUSA); average annual cropping intensity at 180 percent (based on FUSA); BAS per capita rice consumption of 116 kilograms per year; and 60 percent milling recovery. While this is quite a conservative estimate (due to some doubts on the accuracy of reported actually irrigated area), this is an indication that in 2013 the irrigated farms produced only less than half of the rice requirements of communities within the sub-watershed of Santa Cruz. That is, more than 50 percent of the rice requirements within the Santa Cruz sub- watershed is coming from outside sources.
Policy and Governance Influence on Community Adaptive Capacities in the Study Sites
Indicators of adaptive capacity of community include institutions and governance; risk assessment, monitoring, and warning; knowledge, education, and information; and climate change adaptation technology and infrastructure (Abrigo et al. 2016). There are also underlying factors that could affect a community’s vulnerability to climate change-related risks such as the programs and policies on land use, environmental resource management, and food security.
Indicators of Adaptive Capacity
The strengths in institutions and governance were in frameworks and structures because of the presence of disaster risk reduction and management (DRRM) councils and drafting of DRRM plans, and human resource capability due to attendance to training and seminars related to climate change and related
disasters. On the other hand, weaknesses were identified in initiatives on land use policy; food and livelihood security; technology and infrastructure, including weather instruments and early warning systems, and relocation sites; and financial capability (Abrigo et al. 2016).
Knowledge, education, and information systems such as the presence of hazard maps, early warning devices, and monitoring systems need strengthening.
Raising awareness about extreme events and increasing understanding on climate change are two necessary requirements for capacity building.
The concerned barangay leaders who were interviewed during the FGDs are considering adaptation strategies, such as tree planting, not only as a response to typhoons but also as protection of the environment in general. Building social capital and seeking partnerships not only with the business community but also with the scientific community would enable the communities to harness financial and technical resources to build their adaptive capacity. LGUs can seek partnership with schools/universities, private sector, and national government agencies in environmental activities. The LGU’s bantay-gubat program is mobilized for this activity.
Underlying Risk Factors in the Santa Cruz Communities
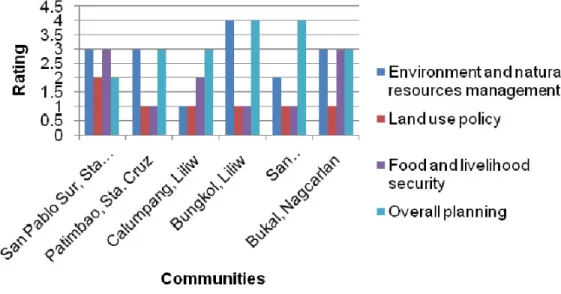
The underlying factors that affected a barangay’s vulnerability to climate change-related risks include: the barangay’s programs and policies on land use, environmental resource management, food security and livelihood programs, and overall planning. These factors are contributory measures to ensure that barangays are highly anticipative and prepared for the potential impacts. Figure 4 shows the ratings given by the barangays leaders for the different underlying factors specified in their respective communities (Abrigo et al. 2016).
Barangays in the low, medium, and high elevation levels have implemented tree planting activities and waste segregation to help the environment. Watershed level environmental protection is reflected in their cooperation in the management of Mt. Banahaw, a protected area. Fourteen DENR-deputized bantay- gubat volunteers monitor Mt. Banahaw monthly and regularly report findings (new species, damaged trees, illegal logging activities) to DENR. However, the ad hoc observance of adopted policies, such as solid waste management, was considered a major constraint.
All barangays have food security and livelihood programs but one common problem is the lack of funds for implementing or practicing techniques
learned. Residents lack capital to start and maintain their desired enterprise.
Community efforts related to food security are also in place. Local governments allotted a budget for agricultural programs like the distribution of seeds, insecticides, and medicines to farmers. There are programs for pig dispersal; a provision for fertilizers and seeds (rambutan, vegetables); and lessons on compost-making.
Lastly, only one of the barangays confirmed an existing land use policy for their area. Views on whether a land use policy was needed at the barangay level differ in each of the communities. The less vulnerable barangays did not see the need for it and asserted that there are other more densely populated areas (such as the poblacion) in the municipality that needed land use policies.
The various areas of adaptive capacity examined in this study reveal that the focus of efforts is geared toward the disaster risk reduction response, such as relief and rescue operations. This is evident in the items that their LDRRM funds are spent on, which are rescue equipment and communication facilities such as two- way radios (Abrigo et al. 2016). Though there are initiatives on food security, which are usually coursed through agricultural programs, it is not the main focus of their communities’ climate change efforts.
Figure 4. Adaptive capacity ratings of the study areas on underlying risk factors component
Conclusion
Based on the findings of the study, communities with different elevations and degree of vulnerability were affected in various ways. The extreme events recollected and identified were Milenyo (2006) and Ondoy and Santi (both in 2009). The study sites also had a growing awareness of climate change as reflected in their observations of irregularities in weather patterns (variability in rainfall patterns/ extreme heat/typhoon occurrences not in their normal pacing/difference in seasonality) which eventually affects food security. Agriculture sector was the most adversely-affected. Some respondents also report that these damages did not significantly affect their household food security situation, because they were able to store part of their produce for their own consumption.
Institutions and governance were identified to be strengths in almost all the study sites. They were considered assets to be used to overcome the weaknesses hindering effective adaptation. Planning and coordination through establishing strong linkages and communication with these network of communities within the watershed, the government, non-government, private, and civil society sectors is needed in order to fill in the gaps—such as funds, peoples’ participation, and lack of equipment—that often create ineffective adaptation.
Due to their experiences of flooding and—to some extent—drought, officials and members of the communities clearly stated their need to improve their adaptive capacity. One of the primary constraints in the implementation of adaptation strategies is funding. Although they can implement technological, social/institutional, and economic strategies, they kept on mentioning the need for sufficient budget to continue with these activities. It was also brought up in the study that coordination with the watershed stakeholders is impeded because of insufficient budget and overall planning.
Recommendations for Land Use Policy Action
For the sustainable protection and conservation of the watershed resources, the challenge lies in getting watershed stakeholders to contribute resources from both policy and operational perspectives. Policy and institutional concerns would include the following:
1. strengthening the river councils;
2. continuing to support the implementation of the existing Mts. Banahaw- San Cristobal Protected Landscape;
3. creating policies to encourage adoption of soil and water conservation technologies;
4. introducing economic and financial schemes to farmers to cope with impacts of climate change-related events; and
5. implementing policies and programs on livelihood to improve household resilience.
There are four policy recommendations that come out of the discussions above which need land use policy actions.
Protect and Reforest Declared Forest Reservation or Protected Areas
Identify and delineate the portion of the Santa Cruz Sub-Watershed which is within the Mts. Banahaw-San Cristobal Protected Landscape (MBSCPL) which was officially declared on December 11, 2009 as a full-fledged Protected Area under Republic Act No. 9847. It covers an area of 11,133.30 hectares within the political jurisdiction of the provinces of Laguna and Quezon. The same area has been declared in 1921 as a national park. There is also a need to support and pursue effective implementation of the MBSCPL Master Plan being implemented by the Protected Area Management Bureau (PAMB) of the DENR. The Plan envisions that by 2020, the protected area will be a “sacred and unique place rich in biodiversity, energy, food, fresh air, water, and livelihood cared for by the community in a balanced manner based on history and sustainability for the benefit of many generations to be showcased to the world.” The Plan should focus on the promotion of sustainable livelihood within the community level.
Protect the Remaining Forest
Another strategy is to prioritize the protection of the remaining 2,000 hectares of forest cover within the watershed even if these are not within the Protected Area. There is a need to delineate the 1,150 hectares grassland within the watershed and consider the feasibility of pursuing its reforestation under existing programs such as the Community-Based Forest Management and National Greening programs of the government. Besides planting of trees, alternative strategies include conducting a feasibility study of the following measures in both the forested and grassland areas: gully check dams and plugs, stream bank stabilization, and artificial aquifer recharge pits.
Craft a Watershed Level Comprehensive Land and Water Use Plan
Policy formulation is needed in order to come up with a watershed level comprehensive land and water use plan. Currently, all municipalities are required to prepare a comprehensive land use plan (CLUP). These plans however were seen to be not linked to land and water use at the watershed level; hence, externalities from land conversion upstream are felt by downstream communities.
This becomes the source of conflicts especially when it comes to externalities due to land and water use. This watershed development plan could contain assignment of forest reserves, purely agricultural areas, built up areas, and other land uses that will not be harmful especially to the lowland areas that suffer from flooding and soil erosion. A watershed development plan could also protect the landslide areas and the communities living in these areas. The other components of the plan—such as institutional strengthening, strict implementation of regulatory policies and other water management strategies, and agricultural activities—can be pursued.
The Department of Interior and Local Government (DILG) together with the Housing and Land Use Regulatory Board (HLURB) oversee the CLUP, but for the watershed level land and water use plan, the executive department that has a mandate for this is the Department of Environment and Natural Resources. This effort could also be a joint activity with the Department of Agriculture, as these plans directly affect food security in the country.
Advocate for the Passage of the National Land Use Act
A legislative act that will affirm the suggested policy above is the passage of the National Land Use Act. This has been stamped as urgent by the past congress, but this has not yet been acted upon until now. Senate Bill 3091, more commonly known as the National Land Use Act (NLUA), is pending. Its counterpart measure in the House of Representatives, House Bill 6545 or the National Land Use and Management Act, hurdled the third and final reading last September 2012, almost five years ago.
NLUA seeks to create a National Physical Framework Plan that will categorize land resources into four categories: protection (for conservation), production (for crops, fishery, livestock and poultry), settlements development (for residential purposes), and infrastructure development (for transportation, communication, water resources, social infrastructure).
There are several laws on land use but these are not integrative. Existing laws on land include: Agriculture and Fisheries Modernization Act, the National Integrated Protected Areas System, the Comprehensive Agrarian Reform Law, the Indigenous Peoples Rights Act, Urban Development Housing Act, the Fisheries Code, and the Local Government Code (LGC). The NLUA aims to institutionalize a centralized structure for classifying land according to use.
Acknowledgments
The study from which this paper was derived was funded by the University of the Philippines Center for Integrative and Development Studies (UPCIDS). The authors would like to thank the CIDS as well as the various respondents from the study area who cooperated with the project personnel in supplying secondary and primary data.
References
Abrigo, Girlie Nora A., Gloria Luz M. Nelson, Dulce D. Elazegui, and Elaine Joyce V.
Borejon. 2016. Community Level Adaptation to Extreme Climate Events. In Environment and Food Security Interactions amid Climate Change: A Multi-scale Analysis in a Philippine Watershed, edited by Agnes C. Rola, Zenaida M. Sumalde, and Jose Nestor M. Garcia, 161-84. Quezon City: University of the Philippines Center for Integrative and Development Studies.
Adger, W. Neil. 2003. “Social Capital, Collective Action and Adaptation to Climate Change.” Economic Geography 79, 4: 387-404.
Adger, W. Neil, Nick Brooks, Graham Bentham, Maureen Agnew and Siri Eriksen.
2004. “New Indicators of Vulnerability and Adaptive Capacity.” Technical Report 7, Tyndall Centre for Climate Change Research, School of Environmental Sciences, University of East Anglia.
Anderson, James R. 1977. “Land Use and Land Cover Changes: A Framework for Monitoring.” Journal of Research of the U.S. Geological Survey 5: 143-53.
Balatibat, Emelita M. 2004. “The Linkages between Food and Nutrition Security in Lowland and Coastal Villages in the Philippines.” PhD diss., Wageningen University, 2004.
Bontemps, Sophie, Patrick Bogaert, Nicolas Titeux, and Pierre Defourny. 2008. “An Object-Based Change Detection Method Accounting for Temporal Dependences in Time Series with Medium to Coarse Spatial Resolution.” Remote Sensing of Environment 112: 3181–91.