Vol. 15, No. 1 (January - April 2013): 1 - 26
Identiication and Risk Management
In The Expenditure Process:
Risks Leading to Deadline Slippage and Costs, and
Building Projects
Abdelhak Challal
Studies and Research Laboratory in Applied Mathematics (LERMA)
Mohammed V University- Mohammadia School of Engineering Rabat, Agdal Morocco
Mohamed Tkiouat
Studies and Research Laboratory in Applied Mathematics (LERMA)
Mohammed V University- Mohammadia School of Engineering Rabat, Agdal Morocco
Abstract: The objective of this research is the design of a mapping of risks which are mainly related to
the processes of expenditure. The research also serves to identify the actions and the necessary measures to control risks and the delays of completing a construction project. The literature from the last two decades related to this ield was examined. A quantitative analysis of risks in the expense process of building projects sample representing various regions of Morocco allows identifying the risks and ranking them by determining their occurrences and impacts. Eight major risks, 43 measures, 52 actions and 10 performance indicators are linked to these risks have been identiied.
Abstrak: Tujuan penelitian ini adalah desain dari pemetaan risiko yang terutama berkaitan dengan proses
pembelanjaan. Penelitian ini juga berfungsi untuk mengidentiikasi tindakan dan langkah-langkah yang diperlukan untuk mengendalikan risiko dan penundaan dalam menyelesaikan proyek konstruksi. Literatur dari dua dekade terakhir berkaitan dengan bidang ini diuji. Sebuah analisis kuantitatif dari risiko dalam proses biaya pembangunan proyek sampel, yang mewakili berbagai daerah di Maroko memungkinkan mengidentiikasi risiko dan peringkat mereka dengan menentukan kejadian dan dampaknya. Delapan risiko besar, 43 langkah-langkah, 52 tindakan dan 10 indikator kinerja yang terkait dengan risiko telah diidentiikasi.
Introduction
The problem of delays in the ield of construction is a common phenomenon worldwide. In Saudi Arabia, Assaf and Al-Hejji (2006) found that only 30 percent of construction projects have been completed within the contracted deadlines, and the aver
-age slipping period was between 10 percent and 30 percent. In Nigeria, Ajanlekok (1987) identiied through a questionnaire survey the delays’ effects on 61 construction proj
-ects. The results demonstrated that deadline slippage and cost overruns were frequent and quite signiicant. The project manager is generally responsible for those causes. Odeyinka and Yusif (1997) also illustrated that 7 projects out of 10 studied had expe
-rienced deadline slippage during their execu
-tion. Chan and Kumaraswamy (1997) studied the delays in industrial construction in Hong Kong. They underlined the success index of a project and its delivery within the deadlines, respecting the quality norms and the budget allotted to it.
Normally, when we realize that the projects will experience some deadline slip
-page, we provide a deadline extension or we accelerate the pace of the works execution. As a consequence, we allow for additional expenses, normal practices which generally permit an addition of a supplementary cost percentage based on a prior study. Time per
-formance is one of the key measures of the project’s success.
According to Faridi and El-Sayedgh (2006) delays have a negative impact on the success of the project in terms of time, cost, quality and security. For Aibium and Jagbor (2002) the entrepreneur and the Project Manager are jointly or separately responsi
-ble for the delay in executing construction projects. The delays cannot be minimized
unless their causes are known, and in order to have an accurate estimate of costs and deadlines, reliable methods and commonly agreed practices must be applied. Faridi and El-Sayedgh (2006) also emphasized that these causes must be controlled during the life time of the project. Moreover, an impor
-tant economy of resources can be obtained while identifying and controlling the causes.
The main objectives of this study are as follows:
- Design a mapping of risks related to bud
-getary process and expenditure
- Identify the necessary actions and mea
-sures to control risks and delays of com
-pleting the construction projects
This article is organized as follows: Section 1 deals with the previous studies on the causes of deadline slippage in construc
-tion projects. Sec-tion 2 explains the meth
-odology adopted. Section 3 discusses the re
-sults. Section 4 presents the elements of risks raised in the interview, Risk detail, Causes of risk and Identiied incidents. Section 5 pres
-ents the actions and measures which mini
-mize construction project delays. Section 6 presents the performance indicators that are related to them. Section 7 attempts to draw conclusions and perspectives.
Literature Review
Many articles and studies conducted on the causes of construction project de
-lays worldwide have been examined. The risk identiication process has been to iden
-tify, deine and describe the risks or the risky events in the particular context of a project.
-tiication process has allowed the creation of a list of risks that could have negative im
-pact (threat) or positive ones (opportunities) in reaching the project objectives. The risks have been identiied on the basis of hypothe
-sis, plans and speciications and also the judg
-ment of experts.
In Morocco, Challal and Tkiouat (2012) identiied the causes of delay slippage that are seriously risky particularly in the estima
-tion of the initial budget, the volatility of ar
-chitecture program and engineering as well as building site risks. These indings were ob
-tained on the basis of a quantitative analysis of delay risks in a sample of building projects that represents various parts of Morocco. Ubaid concluded in his surveys on the proj
-ects completed in Saudi Arabia that lack of entrepreneurial performance is one of the major causes of delays. He also identiied the principle measures to reinforce resources and improve entrepreneurial skills. Assaf et al. (1995), Al-Ghaly (1995) observed that the major causes linked to construction projects in Saudi Arabia are due to inancial prob
-lems, changes in project conception ,projects’ contributions, delay in decisions-taking, get
-ting owner’s approval, dificulties in get-ting a work permit, communication and coordi
-nation problems. In Morocco, Challal and Tkiouat (2012) identiied factors that lead to over- and underestimations: lack of price ref
-erence pricing, Lack of ref-erence of works, lack of costing model, the changing needs and the insuficiency of prior studies.
Chan and Kumaraswamy (1997) have carried out a survey to evaluate the relative importance of 83 factors of potential de
-lays in construction projects in Hong Kong. They observed that 5 major causes of dead
-line slippage related to mismanagement of
needs, variation of working time. Kaming et al. (1997) has studied the causes of slippage of the completion date of 31 sky-scrappers in Indonesia. They noticed that cost over
-runs happen most frequently and are most signiicant than deadline slippage. They un
-derlined that the main causes of this slippage are: the increase due to inlation, the under
-estimate of material cost as well as the degree of complexity of the construction project itself, those relating to slippage are: change of design conception, weak productivity, in
-adequate planning, shortage of resources. Kumaraswamy and Chan (1998) noted in a study that the causes in construction projects conducted in Honk Kong that there were dif
-fering perceptions by the different parties. Noulmanee et al. (1999) concluded in a study on the causes of delays in the construc
-tion of highways in Thailand that the major causes are due to sub-contractors’ incompe
-tency and poor project conception (incom
-plete and inaccurate design) They also sug
-gested that the delay could be minimized by devising a good project conception, close co
-ordination and an effective communication among between the participants. Al-Momani (2000) in his survey on 130 public projects in Jordan pointed out that the main causes of delay are: poor project conception, climate, poor site management, delay in delivery, eco
-nomic situation and the amendments. He rec
-ommended that managers of public projects take the necessary time to start carrying out thorough studies by using real quantitative data in order to formulate pertinent terms before starting attributing the said project.
The study also suggested that special at
(2006), Meeampol and Ogunlana (2006), Sambasivan and Soon (2007), Le-Hoai et al. (2008) deadline slippage could lead to a num
-ber of negative effects, such as cost over
-runs Sambasivan and Soon (2007), Towhid and Amiruddin (2011) noted that major de
-lay consequences are related to arbitration conlicts, litigations, and total abandonment. Toor and Ogunlana (2008), and Tumi et al. (2009) believe that poor planning and lack of communication are the principle causes of deadline slippage in construction projects in Libya.
Hamidreza et al. (2010) qualiied certain causes as unacceptable in order to respect the contractual deadline for the completion of the construction projects in Hong Kong. These causes are relative to delays of supply and subcontractors’ incompetence. Haseeb et al. (2011) consider that to avoid delays, the project manager must settle the corpo
-rate discount on time. Also the enterprise must do the same thing for the subcontrac
-tors. Ogunlana et al. (1996) noticed that time and cost overruns in construction projects of sky-scrappers in Bankok and Thailand re
-sulted from three factors: lack of infrastruc
-ture, default in payment by both customers and consultants, and contractors incompe
-tency, they recommended that managers and associations specializing in the ield of con
-struction make more efforts to streamline and build the infrastructure which would al
-low easy supply of materials and boost efi
-ciency in the ield of construction. Frimpong et al. (2003) conducted a survey through a questionnaire on underground construction projects in Ghana in order to identify and evaluate the importance related to the factors leading to time and cost overruns of the said projects. The indings revealed that the main
causes are: late payment on the part of the project managers, shortage of raw materi
-als, implementation of obsolete construction processes, and the high cost of raw materi
-als. They recommended that to minimize the delays in carrying out the construction works, the projects should be well in advance, and a follow-up must be insured as well as the control and respect of the accomplishment planning.
Methodology
(Adopted: Limitations and
Skills)
The adopted methodology includes a ‘top down’ qualitative analysis. It allows high
-lighting the most important risks among all those will be identiied. We seek to identify the risks to which the project is the most vulnerable, so that more attention and closer monitoring will be allowed. In the area of risk management, this analysis is generally raised by the level of probability of an event and the importance of impacts it will have on the project. The combination of the two serves to measure and judge the importance of an identiied risk compared to others.
According to the “top-down” process adopted so far by the previous so-called mac
-roscopic studies, and which helped to inves
-tigate and assess major risks on the macro-process through documentary research, interviews, questionnaires, by starting the evaluation of frequent occurrences the sever
-ment of a mapping of risk causes. Also, 8 major causes were identiied. The top-down approach certainly helps dispose of a risks mapping in a short time.
Limitations
The methodological elements used were inspired from the best practices and adapted to the context and level of maturity of the enterprises, the project manager and owners; as such it would help generate a mapping of causes and risks.
However, the success and eficiency of mapping the causes of deadline slippage is based on the ability of the enterprises, the project manger and the owners to put them into good effect. Nevertheless, these rules are reinterpreted according to the case and the objectives of those involved. The meth
-odological elements must be considered as a dynamic base to be continually enriched by the participants on the basis of the speciici
-ties of their environments and the evolution of these environments in time.
Reference Methodology of
Overruns Causes Mapping
Deinition of a Common Language One of the irst actions that have been conducted during the initiation stage to prac
-ticing the mapping of causes of deadline slippage is to ascertain the existence of a framework which is clear and known to all.
This framework goes through the dei
-nition of a common language. So, the grids of reference that helped reconcile these re
-quirements are as Table 1 and Figure 1.
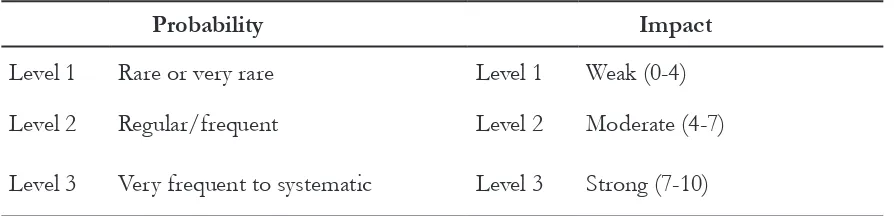
Table 1. Grid of Reference
Probability Impact
Level 1 Rare or very rare Level 1 Weak (0-4)
Level 2 Regular/frequent Level 2 Moderate (4-7)
Level 3 Very frequent to systematic Level 3 Strong (7-10)
Grid A 1: a summary of probability and assess
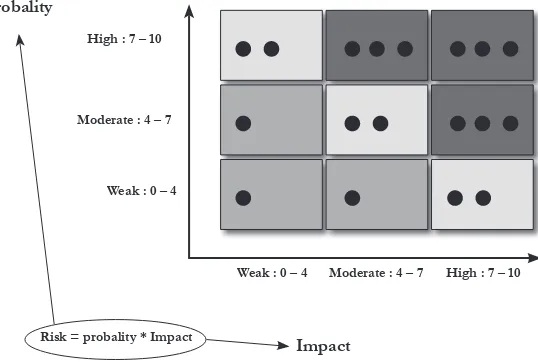
Figure 1. Grid of Reference
Weak : 0 – 4 Weak : 0 – 4
Risk = probality * Impact
Probality
Impact
Moderate : 4 – 7 High : 7 – 10
Moderate : 4 – 7 High : 7 – 10
Grid A 3: a summary of severity evaluation
cally vary from one mapping process to an
-other. Hence, nevertheless a good practice is set between the ranges of 5 to 25.
Ranking of Risks
A number of workshops on ranking of risks have been held (one or several par
-ticipants by category). These workshops con
-stituted the “object” of the process as the participants will express their views on the assessment of each major risk. It should be noted, however, that such a workshop is not based on a “scientiic” or statistical analysis of risks, but on the different participants’ perception of risk. Hence the crucial nature of the “casting” stage previously mentioned. Participants must be clearly reminded that by nature they generally tend to base their evalu
-ation on tangible data and igures. Besides, if for some risks the participants use a “basis” listing all the incidents which have occurred (“recognized” risks) the latter could be taken account of as a need on this level of percep
-tion, notably as far as the criterion of the probability of occurrence is concerned. Conduct of Interviews
It is one of the key-stages of the pro
-cess. The interviews are supposed to bring out the participants’ maximum added-value. The main objective is to collect the partici
-pants’ vision and perception concerning the most critical causes of deadline slippage, the key measures that should be taken or could minimize the risk causes identiied.
Formalization and Validation of the List of Major Risks
Once the interviewing stage inished, an inventory of all the causes of deadline slip
-page has been carried out so that they should be reprocessed them again, synthesized and regrouped them into a family of causes called “grouped” or “major.” This stage is essential as it will help to work on these causes in a structured and more eficient way, while es
-tablishing the link between the practical ield-related issues raised by the participants in the questionnaire or during the interviews, pointing out the consequences of the poten
-Mapping Formalization
Beyond the mapping itself (a graph composed of two axes: impact and prob
-ability) it is always important to analyze the votes by way of statistics (of average impact and probability, variances measuring the scat
-tering of votes on a particular risk/a given criterion, etc.)
The Research Findings
Ranking the Delay Causes
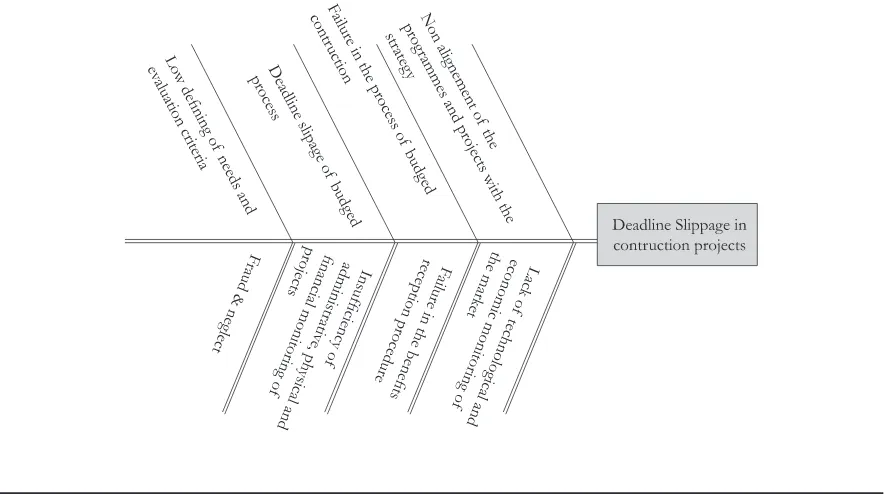
Using the Ishikawa Diagram
The Ishikawa Diagram (Figure 2), also known as the cause-effect diagram, is a tool to present the possible causes of a particu
-lar problem systematically in a graph. These problems are presented on two detailed and different levels in the ish bone diagram. The top case of the diagram contains the presen
-tation of the problem.
Figure 2. The Identiied Risks in the Expenditure Process Can Lead to Deadline Slippage in the Construction Projects
Frequency of Delay Causes
The most frequent causes are related to insuficiency or absence of prior studies and feasibility of the projects , errors made in the initial budget assessment errors arrangement, errors of piloting and coordination in the study phase and during the construction peri
-od, volatility in the architecture and engineer
-ing program (multiple modiication requests) external delay procedures (granting subsidies, issuing construction permits etc.) failure of some participants, working site hazards as mentioned in Table 1.
Severity of Delay Causes
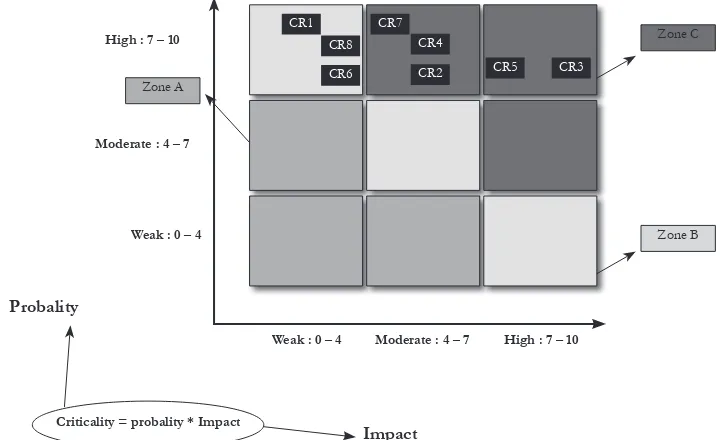
Table 2. Frequency, Impact, Criticality of Causes
No Risk Name Impact Probability Criticality
R1 Non alignment of the programs and projects with the strategy 2.6 8.2 21.32
R2 Failure in the process of budget construction 4.6 7.5 34.5
R3 Deadline slippage of budget process 8.5 8 68
R4 Low deining of needs and evaluation criteria 4.5 8 36
R5 Lack of technological and economic monitoring of the market 7.5 8 60
R6 Failure in the beneits reception procedure 3 7.4 22.2
R7 Insuficiency of administrative, physical and inancial monitoring of projects 4.2 8.5 35.7
R8 Fraud & neglect 3.8 7.8 29.64
Figure 3. Reference of the Criticality Assessment Risk
Weak : 0 – 4 Weak : 0 – 4
Criticality = probality * Impact
Probality
Impact
Moderate : 4 – 7 High : 7 – 10
CR1 CR8
CR7 CR4
CR2 CR5 CR3
Zone C
Zone A
Zone B
CR6
Moderate : 4 – 7 High : 7 – 10
According to the grid reference of the
Elements of Risks Raised
In the Interview, Risk Detail, Causes of Risk, Identiied Incidents and Indicators The elements of risks raised in the interview, risk detail, causes of risk and Identiied inci
-dents are listed in Table 3.
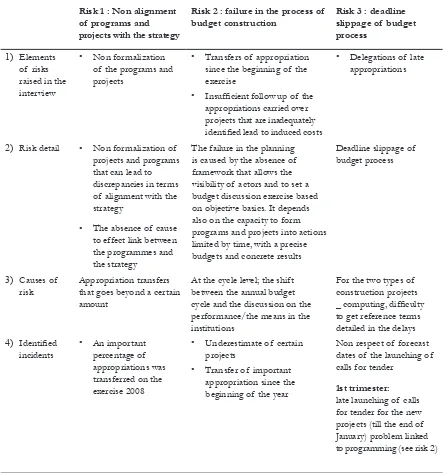
Table 3. Risk Detail, Causes of Risk, Identiied Incidents and Indicators
Risk 1 : Non alignment
slippage of budget process
1) Elements
of risks raised in the interview
• Non formalization of the programs and projects
• Transfers of appropriation since the beginning of the exercise
• Insuficient follow up of the appropriations carried over projects that are inadequately identiied lead to induced costs
• Delegations of late of alignment with the strategy
• The absence of cause to effect link between the programmes and the strategy
The failure in the planning is caused by the absence of framework that allows the visibility of actors and to set a budget discussion exercise based on objective basics. It depends also on the capacity to form programs and projects into actions limited by time, with a precise budgets and concrete results
Deadline slippage of budget process
3) Causes of
risk Appropriation transfers that goes beyond a certain amount
At the cycle level; the shift between the annual budget cycle and the discussion on the performance/the means in the institutions
For the two types of construction projects _ computing, dificulty to get reference terms detailed in the delays
4) Identiied
incidents • An important percentage of appropriations was transferred on the exercise 2008
• Underestimate of certain projects
• Transfer of important appropriation since the beginning of the year
Non respect of forecast dates of the launching of calls for tender
1st trimester:
3 rd trimester:
Late launch of tenders for new projects (late January) Problems
• Abandoned projects rate
• Percentage of projects having discrepancy between the cost estimate and the inal real cost (see risk 7)
• Appropriation rate non delegated at the end of February
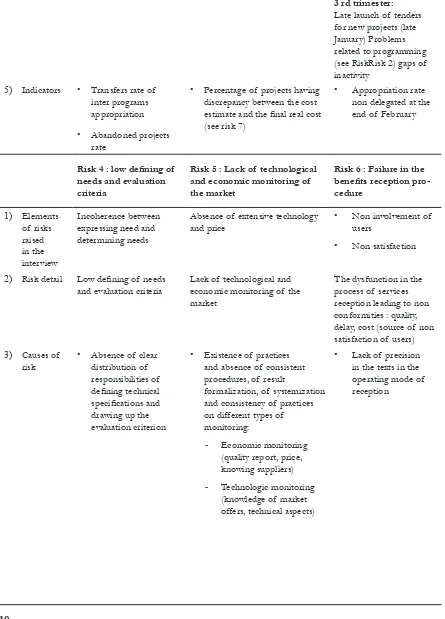
Risk 4 : low deining of needs and evaluation
criteria
Risk 5 : Lack of technological
and economic monitoring of the market
Absence of extensive technology
and price • Non involvement of users
• Non satisfaction
2) Risk detail Low deining of needs
and evaluation criteria Lack of technological and economic monitoring of the market
The dysfunction in the process of services reception leading to non conformities : quality, delay, cost (source of non satisfaction of users)
3) Causes of and absence of consistent procedures, of result
formalization, of systemization and consistency of practices on different types of monitoring:
- Economic monitoring (quality report, price, knowing suppliers) - Technologic monitoring
(knowledge of market offers, technical aspects)
• Lack of precision in the texts in the operating mode of reception
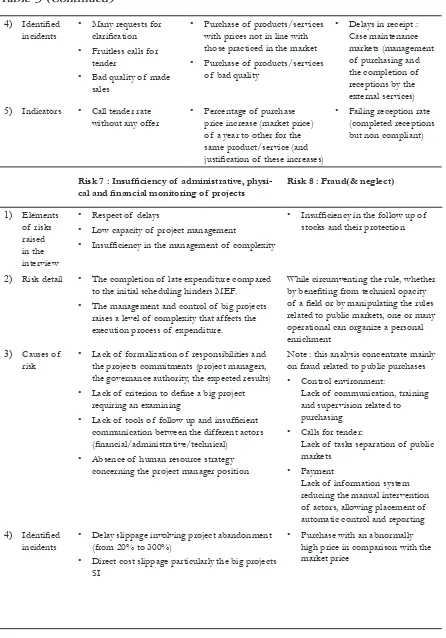
Table 3 (Continued)
4) Identiied
incidents • Many requests for clariication
• Fruitless calls for tender
• Bad quality of made sales
• Purchase of products/services with prices not in line with those practiced in the market
• Purchase of products/services of bad quality
• Delays in receipt : Case maintenance markets (management of purchasing and the completion of receptions by the external services)
5) Indicators • Call tender rate
without any offer • Percentage of purchase price increase (market price) of a year to other for the same product/service (and justiication of these increases)
• Failing reception rate (completed receptions but non compliant)
Risk 7 : Insuficiency of administrative, physi
-cal and inancial monitoring of projects Risk 8 : Fraud(& neglect)
1) Elements
• Low capacity of project management
• Insuficiency in the management of complexity
• Insuficiency in the follow up of stocks and their protection
2) Risk detail • The completion of late expenditure compared
to the initial scheduling hinders MEF.
• The management and control of big projects raises a level of complexity that affects the execution process of expenditure.
While circumventing the rule, whether by beneiting from technical opacity of a ield or by manipulating the rules related to public markets, one or many operational can organize a personal enrichment
3) Causes of
risk • Lack of formalization of responsibilities and the projects commitments (project managers, the governance authority, the expected results)
• Lack of criterion to deine a big project requiring an examining
• Lack of tools of follow up and insuficient communication between the different actors (inancial/administrative/technical)
• Absence of human resource strategy concerning the project manager position
Note : this analysis concentrate mainly on fraud related to public purchases
• Control environment:
Lack of communication, training and supervision related to purchasing
• Calls for tender:
Lack of tasks separation of public markets
• Payment
Lack of information system reducing the manual intervention of actors, allowing placement of automatic control and reporting
4) Identiied
incidents • Delay slippage involving project abandonment (from 20% to 300%)
• Direct cost slippage particularly the big projects SI
Table 3 (Continued)
5) Indicators • The following indicators are to be subject to the
global follow up of big projects (see risk 1)
• the rate for the carryover of appropriations
Renewing rate of suppliers for the calls for tender and purchase orders (risk 5)
Conclusions and Perspectives
In spite of the fact that a number of works have been done in this ield, this is the irst to identify and manage the risks in the expenditure process in order to control the deadline slippage and the costs in the con
-struction project. In fact, a detailed list of risks in the expenditure process is present as follow:
R1 : Non alignment of the programs and projects with the strategy
R2 : Failure in the process of budget con
-struction
R3 : Deadline slippage of budget process R4 : Low deining of needs and evaluation
criteria
R5 : Lack of technological and economic monitoring of the market
R6 : Failure in the beneits reception proce
-dure
R7 : Insuficiency of administrative, physical and inancial monitoring of projects R8 : Fraud & neglect
We can also identify the 40 measures of control and 113 actions to manage the differ
-ent risks as well as the performance indicators that are related to it. Putting in place such a system of internal control, the owner will contribute to the aspects of delay, the costs and quality in the completion of the projects particularly the construction projects.
Measures of Control and
Actions to Reduce the Risks
In the analysis of delay management processes, control measures have been iden
-tiied. These measures involve generally im
-posing the submission of irms to a planning detailing scheduling, task durations and the provided resources. They also involve de
-manding the clients to adopt a monitoring system that is speciic for the management and follow up of practices in order to avoid the mistakes of scheduling as well as of co
-ordination in the study phase and work. This serves also to avoid estimation errors of pro
-visional budget through precautions such as: agreement between ratios and natures of sur
-face, the complete program of technical in
-stallations. In order to assure continued con
-trol, these measures demand the designation of a control ofice; its mission is to check the compliance of beneits to speciications. For controlling the construction hazards, a mea
-sure has been recommended; it involves inte
-grating to the budget a reasonable reserve to absorb additional costs
The different measures and ac
-tions meeting the different major identi
In fact, this internal control system of expenditure process intends to offer to the different stakeholders the reasonable assur
-ance in reaching these objectives all by con
-trolling the set of risks.
The present research allows the pro
-duction of the main deliverables, they are as follow:
s The mapping of risks
s The portfolio of actions and measures ap
-plied to control the risks
s The indicators risk management
However, reaching these objectives de
-termined by this work and the achievement of results in the operational process call for the implication of the set of expenditure ac
-tors in the phase “post-project” related to the implementation of the system
In this respect and taking into account the interest of the system in question in terms of controlling the circuit of expendi
-ture, it has been proposed to institutionalize the roles of the different involving parties, by proceeding for example to the appointment of:
s A steering committee that assumes the ut
-ter responsibility of the in-ternal control sys
-tem of the expenditure process particularly in signing an annual statement
s A coordinator of internal control that ani
-mates the internal control of the expendi
-ture process: assist with the coordination of different players and sharing the good practices between risks monitoring in a way to control the 15 risks and to imple
-ment the actions of internal control.
s Risks monitoring responsible for super
-vising the implementation of progress ac
-tions related to risks that must be assured the monitoring
s Internal control referents that animates
the internal control of the expenditure process in its own Management Center
Other concrete measures can be used to control the risks of expenditure particu
-larly in setting up a committee of discharges; it is by deining a threshold that shall not be exceeded for the sale and by deining a com
-position of members of a reception commit
-tee of offered services
Indeed, the success of the implemen
-tation phase requires an important mobiliza
-tion and an eficient implica-tion of the set of involving parties in the expenditure in order to control the set of identiied risks.
It is worth referring to the actions of change management and the subsequent adoption to the proit of managers by the means of communication activities, of sensi
-tization and training must be planned to pro
-mote the implementation of this framework .
References
Ajanlekoko. J. O. 1987. Controlling cost in the construction industry. Lagos QS Digest 1(1): 8–12. Lagos
Alaghbari, W., M.R.A. Kadir, A. Salim, and Ernawati. 2007. The signiicant factors causing delay of building construction projects. Malaysia. Engineering, Construction and Architectural Management 14 (2):
192- 206.
Al-Barak, A. A. 1993. Causes of contractors_ failures in Saudi Arabia. Master Thesis. CEM Dept., KFUPM.
Dhahran, Saudi Arabia.
Al-Ghaly, M. A. 1995. Delays in the construction of public utility projects in Saudi Arabia. Master Thesis.
CEM Dept., KFUPM, Dhahran, Saudi Arabia.
Assaf, S. A, M. Al-Khalil, M. Al-Hazmi. 1995. Causes of delays in large building construction projects.
ASCE J Manage Eng 11 (2): 45–50.
Al-Momani, A. H. 2000. Construction delay: A quantitative analysis. International Journal of Project Management 18: 51-59.
Assaf, S. A., and S. Al-Hejji. 2006. Causes of delay in large construction projects. International Journal of Project Management 24: 349-357.
Belassi, W., and O. I. Tukel. 1996. A new framework for determining critical success/failure factors in projects. International Journal of Project Management 14 (3): 141-51.
Challal, A., and M. Tkiouat. 2012. Identiication of the causes of deadline slippage in construction projects: State of the art and application. Journal of Service Science and Management 5 (2): 151-159. doi:
10.4236/jssm.2012.52019.
Challal, A., and M. Tkiouat. 2012. Qualitative approach risk period in construction projects. Journal of Financial Risk Management 1: 42-51. doi: 10.4236/jfrm.2012.13008.
Challal, A., and M. Tkiouat. 2012. The design of cost estimating model of construction project: Application and simulation. Open Journal of Accounting 1 (1): 15-26. doi: 10.4236/ojacct.2012.11003.
Chan D. W., and M. M. Kumaraswamy. 1997. A comparative study of causes of time overruns in Hong Kong construction projects. Int J Project Manage 15 (1): 55–63.
El-Razek, M. E. A., H. A. Bassioni, and A. M. Mobarak. 2008. Causes of delay in building construction projects in Egypt. Journal of Construction Engineering and Management 134 (11): 831-841.
Enshassi, A., J. Al-Najjar, and M. Kumaraswamy. 2009. Delays and cost overruns in the construction projects in the Gaza Strip. Journal of Financial Management of Property and Construction 14 (2): 126-151.
Faridi, A. S., and S.M. EL-Sayedgh. 2006. Signiicant factors causing delay in the UAE construction industry. Construction Management and Economics 24: 1167-1176.
Frimponga, Y., J. Oluwoyeb, and L. Crawfordc. 2003. Causes of delay and cost overruns in construction of groundwater projects in a developing countries: Ghana as a case study. International Journal of Project Management 21: 321-326.
Hamidreza. A., S. Khosravi, A. Ghorbanali, M. Borzabadi, and M. Valipour, 2010. Identiication of Causes of Non-excusable Delays of Construction Projects: 42-46. International Conference on E-Business
Management and Economics, Hong Kong, 28-30.
Hatush, Z., and M. Skitmore. 1997. Evaluating contractor prequaliication data: selection criteria and project success factors. Construction Management and Economics 15 (2): 129-47.
Koushk, P. A., A. K. Al-Rashid, and N. Kartam. 2005. Delays and cost increases in the construction of private residential projects in Kuwait. Construction Management and Economics 23: 285-294.
Kaming, P., P. Olomolaiye, G. D. Holt, and F. C. Harris. 1997. Factors inluencing construction time and cost overruns on high-rise projects in Indonesia. Construct Manage Econom;15:83–94.
Kumaraswamy, M, and D. Chan. 1998. Contributors to construction delay. Construct Manage Econom 16 (1):17–29.
Kaliba, C., M. Muya, and K. Mumba. 2009. Cost escalation and schedule delays in road construction projects in Zambia. International Journal of Project Management 27: 522-531.
Lim, C. S., and M. Z. Mohamed. 2000. An exploratory study into recurring construction problems.
International Journal of Project Management 18 (4): 267-73.
Long, N. D., S. Ogunlana, T. Quang, and K. C. Lam. 2004. Large construction projects in developing countries: a case study from Vietnam. International Journal of Project Management 22 (7): 553-61.
Le-Hoai, L., Y. D. Lee, and J. Y. Lee, 2008. Delay and cost overruns in Vietnam large construction projects: A comparison with other selected countries. Journal of Civil Engineering 12 (6): 367-377.
Lo, T. Y., I. W. H. Fung, and K. F. C. Tung. 2006. Construction delays in Hong Kong civil engineering projects. Journal of Construction Engineering and Management 6: 636-649.
Meeampol, S., and S. O. Ogunlana. 2006. Factors affecting cost and time performance on highway construction projects: evidence from Thailand. Journal of Financial Management of Property and Construction 11 (1): 3-20.
Haseeb, M., L. Xinhai, A. Bibi, M.-ud, Dyian, and W. Rabbani. 2011. Causes and effects of delays in large construction projects of Pakistan. Kuwait Chapter of Arabian Journal of Business and Management Review 1 (4): 18.
Noulmanee. A, J. Wachirathamrojn, P. Tantichattanont, and P. Sittivijan. 1999. Internal Causes of Delays in Highway Construction Projects in Thailand. www.ait.c1et.com, July.
Odeyinka, H. and A, Yusif. 1997. The causes and effects of construction delays on completion cost of housing projects in Nigeria. Journal of Financial Management of Property and Construction 2 (3): 31–44.
Ogunlana, S. O., K. Promkuntong, and V. Jearkjirm. 1996. Construction delays in a fast-growing economy: Comparing Thailand with other economies. International Journal of Project Management 14 (1): 37-45.
Elsevier.
Odeh, A. M., and H. T. Battaineh. 2002. Causes of construction delay: Traditional contracts. International Journal of Project Management 20: 67-73.
Sambasivan, M., and Y. W. Soon. 2007. Causes and effects of delays in Malaysian construction industry.
International Journal of Project Management 25: 517–526.
Sweis, G., R. Sweis, A. A. Hammad, and A. Shboul. 2008. Delays in construction projects: The case of Jordan. International Journal of Project Management 26: 665-674.
Tumi, S. A. H., A. Omran, and A. H. K. Pakir. 2009. Causes of Delay in Construction Industry in Libya.
Toor. S. U. R., and S. O. Ogunlana. 2008. Problems causing delay in major construction projects in Thailand. Construction Management and Economics 26: 395–408.
Towhid, P. and I. Amiruddin. 2011. Signiicant factors causing and effects of delay in Iranian construction projects. Australian Journal of Basic and Applied Sciences 5 (7): 450-456.
Ubaid, A. G. 1991. Factors affecting contractor performance. Master Thesis. CEM Dept., KFUPM,
Dhahran, Saudi Arabia.
Walker, D. H. T. 1995. An investigation into construction time performance. Construction Management and Economics 13 (3): 263-74.
Walker, D. H. T. 1996. The contribution of the construction management team to good construction time performance – an Australian experience. Journal of Construction Procurement 2 (2): 4-18.
Zaneldin, E. K. 2006. Construction claims in United Arab Emirates: Types, causes, and frequency.
Appendix 1. Measures of Control and Actions to Reduce the Risk R1
Measures Actions
R1 : Non alignment of the programs and projects with the strategy
Put in place a strategic planning intending (based on action plan, guidance note and developing analytic review) intending to synchronise the budgetary and strategic schedules
R1.A1 – write and publish a note signed by the Minister/ the Secretary General demanding a real dialogue of harmonized management in the MEF
Create an instance for the resources Directors + divisions of management control and having a vocation to give its opinion on coherence/ compliance of the budgetary orientations with the strategy
R1.B1 – create a consultative committee of projects plus a budgetary allocation that can be a binding force for the ive management centers
Structure the control function
Appendix 2. Measures of Control and Actions to Reduce the Risk R2
Measures Actions
R2 : Failure in the process of budget construction
Put in place a plan allowing to appreciate the project in comparison to its justiication by a precise and reliable analysis
R2.A1 – Deine the main principles to be followed in order to make budgetary estimates based on common references
R2.A2 – Deine a model of fact sheets of budgetary construction
Learn from the experience of the budgetary execution of the exercise n-1
R2.B1 (QW) – Deine the analysis to be made in the analytical review taken on the exercise clos N-1
R2.B2 (QW) –Identify the actors and the timing of analytical reviews
R2.B3 (QW) – Deine the alert thresholds on the transfers and reports
Anticipate the budgetary
Integrate the project planning
on the medium term R2.D1 (QW) – Include the CDMT in the unique, common and annual schedule of management (see R1.A4) R2.D2 –Deine the procedure of contracting between the sub-authorizing oficer and the DAAG in the process of budget construction
Appendix 3. Measures of Control and Actions to Reduce the Risk R3
Measures Actions
R3 : Deadline slippage of budget process
The requests of delegations coming from the
sub-authorizing oficer must reach the authorizing oficer at the start of January
R3.A1 (QW) – Add an availability on the deadline of the reception of the requests of delegation to the note of the minister on the delay of 30 June
R3.A2 – Write and disseminate a note limiting the transfers to a threshold to deine according to the planned actions The requests of delegations
coming from sub-authorizing oficer no later than January- provided that the risk 2 is to be controlled
R3.A3 – Offer the necessary justiications for all the exceptional requests of delegation compared to the programming
Delegation by the authorizing oficers to sub-authorizing oficers to the level of 80 percent on 15 February
R3.B1 – Identify the motives of delays in the clearance of accountancy in the exercise N-1 and identify the actions particularly at the level of information system to allow the close of the budgetary exercise plus the late of 30 January Fixation by the minister of the
delays linked to the production of detailed reference terms
Systemize the evaluation of delays of budgetary process and its execution and to put in place the adjustment actions
R3.D1 (QW) - Identify reporting states/indicators that must be produced by the information system on the key stages of the process
Systemize the reporting and the budgetary follow up of available appropriations
R3.E1 (QW) – Propose the speciications SI of ields allowing to qualify the available types of appropriations and to restrict the use of the following appropriations
Appendix 4. Measures of Control and Actions to Reduce the Risk R4
Measures Actions
R4 : low deining of needs and evaluation criteria
Develop a deinition guide of the need (facilitate and harmonize the practices) Database by the type of the expenditure
R4.A1 – Identify the key articles making the link between the technical and administrative aspects and produce a reference document on the articles for each type of beneit
Professionalize the buyers/
Promote the expertise and multidisciplinary exchange between actors and promote forum exchange
R4.C1 – Create a body in charge of data base in the exchange committee and of coordination that centralizes the set of observations of monitoring that communicates periodically the key lessons to the management centers
Harmonies/clarify the
evaluation of recipients R4.D1 –Identify the main evaluation criteria by beneit type, test them and produce a reference document available to the set of management centers
Appendix 5. Measures of Control and Actions to Reduce the Risk R5
Measures Actions
R5 : Lack of technological and economic monitoring of the market
Put in place the
communication actions and exchange of good practices (buyers forum)
R5.A1 – Organize a dialogue space and work between actors in the purchase process
R5.A2 – Identify the exchange opportunities of good practices purchase of external actors
Create a database of the 3 P
(Price, Product, Provider) R5.B1 – Deine a centralized suppliers data base dealing with the internal evaluation of service providers
Promote judicial monitoring R5.C1 – Deine the modalities of judicial monitoring allowing to identify and communicate the regulatory changes
Clarify the roles and respon-sibilities of each (separation of tasks)
Recruit/train the public buyers R5.E1 – Target the training actions destined to public buyers in order to reinforce the competencies
R5.E2 – Plan a communication action that valorize the purchase function and seems to attract the competencies and to present the function to other actors
Experiment a monitoring unit having the vocation to be deployed
R5.F1 (QW) – Deine the attributions of a monitoring team
Getting ideas on the evaluation model of the performance linked to purchases
R5.G1 – Identify the evaluation indicators of purchase performance
Integrate the feedback in the
process of suppliers selection R5.H1 – Organize an exchange meeting with the suppliers allowing to make an annual balance of provisional program of purchases
Appendix 6. Measures of Control and Actions to Reduce the Risk R6
Measures Actions
Better organize/structure the reception of beneits: role clariication/involvement of manager, of buyer, com-petent head of service, separation of tasks between command/reception/payment, rationalization of the work load
R6.A1 (QW) - Set up a unique and common operating mode of reception by major categories of beneits R6.A2 - Set up an evaluation procedure of enterprises after the beneit
Clarify/explain the terms/ conditions of receipt (Com-mission of receipt: role, composition, scope/nature of purchases.)
R6.B1 (QW) – Identify the reception committees types according to the categories of beneits and the importance of the project (failing case)
Enrich the clauses dealing with
the reception in the CCAG R6.C1 – Set up a CCAG for each type of beneits with a clause indicating the major principles to observe in the reception
Appendix 7. Measures of Control and Actions to Reduce the Risk R7
Measures Actions
R7 : Insuficiency of administrative, physical and inancial monitoring of projects
Deine portfolio of projects to be put under observation (sum, complexity, Deine a “proile”/portfolio of projects to be under observation (amount,, complexity, value added)
R7.A1 (QW) – Deine the criterion of projects classiication to identify major projects
Synchronies/integrate strongly
the different actors R7.B1 (QW) – Deine major categories of projects and the stages of each category in order to identify the grounds of coordination between actors
Create a function ‘project manager’ dedicated and assuring his professionalism (training, awareness)
R7.C1 (QW) – Write a ile of project manager and identify potential ground of manger project
Promote the necessary tools to projects steering (train the project managers to its use): scoreboard, follow up, supervision
R7.D1 – Design a scoreboard that can be adapted, it must be communicated with actors and prove the key indicators
Structure/harmonize the principal project governance (on the basis of good
practices, steering committee, follow up committee,
contractual committees)
R7.E1 (QW) – Deine an organization type of governance project
R7.E2 – Write a chart of project management
Appendix 8. Measures of Control and Actions to Reduce the Risk R8
Measures Actions
R8 : Fraud & neglect
Assure an environment control to ight against fraud and neglect
R8.A1– Write a deontological guide of expenditure lows signed by the Directors of 5 management centers
R8.A2– Organize a training action on the fraud involving the directors of Resources of expenditure process
Determine and formalize the major points of vulnerability of the expenditure in
comparison to the risk of fraud
Plan margins of discretion of
the actors of the expenditure R8.C2– identify the measures of backing the discretionary margins, according to two possible logics: 1 – Set up reporting making actors responsible 2 – Deinition and communication of detailed procedures limiting the power of actors
Organize the sensitive
functions R8.D1 (QW) – Inventory the sensible functions of expenditure process Sensibilise the actors to fraud
mechanisms (internal and external) speciic to each job of the expenditure
R8.E1– Organize a training on the fraud (internal and external) to operational destination of expenditure low
Put in place the process of professional alert (“Whistle-blowing”)
R8.F1– Deine the concerned perimeters by the professional alerts
Better deine the role of the internal audit as an evaluator of internal control unit related to combat fraud (preventive, detective)
Appendix 9. Indicators of Performance
Name of the Indicator Formula Risks Covered
by the Indicator
Transfer rate of inter-pro
-gram appropriation (BI*)
in 2011
The total transfer of inter-program appro
-priation (BI) in 2011/the total appropriated amount BI in 2011
R1, R2
The total appropriation
carried over The amount of appropriation carried over (2010/2011)/the total appropriated amount 2011 (BI) in 2011
R1, R7
Transfer rate of intra-pro
-gram BI appropriation The total transfer of intra-program appropriation(BI) in 2011/the total appro
-priated amount BI in 2011 The total of non assigned
appropriations
1st Trimester BI
The amount of non assigned appropriations in 30 March 2011/the total appropriations to delegate in 2011
2nd Trimester BI
The amount of non assigned appropriations in 30 March 2011/the total appropriations to delegate in 2011
Engagement rate The Total appropriation committed (BI)/
the Total deinitive appropriations (BI) R2, R3, R7
The average delay between the attribution and the starting of the service in
2011
The average delay between the display of results of AO attributed and the starting of work date OS in 2011
R3, R2, R5, R7,
Unsuccessful tendering
procedures Number of Unsuccessful tendering proce
-dures 2011/No. Number of Unsuccessful tendering procedures showed 2011
R4, R5
Renewal suppliers rate in
the purchasing order Number of new suppliers (2011/2010)/the total supplier(2011) R5, R8 The rate of emission (BI)
in 31/12/2011 The amount of emissions (BI) in 31/12/ 2011/the total Total deinitive appropria
-tions
R7,R6
The execution stops rate
of markets Accumulated delay of stops/the total con
-tractual delay of the approved markets in
2011
R7, R6, R8