The day of the week effect on Islamic stock market
returns: evidence from Dow Jones Islamic Market Index
Ali Kafou
∗and Ahmed Chakir
♦Abstract:
The purpose of this paper is to explore the day of the week effect on Islamic stock market returns using the Dow Jones Islamic Market Index as a proxy. The study covers the period from May 25, 1999 to November 28, 2013 divided into four subperiods. We first perform the mean-comparison tests using both t-test and the Wilcoxon signed-rank test. Then, two models were estimated using both the raw returns and the market adjusted returns to avoid any bias in results. The first model is estimated using the General Method of Moments (GMM) and the second using GARCH specification of variance. With GARCH model, we found a strong evidence of significant effects. Still, the expected return was not enough large to outweigh the transaction costs and thus we cannot exploit those effects to build a profitable trading strategy. Using the market adjusted returns only changes the qualitative aspect of the effects while they still persist. During the Subprime crisis, no day effect was found; returns become random and unpredictable.
Keywords: Islamic equity indices,Day of the week effect, Dow Jones Islamic index.
1.
Introduction
Assets in the Islamic finance industry have grown 500% in the last five years, reaching $1.3 trillion in 2011 (Ajmi et al., 2014) and expected to reach $1.8 trillion by 2016 (Walkshäusl and Lobe, 2012b). This growth is due to development of gulf countries which continue to advance rapidly with accumulation of oil wealth (Ho et al., 2013). On the other hand, the relaxation by scholars of the sharia1 constraints on interest-based activities led to the growth of Islamic mutual fund industry (Binmahfouz, 2012), one of the fastest rising segments within the Islamic financial system (Hassan and Girard, 2010). Abul
∗ Ali Kafou is a PhD candidate at the National School of Trade and Management, Agadir- Morocco, and a
member of the Laboratory of Research in Entrepreneurship Finance and Audit. Corresponding author, E-mail: [email protected].
♦
Ahmed Chakir is a professor of finance at the National School of Trade and Management, Agadir- Morocco, and the director of the Laboratory of Research in Entrepreneurship Finance and Audit. E-mail: [email protected].
1
The Islamic law governing all aspects of a Muslim's life.
26 Journal of Islamic Economics, Banking and Finance, Vol. 11 No. 3, July-Sept. 2015
(2014) argued that most of the growth of the Islamic finance industry originates from non-Muslim countries. Among the aspects of this growth was the launch of Islamic stock indices (ISIs). Indeed, acknowledged Index providers (e.g., Dow Jones, FTSE, MSCI and S&P) launched their Islamic version to track the performance of sharia compliant stocks. The need for equity markets is higher in Islamic finance due to the prohibition of interest (Iqbal and Molyneux, 2005). Hence the extreme importance of those indices especially for Islamic mutual fund industry; ISIs offer a reliable and independent assessment of their performance and contributed significantly to their growth over the last decade. Besides, individual Investors seeking to invest according to sharia’s precepts will now have a benchmark helping them to make superior decisions. In addition, the number of liquidated actively managed Islamic funds outpaced the number of newly launched funds since 2008. Investors have begun shifting their assets from actively managed mutual funds to passive index-based investment (Walkshäusl and Lobe, 2012a; 2012b). Within this context, it is important for investors that are guided by their religious convictions to know about patterns in stock market returns to time their investment and to develop profitable trading strategies.
In this paper we investigate the day of the week effect on Islamic stock market returns. First, we perform the mean-comparison tests. Then, we estimate two models; the first by the general method of moments (GMM) and the second using GARCH specification. The remainder of this paper is organized into the following sections. Section 2 will give a brief description of Dow Jones Islamic Market Index, section 3 outlines the previous literature on Islamic equity investing and calendar anomalies. Section 4 describes data and methodology of the present study. Results are detailed in section 5 while section 6 summarizes and concludes the study.
2.
The Dow Jones Islamic Market Index
Islamic stock indices are a subset of the conventional ones; starting with all companies listed on a stock market, we apply a set of screens to remove those that are not sharia
compliant. These indices have an independent sharia supervisory board in charge of setting and applying the screening rules.
To be part of DJIMI, companies have to pass two sets of screens. The first excludes the companies whose main business is alcohol, tobacco, pork related products, weapons, entertainment (e.g., gambling, hotels and pornography) and conventional finance (e.g., banking and insurance). The second set of screens is based on financial ratios. Thus, companies passing the first screen must have their total debt, cash plus interest bearing securities and accounts receivables divided by trailing 24 months average market capitalization not exceeding 33% to be definitively accepted in the index. Note that 75% of companies fail to meet the screening criteria (Hakim and Rashidian, 2002). The DJIMI is a low-debt, non-financial and social-ethical index in the broad sense (ibid.). According to the index’s fact sheet2, DJIMI was first calculated on May 24, 1999; it covers 55
2
Data of September 2013.
The Day of the Week Effect on Islamic Stock Market Returns: Evidence from Dow... 27
countries around the globe and includes 10 sectors. United States represent 57.58% of the total index allocation followed by the United Kingdom with 7.33%. Companies from technology and healthcare sector are prevailing in DJIMI composition with respectively 20.21% and 19.40% of the total allocation.
It is worth noting that the screening rules are not the same for all ISIs around the world; they differ substantially from one another especially when it comes to financial screening (see Derigs and Marzban, 2008). Indeed, some sharia boards use total assets instead of market capitalization for ratios’ calculation (e.g., MSCI and FTSE) while other indices do not apply any ratio based screening (e.g., SEC of Malaysia). Thus, even when the same universe (i.e., the conventional index) is used, the variety of screening rules may lead to different compositions of the corresponding Islamic index. According to Rahman et al. (2010), only 35.04% of listed companies in KLSESI (the Islamic index of KLCI) fulfill the DJIMI criteria. Generally, many of the industry participants consider Dow Jones as the most conservative sharia screener (Alqahtani, 2009).
Sadeghi (2008) explored the impact of the introduction of an Islamic Index in the Malaysian context on sharia compliant stocks. He found that the ISI had a positive impact on financial performance and liquidity of sharia compliant stocks within the KLSESI. Febrian et al. (2013) studied the market response to composition change of Islamic index. Results showed that the market reacts positively to stocks newly included in the Islamic index leading to the improvement of their returns and vice versa.
As many published studies (e.g., Hussein, 2005; Abul et al., 2005; Hussein and Omran, 2005; Hassan and Girard 2010; Abul, 2014) we use DJIMI as a proxy of the Islamic stock market because of its prominence and global coverage.
3.
Literature Review:
Despite the unprecedented growth of Islamic finance over the last decade, the academic studies on Islamic investing are still scarce (Hussein, 2004 and 2005; Guyot, 2011; Lobe et al., 2012). The few empirical studies on this issue take the form of performance comparison between Islamic funds or Islamic indices and their conventional counterparts. The nature of Islamic funds inhibits our ability to isolate the impact of Islamic screening as interpretation of sharia rules by the advisory boards and other factors such as management fees and manager’s ability to make appropriate decisions (Abul et al., 2005). To draw strong conclusions, it is more suitable to use ISIs.
28 Journal of Islamic Economics, Banking and Finance, Vol. 11 No. 3, July-Sept. 2015
Another approach used to study the Islamic indices’ performance is reasoning through market cycles and geographical localization. Thus, Zamri and Haslindar (2002), Hussein (2004; 20053), Hussein and Omran (2005) and Girard and Hassan (2010) found that ISIs underperform their conventional counterpart during the bear market and outperform them during the bull market. The ISIs underperforming conventional ones during the bear market was an agreed characteristic of ISIs that authors explained by the exclusion of liquor companies (Hussein, 2004) and the event of September 11th (Hussein and Omran, 2005). The subprime crisis was an inflection point of this belief, the ISIs performed better than conventional indices (Lobe et al., 2012; Ho et al., 2013). Lobe et al. (2012) argued that “Islamic screens might not affect unconditional performance through the cycle, but might well affect performance conditional on the cycle. However, it is hard to tell ex ante [...]”. The fact that ISIs outperformed in the recent financial crisis may be explained by the exclusion of financial sector but this outperformance cannot be guaranteed in the next downturn. Adding a spatial dimension to the analysis, Walkshäusl and Lobe (2012b) found that ISIs outpaced their conventional counterparts in the developed market but the inverse is true for emerging markets.
The calendar anomalies are the indiscretion or unswerving pattern that cannot be entrenched by the presented theories of Finance (Iqbal et al., 2013). Studying calendar anomalies aims to detect abnormally high or low returns on certain times in the year. This phenomenon has been referred to in literature as the day of the week (usually returns are significantly higher on Fridays and lower on Mondays), month of the year (usually January returns are relatively higher than other months), holidays effect (higher returns on the days before vacations). The day of the week effect anomaly investigations are particularly interesting for the traders in the securities market. The successful forecasting of the returns increase or decrease and the implied risk of trading decisions along the days of the week could lead to formation of profitable trading strategy (Raja et al., 2011). Making short-term profits is appealing of investor, speculators and arbitrageurs. In the futures market, for example, the volume of trading in a day may outpace the open interest at the end of this day for a contract what shows the large number of day trades4 (see Hull, 2009). Studying the calendar anomalies can be considered under the broader theme of stock market efficiency stipulating that prices fully reflect all available information on a particular stock. Thus, making the prediction of returns based on past prices is impossible. Nevertheless, stock prices can be predicted because daily, weekly and monthly returns on stocks exhibit discernible patterns. Investors use technical analysis to predict the direction of price changes of individual stocks in short-term and they search the basis of seasonal trends to build profitable trading strategies (Iqbal et al., 2013). Still, there is very little evidence that they are able to do so (Hull, 2009). The informational efficiency is one of the preconditions to accept contracts entered into under the Islamic stock markets. Indeed,
3 Note that in this study, during the second bull market period, ISIs underperformed their conventional benchmarks.
4
Day trades are trades where a position is opened and closed out within the same day.
The Day of the Week Effect on Islamic Stock Market Returns: Evidence from Dow... 29
in inefficient markets, informed traders can make profits at the detriment of people who are uninitiated to trading because of the information asymmetry which leads to Jahl that constitutes an infraction to the Islamic legal contractual framework.
The day of the week effect have been widely studied for the conventional markets covering equity, foreign exchange, and the T-bill markets. The day of the week was investigated in US stock market by French (1980) using the returns of S&P 500 for the period from 1953 to 1977 with five subperiods. The results showed that returns from Monday were significantly negative for each of the five subperiods and lower than the average return for any other day. Gibbons and Hess (1981) studied the same effect using data from the S&P 500 and weighted portfolios constructed by the Center for Research in Security Prices (CRSP). Their study covers the period from July 2, 1962 to December 28, 1978 divided into seven shorter periods. Their results corroborated those of French (1980); a strong evidence of Monday effect was found. Another important result of the study is that even when using the market adjusted returns, the hypothesis of no day effect fails to stand. Kiymaz and Berument (2003)5 studied the day of the week effect for major stock market indices (i.e., Canada, Germany, Japan, United Kingdom and United States) for the period of 1988 through 2002. Again, the estimated coefficients of the Mondays for Japan, the United Kingdom and Canada were negative and statistically significant. While all coefficients for Germany and United States are statistically insignificant. From previous studies, we can conclude that Monday effect is the most documented effect on returns and this is not inherent to US equity market. Monday effect is particularly intriguing because it defeats both the calendar time and trading time hypothesis of returns’ generation process (see French, 1980).
The calendar anomalies in the ISIs have been investigated by Hassan (2000) as a part of Islamic stock market efficiency for the period from January 1996 to December 2000. He found no evidence of the fiscal year, turn of the year and the month of the year effects in the DJIMI. Al-Hajieh et al. (2011) studied the impact of Ramadan on Islamic Middle Eastern markets during the period from 1992 to 2007. They found strong evidence of significant and positive calendar effects. Raja et al. (2011) studied the day of the week effect on Malaysian sharia compliant stock market using three indices namely the KLSI for the period from August 19, 1999 to November 2, 2007, the FBM Emas Shariah between January 22, 2007 and September 29, 2008 and finally FBM Hijrah Shariah for the period ranging between May 21, 2007 and September 19, 2008. Using a standard OLS method, a dynamic model with dummy variables indicating the days of the week was estimated. The findings suggested the presence of Monday and Friday effects in the KLSI while no day of the week effect was found for both FBM Emas Shariah and FBM Hijrah Shariah. Nevertheless, a standard OLS method is not robust to the large evidence of heteroskesdasticity and the time dependence in stock returns, especially for studies conducted during the crisis periods. Besides, when lagged values of independent variable
5
The main objective of the paper was to explore the day of the week effect on stock market volatility and volume not on returns.
30 Journal of Islamic Economics, Banking and Finance, Vol. 11 No. 3, July-Sept. 2015
are used in the model, the serial correlation in the error term will cause all estimates from linear regression to be inconsistent (DeFusco et al., 2004).
Many hypotheses tried to explain the daily anomalies in returns especially the Monday effect. One obvious explanation of this effect is that the information released over the weekend tends to be unfavorable; firm fearing the panic selling when bad news is announced, may delay the announcement until the weekend, allowing more time for the information to be digested. Nevertheless, even if this behavior is possible, it would not cause systematically negative stock returns in an efficient market. Instead, Investors would come to expect the release of unfavorable information on weekends and they would discount stock prices appropriately throughout the week (French, 1980). The settlement effect is also one of the competing conjectures to explain the Monday effect. According to this conjecture, the transactions’ settlement accruing several business days after the quote or transaction date makes observed quotations forward prices not spot ones. Thus, these forward prices are equal to the spot prices grossed up by the risk free rate for the period of settlement that is calculated in term of business days. Thus, any settlement period that are not a multiple of the number of business days requisite for a settlement in a marketplace will introduce a day of the week effect (see Gibbons and Hess, 1981; Iqbal et al., 2013). Gibbons and Hess (1981) found that settlement period hypothesis doesn’t explain the Monday effect they recorded.
To the authors’ best knowledge, the day of the week effect has been studied once for Islamic market indices6, and never using a global index with a high coverage such as DJIMI. Thus, this study proposes to fill the gap.
4.
Data and Methodology:
4.1.data
Our data consist of the daily closing price of Dow Jones Islamic Market Index from May 25, 1999 to November 28, 2013 (3775 data points). We define in our sample four subperiods7. Two of them are identified to be crisis periods. Following Ho et al. (2013) The first subperiod is from January 2000 to December 2002 that retraces the returns’ dynamic during the Dotcom crisis; a crisis that was worsened by the September 11th attacks (775 data points). The second subperiod is from January 2003 to November 2007 (1279 data points). The third subperiod is from December 2007 to June 2009 (412 data points) representing the subprime crisis8. Finally, the post subprime crisis period ranging from July 2009 to the end of our sample (1152 data points). The sample was divided into many subperiods to see how the day of the week effect changes through the market cycles. Table 1 reports the descriptive statistics of our sample.The return (Rt) is calculated as the
first difference in the natural logarithm of the index level.
6
Note that the majority of stock markets located in Islamic countries follow the western style. Thus, studies on these indices are not representative of the Islamic stock market.
7 Note that the period from May 25, 1999 to December 31, 1999 does not belong to any of the four subperiods (157 data points).
8
According to the National Bureau of Economic Research.
The Day of the Week Effect on Islamic Stock Market Returns: Evidence from Dow... 31
4.2.Models and estimation:
The usual model used to study the day of the week effect is given by:
t
large evidence of heteroskesdasticity and the time dependence in stock returns, we use Generalized Method of Moments (GMM) technique to estimate this model. Because we have no reason to believe that correlation between dummies and the error term is nonzero, we assume that they are exogenous:
E
(
x
tε
t)
=
0
(3)
Note that
x
t is a vector of regressors. Thus, the orthogonality condition of our model isgiven by:
W
is symmetric positive definite matrix, known as weight matrix. In our case the modelis “just identified9”, if we apply the GMM estimator, we will obtain the same estimate β∧ regardless of our choice of
W
T. Another problem for the model’s estimation is the“dummy variable trap”. So to avoid perfect collinearity problem, we drop the intercept from the equation (2).
Besides the first model, Following Kiymaz and Berument (2003), we consider a second model defined by:
9
The number of moment conditions is equal to the number of regressors.
32 Journal of Islamic Economics, Banking and Finance, Vol. 11 No. 3, July-Sept. 2015
The lagged values of return are added here to overcome the problem of autocorrelation10. Note that autocorrelation is not a problem for parameter estimation because the GARCH estimation is done using maximum likelihood (ML) that is consistent and robust with respect to serial correlation (Gourierou et al., 1985 and Levine, 1983). Nevertheless, as explained by Cosimano and Jansen (1988), if the residuals are autocorrelated, ARCH-LM tests would suggest the presence of heteroskedasticity in the residual term even if the residuals were homoskedastic. The lag length (n) will be determined using Schwarz criterion. GARCH (1,1) is used to allow the variance of errors to be time dependent. We used both GMM and GARCH because the study is conducted through long periods as well as shorter periods with high volatility (i.e., crisis periods) suggesting the presence of volatility clusters that the GARCH is better designed to model. Note that when a long span of data is used, a higher order of GARCH may be needed (Engle, 2001). Thus, the GARCH’s goodness of fit will be discussed below.
In this study, for accuracy purposes, we consider only 1% and 5% levels to judge the
statistical significance of a parameter.
5.
Empirical Results:
5.1.
Descriptive statistics :
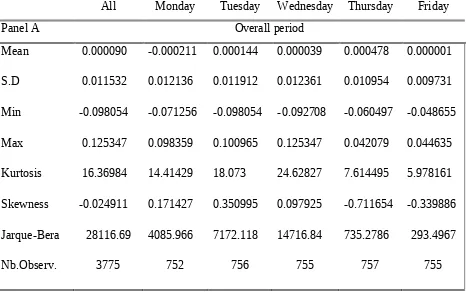
Table 1 reports the descriptive statistics and the Jarque–Bera statistic for the overall period (Panel A) and for the four considered subperiods (Panels B, C, D, and E). Panel A of table 1 displays summary statistics for the overall period. The average annual11 yield of the DJIMI is about 2.27% with a standard deviation of 18.31% per annum. The worst return of -9.80% occurred on Tuesday, during the Dotcom crisis period (see Panel B) and the highest return was 12.53% that occurred on Wednesday (it was also during the Dotcom crisis). The Kurtosis greater than 3 and the Skewness near zero suggest fat tailed and almost symmetric distribution of returns. The hypothesis of normality can be rejected at the 1% level using the Jarque-Bera test for all and for every single day. During the overall period, the average return is positive for all and every day excepton Mondays suggesting the presence of well-known Monday effect. To test whether the difference in means is statistically significant, we perform both t-test and the Wilcoxon signed-rank test to ensure
10 it is noteworthy that lagged values of independent variable are also used in models to accounts for partial adjustment of behavior over time, to account for particular factors including exogenous shocks and accounting for the persistent effects of explanatory variables in the past (Wawro, 2002).
11
We assume 252 trading days in the year.
The Day of the Week Effect on Islamic Stock Market Returns: Evidence from Dow... 33
the robustness of results because the former is more powerful when the sample comes from a normally distributed population but the latter is most reliable if returns are not normally distributed. Panel A of table 2 summarizes the results of tests.
Panels B to E of table 1 show the results of the four subperiods. During the crisis periods, the average annual return of DJIMI was negative; - 21.64% and - 24.64% respectively for the Dotcom and the subprime crisis. As expected, crises had a drastic effect on returns volatility as measured by the standard deviation. During the Dotcom crisis, this volatility was about 23% (26% greater than the overall period) while it jumped to 30.14% during the subprime crisis (64% greater than the standard deviation of the entire sample) confirming its reputation as one of the most severe crisis since the great depression. These statistics show that the DJIMI is not isolated from shocks and it was also impacted by the financial crises. Thus, the Islamic finance has not escaped the recent financial crisis. The two remaining subperiods considered as normal were characterized by a positive annual return of about 14%. The standard deviation was 11.32% during post Dotcom crisis and 4.23 percentagepoints greater for the post Subprime crisis. As for the overall period, the distribution of returns is fat tailed (except for the Post subprime period) and almost symmetric. The normality can be rejected at the 1% level. This led us to use the t-student distribution instead of the normal one in the GARCH estimation. Again, we perform the mean-comparison tests whose results are reported in Panels B to E of table 2.
Table 1
: Summary statistics
All
Monday
Tuesday
Wednesday
Thursday
Friday
Panel A
Overall period
Mean
0.000090
-0.000211
0.000144
0.000039
0.000478
0.000001
S.D
0.011532
0.012136
0.011912
0.012361
0.010954
0.009731
Min
-0.098054
-0.071256
-0.098054
-0.092708
-0.060497 -0.048655
Max
0.125347
0.098359
0.100965
0.125347
0.042079
0.044635
Kurtosis
16.36984
14.41429
18.073
24.62827
7.614495
5.978161
Skewness
-0.024911
0.171427
0.350995
0.097925
-0.711654 -0.339886
Jarque-Bera
Nb.Observ.
28116.69
3775
4085.966
752
7172.118
756
14716.84
755
735.2786
757
293.4967
34 Journal of Islamic Economics, Banking and Finance, Vol. 11 No. 3, July-Sept. 2015
Panel B
Dot-com crisis period
Mean
-0,000859
-0,001139 -0,001438 -0,001106 0,000852 -0,001460S.D
0,014494
0,012108
0,016818
0,017827
0,012060
0,012550
Min
-0,098054
-0,036915
-0,098054
-0,092708 -0,032839 -0,042936
Max
0,125347
0,044642
0,100964
0,125347
0,040961
0,034607
Kurtosis
14,429739
1,549569
14,53746
19,700018
0,542052
0,860755
Skewness
0,644069
0,124843
0,344902
1,519631
0,174724 -0,225456
Jarque-Bera
6683.582
13.98663
1292.672
2397.770
2.300511
2397.770
Nb.Observ.
775
153
157
155
155
155
Panel C
Post dot-com crisis period
Mean
0,000549
0,000365
0,000680
0,000557
0,000711
0,000433
S.D
0,007131
0,007467
0,007040
0,007323
0,007243
0,006605
Min
-0,029272
-0,027075
-0,029272
-0,020742 -0,021134 -0,020037
Max
0,026832
0,026059
0,021619
0,020575
0,026832
0,016760
Kurtosis
1,014065
1,680261
1,105388
0,245460
1,373129
0,418376
Skewness
-0,209388
-0,502154
-0,248449
-0,116121
0,097652 -0,277813
Jarque-Bera
63.19478
38.61496
14.53972
1.067760
19.15541
4.871338
Nb.Observ.
1279
255
255
255
257
257
Panel D
Subprime crisis period
The Day of the Week Effect on Islamic Stock Market Returns: Evidence from Dow... 35
5.2.Mean-comparison tests
The next step is to perform a comparison between the means of daily observed returns. Thus, every day is compared with the remaining days of the week. Table 2 summarizes
S.D
0.018986
0.024770
0.018320
0.018833
0.017169
0.014612
Min
-0.084247
-0.071256
-0.038498
-0.084247 -0.060497 -0.048655
Max
0.098359
0.098359
0.076318
0.033013
0.042079
0.044635
Kurtosis
7.485411
6.669537
5.856887
7.853014
6.024122
4.926023
Skewness
-0.151200
0.535121
0.795387
-1.765231 -1.040100 -0.043893
Jarque-Bera
346.9331
50.38684
36.66272
121.5027
45.49253
12.69972
Nb.Observ.
412
83
83
82
82
82
Panel E
Post subprime crisis period
Mean
0,000553
0,000291
0,000854
0,000450
0,000765
0,000404
S.D
0,009890
0,010664
0,009360
0,009641
0,011272
0,008309
Min
-0,052941
-0,052941
-0,030749
-0,029310 -0,048188 -0,027239
Max
0,040942
0,040942
0,029024
0,037494
0,036196
0,031314
Kurtosis
2,924085
3,906191
0,906714
1,479530
3,740498
1,637217
Skewness
-0,358097
-0,369385
-0,276743
0,149198 -0,729144 -0,304463
Jarque-Bera
454.5115
151.7929
10.61436
21.53580
156.0443
28.95630
36 Journal of Islamic Economics, Banking and Finance, Vol. 11 No. 3, July-Sept. 2015
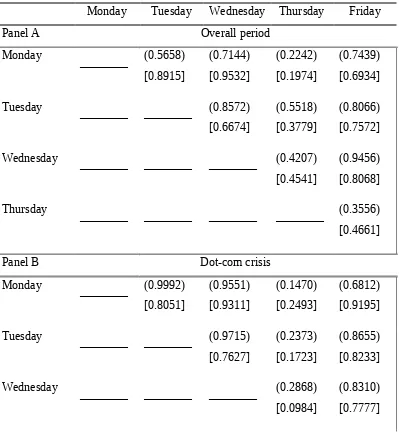
the p-values of both t-test and the Wilcoxon signed-rank test. Panel A gives the p-values for the overall period while panels B to E report those of the four subperiods. The results suggest that we cannot reject the null hypothesis at any acceptable level, for all days during the overall and the four subperiods. The differences in daily average returns being not statistically significant is a good sign for the Islamic market efficiency and imply that no profitable strategy can be designed using differences in the return’s mean among the days of the week. To get more insights into the presence of patterns in DJIMI’s returns we estimate our models (equations 2 and 7), Table 3 reports the results of these estimations.
Table 2: Results of mean-comparison tests
Monday
Tuesday
Wednesday
Thursday
Friday
Panel A
Overall period
Monday
————
(0.5658)
[0.8915]
(0.7144)
[0.9532]
(0.2242)
[0.1974]
(0.7439)
[0.6934]
Tuesday
————
————
(0.8572)
[0.6674]
(0.5518)
[0.3779]
(0.8066)
[0.7572]
Wednesday
————
————
————
(0.4207)
[0.4541]
(0.9456)
[0.8068]
Thursday
————
————
————
————
(0.3556)
[0.4661]
Panel B
Dot-com crisis
Monday
————
(0.9992)
[0.8051]
(0.9551)
[0.9311]
(0.1470)
[0.2493]
(0.6812)
[0.9195]
Tuesday
————
————
(0.9715)
[0.7627]
(0.2373)
[0.1723]
(0.8655)
[0.8233]
Wednesday
————
————
————
(0.2868)
[0.0984]
The Day of the Week Effect on Islamic Stock Market Returns: Evidence from Dow... 37
Panel D
Subprime crisis period
Monday
Panel D
Post subprime crisis period
38 Journal of Islamic Economics, Banking and Finance, Vol. 11 No. 3, July-Sept. 2015
Tuesday
————
————
(0.3861)
[0.6208]
(0.3587)
[0.6603]
(0.5808)
[0.8587]
Wednesday
————
————
————
(0.7035)
[0.6008]
(0.3293)
[0.5468]
Thursday
————
————
————
————
(0.3049)
[0.7698]
Notes:the average return of a day is compared with each one of remaining days
using t-test and the Wilcoxon signed-rank test. H0: Means are equal.
In parentheses: the two-tailed p values for t-test.
In brackets: the p values for the Wilcoxon signed-rank test.
5.3. Estimation of models :
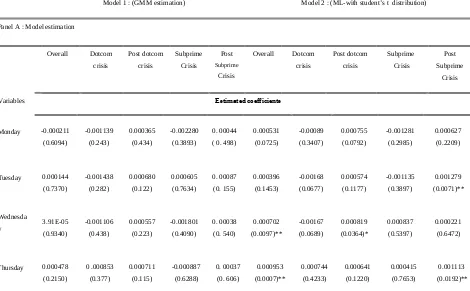
Panel A of Table 3 summarizes the results of estimation. The first model, even estimated using the GMM method and thus robust to autocorrelation and heteroskesdasticity, did not catch any day effect during the overall and the four subperiods. Indeed, the high p values suggest that the coefficients of dummies are statistically insignificant.
The second model, using the GARCH’s specification of conditional variance, shows a significant effect in Wednesdays and Thursdays during the overall period. The results show also a statistically significant Wednesday effect during the post Dotcom crisis while Tuesday and Thursday effects were present during the post Subprime period. It is worth noting that all significant effects are positive.
Interestingly, during the crisis periods, no day effect was found. This can be explained by a high level of returns’ volatility during downturns. Indeed, the long-run variance (defined as ω/1-α-β) increased respectively by 30% and 300% during the Dotcom and Subprime crisis compared with the overall period suggesting a strong correction of stock prices leading to more uncertainty but to less inefficiency.
Nevertheless, GMM failing to catch any day of the week effect is very intriguing. This leads us to argue that a model without an updating schema of volatility is likely to fail to catch any of weekday’s effects. In addition, the crises characterized by a high volatility, causes the blurring of the day’s effects.
The Day of the Week Effect on Islamic Stock Market Returns: Evidence from Dow... 39
5.4.GARCH (1,1) Goodness of fit :
On one hand, the produced p-values (except for “ω” in the subprime crisis period) provide strong evidence that the estimated parameters of the conditional variance equation are significant at all considered levels. In addition, they are strictly positive with their sum almost equal to 1.
The condition β + α < 1 makes the GARCH model stable; the positivity and non explosiveness of variance is assured, while ω > 0 makes the computed long-run variance consistent and mean reverting. On the other hand, the LM-GARCH test reported in panel C of table 3 suggests that there is no ARCH effect left in the standardized residuals what means that the variance equation is not misspecified. Thus we can assume that GARCH(1,1) model with the specified parameters provide a good fit for our data.
Table 3: Models estimation and tests
Model 1 : (GMM estimation) Model 2 : (ML-with student’s t distribution)
Panel A : Model estimation
Overall Dotcom
Variables Estimated coefficients
40 Journal of Islamic Economics, Banking and Finance, Vol. 11 No. 3, July-Sept. 2015
Long-run variance 0.00013 0.00017 0,00004 0.00052 0,000098
The Day of the Week Effect on Islamic Stock Market Returns: Evidence from Dow... 41
Notes: The Schwarz criterion suggests that the lag length is 2.Before the estimation of the second model, we perform ADF and Phillips-Perron tests (not reported) for raw returns to see whether they are stationary. Both tests reject the null hypothesis of returns having a unit root at 1% suggesting that raw returns are stationary in level.
For GARCH estimation, we use student t distribution because returns are leptokurtic and almost symmetric.
In parentheses: p-values.
The Day of the Week Effect on Islamic Stock Market Returns: Evidence from Dow... 42
5.5.
The day of the week effect on the market adjusted returns :
Exploring daily anomalies based on raw returns may be misleading (Gibbons and Hess, 1981). Thus, another analysis using market adjusted returns is conducted. This is done by extending equations (2) and (7) that become respectively:
t
CAPM model. The Rtm is the return from the Dow Jones Global Index. Other parameters
in the equations are the same as in (2) and (7). Results from regression are almost similar to those discussed before13. For the GMM estimation, while the estimated coefficients are slightly different, none of them are statistically significant. Using GARCH (1.1) the results (i.e., the statistical significance of the coefficients) are the same for the post Dotcom, Subprime and post subprime periods. For the overall period, only the Thursday effect is found significant. Interestingly, a negative and significant Wednesday effect is found during the Dotcom crisis.
6.
Summary and Conclusion:
The weekday effect on returns is a puzzling issue that many hypotheses tried to explain. In this paper we investigate the day of the week effect on Islamic stock market using the Dow Jones Islamic Market Index as a proxy. Our study covers the period from May 25, 1999 to November 28, 2013 with four subperiods. Two of them are crisis periods retracing the dynamic of the ISI during the downturns. The mean-comparison tests suggest no difference in returns’ mean among the weekdays. The model estimated using GMM also failed to catch any day of the week effect even when using the market adjusted returns. With GARCH(1,1), using raw returns, findings suggest the presence of significant and positive effects during the overall, the post Dotcom, and post Subprime crisis periods. Nevertheless, during the crises no day effect was found; the returns become totally random leading to more efficiency of DJIMI. Using the market adjusted returns, the results are slightly different; only a Thursday effect was found during the overall period while a Wednesday effect is detected during the Dotcom crisis period. Thus, adjusting
12
Here we use the 3 months LIBOR as a proxy of the interest free rate. 13
Results are not reported here to save space but are available upon request.
The Day of the Week Effect on Islamic Stock Market Returns: Evidence from Dow... 43
returns only change the qualitative nature of the effect but this later still persist; a result that is in line with Gibbons and Hess (1981). The results from the market adjusted returns analysis are more reliable since any test of market efficiency hypothesis is simultaneously a test of efficiency and of assumptions about the nature of market equilibrium (French, 1980). The GMM estimationfailing to catch any day of the week effect led us to argue that a model without an updating schema of volatility is likely to fail to catch any of these effects. In addition, the crises characterized by a high volatility blur any day of the week effect whatever the used model. The documented days’ effects in this study do not constitute a nuisance to the Islamic stock market efficiency since even if market participants knew about these effects; they will incur several types of transaction costs. The expected return must be twice higher than those costs to make profit of these anomalies. As the associated gain to these effects are not large enough to outweigh the transaction costs even if they are only of 0.15%; a dynamic trading strategy based on the day of the week effects cannot be a profitable trading strategy. French (1980)explained that the knowledge of the market inefficiency is not worthless even when the transaction costs are higher than the expected return from a dynamic trading strategy. An individual could increase the expected return to his investments by altering the timing of trades which would have been made anyway.
Finally, even when anomalies do exist in stock market returns, the hypothesis of efficiency cannot be unambiguously rejected even if it is difficult to imagine any reasonable model of equilibrium consistent with both market efficiency and weekdays effects (French, 1980). From a scientific point of view, it is more useful to conclude that the results are strong evidence that equilibrium returns vary across days of the week (Gibbons and Hess, 1981).
References:
Abul, Hassan, Antonios Antoniou, and Krishna Paudyal, “Impact of Ethical Screening on
Investment Performance: The Case of the Dow Jones Islamic Index.” Islamic Economic
Studies , Volume 12, Issue 2 (2005): 67–97.
Abul, Shamsuddin, “Are Dow Jones Islamic Equity Indices Exposed to Interest Rate Risk?” Economic Modelling , Volume 39 (April 2014): 273–81.
doi:10.1016/j.econmod.2014.03.007.
Affaneh, Ibrahim, Mohamed Albohali, and Robert J Boldin, “Islamic Market Indices: A
Comparison with Conventional World Indices Based on the Adjusted Sharpe Ratio.” International Journal of Business, Accounting, and Finance , Volume 7, Issue 1 (2013): 87– 101.
Ajmi, Ahdi Noomen, Shawkat Hammoudeh, Duc Khuong Nguyen, and Soodabeh Sarafrazi, “How Strong Are the Causal Relationships between Islamic Stock Markets and Conventional Financial Systems? Evidence from Linear and Nonlinear Tests.” Journal of International Financial Markets, Institutions and Money , Volume 28 (January 2014): 213–27.
44 Journal of Islamic Economics, Banking and Finance, Vol. 11 No. 3, July-Sept. 2015
from Bursa Malaysia.” Asian Academy of Management Journal of Accounting and Finance ,
Volume 4, Issue 1 (2008): 23–43.
Al-Hajieh, Heitham, Keith Redhead, and Timothy Rodgers, “Investor Sentiment and Calendar Anomaly Effects: A Case Study of the Impact of Ramadan on Islamic Middle Eastern Markets.” Research in International Business and Finance , Volume 25, Issue 3 (September 2011): 345–56.
Al-Khazali, Osamah, Hooi Hooi Lean, and Anis Samet, “Do Islamic Stock Indexes Outperform
Conventional Stock Indexes? A Stochastic Dominance Approach.” Pacific-Basin Finance
Journal, October 2013.
Alqahtani, Dhafer Salih, “Global Islamic Index Providers: The Wrong Choice.” The Journal of Investing , Volume 18, Issue 4 (2009): 79–81.
Atta, Hajara, “Ethical Rewards An Examination Of The Effect Of Islamic Ethical Screens On Financial Performance and Of Conditioning Information On Performance Measures.” Durham University, 2000.
Azhar, Abdul Rahman, Yahya Azlan Mohd, and Nasir Mohd Herry Mohd, “Islamic Norms for Stock Screening: A Comparison between the Kuala Lumpur Stock Exchange Islamic Index and the Dow Jones Islamic Market Index.” International Journal of Islamic and Middle Eastern Finance and Management , Volume 3, Issue 3 (2010): 228–40.
doi:10.1108/17538391011072426.
Binmahfouz, Saeed Salem, “Investment Characteristics of Islamic Investment Portfolios: Evidence from Saudi Mutual Funds and Global Indices.” Durham University, 2012.
Cosimano, Thomas F, and Dennis W Jansen, “Estimates of the Variance of U.S. Inflation Based
upon the ARCH Model.” Journal of Money, Credit and Banking , Volume 20, Issue 3 (1988):
409–21.
DeFusco, Richard A., Dennis W. McLeavey, Jerald E. Pinto, and David E. Runkle, Quantitative
Methods for Investment Analysis. 2nd ed. Virginia: CFA institute, 2004.
Derigs, Ulrich, and Shehab Marzban, “Review and Analysis of Current Shariah-Compliant Equity Screening Practices.” International Journal of Islamic and Middle Eastern Finance and Management , Volume 1, Issue 4 (2008): 285–303. doi:10.1108/17538390810919600.
Engle, Robert, “The Use of ARCH/GARCH Models in Applied Econometrics.” Journal of
Economic Perspectives , Volume 15, Issue 4 (November 2001): 157–68.
doi:10.1257/jep.15.4.157.
Febrian, Erie, Universitas Padjadjaran, Aldrin Herwany, and Adi Primadhi, “Market Response to
the Composition Change of Islamic Index: Evidence from Indonesia.” The International
Journal of Business and Finance Research , Volume 7, Issue 5 (2013): 23–35.
French, Kenneth, “Stock Returns and the Weekend Effect.” Journal of Financial Economics , Volume 8 (1980): 55–69.
Gibbons, Michael R., and Patrick Hess, “Day of the Week Effects and Asset Returns.” The Journal
The Day of the Week Effect on Islamic Stock Market Returns: Evidence from Dow... 45 Girard, Eric, and M. Kabir Hassan, “Is There a Cost to Faith-Based Investing: Evidence from
FTSE.” The Journal of Investing , Volume 17, Issue 4 (2008): 112–21.
Gourierou, C, A Monfort, and A Trognon, “A General Approach to Serial Correlation.” Econometric Theory , Volume 1, Issue 3 (1985): 315–40.
Guyot, Alexis, “Efficiency and Dynamics of Islamic Investment: Evidence of Geopolitical Effects
on Dow Jones Islamic Market Indexes.” Emerging Markets Finance and Trade , Volume 47,
Issue 6 (November 1, 2011): 24–45.
———“Les Préceptes de La Shari’ah Contribuent-Ils à L‘efficience et à La Performance Des
Marchés D‘actions? Une étude Comparative Des Indices Dow Jones Islamic.” In Colloque
International: Ouverture et émergence En Méditerranée, 2008.
Hakim, Sam, and Manochehr Rashidian, “How Costly Is Investors ’ Compliance to Sharia? How
Costly Is Investors ’ Compliance to Sharia?” In 11th Economic Research Forum Annual
Conference. Sharjah, UAE., 1–19, 2004.
———“Risk & Return of Islamic Stock Market Indexes.” In 9th Economic Research Forum
Annual Meeting, 26-29 Octobre, Sharjah A.E.U., 2002.
Hassan, M Kabir, “Risk , Return and Volatility of Faith-Based Investing The Case of the Dow Jones Islamic Index.” In Fifth Harvard University Forum on Islamic Finance: Islamic Finance: Dynamics and Development Cambridge, Massachusetts. Center for Middle Eastern Studies, Harvard University. 2000., 43–67, 2000.
Hassan, M. Kabir, and Eric Girard, “Faith-Based Ethical Investing: The Case of Dow Jones Islamic Indexes.” Islamic Economic Studies , Volume 17, Issue 2 (2010): 1–31.
Ho, Catherine Soke Fun, Nurul Afiqah Abd Rahman, Noor Hafizha Muhamad Yusuf, and Zaminor Zamzamin, “Performance of Global Islamic Versus Conventional Share Indices: International Evidence.” Pacific-Basin Finance Journal, October 2013, 1–12.
Hooi, Hooi Lean, and Parham Parsva, “Performance of Islamic Indices in Malaysia FTSE Market:
Empirical Evidence from CAPM.” Journal of Applied Sciences , Volume 12, Issue 12 (2012):
1274–81.
Hull, John, Options, Futures and Other Derivatives. 7th editio. Pearson Education International, 2009.
Hussein, Khaled A, “Ethical Investment: Empirical Evidence from FTSE Islamic Index.” Islamic
Economic Studies , Volume 12, Issue 1 (2004): 21–40.
———“Islamic Investment: Evidence From Dow Jones and FTSE Indices.” In 6th International
Conference on Islamic Banking and Finance, November 21-24, Jakarta, Indonesia, 1–14, 2005.
Hussein, Khalid, and Mohammad Omran, “Ethical Investment Revisited: Evidence from Dow
Jones.” The Journal of Investing , Volume 14, Issue 3 (2005): 105–26.
46 Journal of Islamic Economics, Banking and Finance, Vol. 11 No. 3, July-Sept. 2015 999–1007.
Iqbal, Munawar, and Philip Molyneux, Thirty Years of Islamic Banking History, Performance and
Prospects. Palgrave Macmillan, 2005.
Kiymaz, Halil, and Hakan Berument, “The Day of the Week Effect on Stock Market Volatility and Volume: International Evidence.” Review of Financial Economics , Volume 12 (2003): 363–80.
Levine, David, “A Remark on Serial Correlation in Maximum Likelihood.” Journal of
Econometrics 23 , Volume 23 (1983): 337–42.
Lobe, Sebastian, Felix Rößle, and Christian Walkshäusl, “The Price of Faith: Performance, Bull and Bear Markets, and Screening Effects of Islamic Investing Around the Globe.” The Journal of Investing , Volume 21, Issue 4 (2012): 153–64.
Raja, Noor, Baharuddin Nurul Syuhada, Shamsudin Norazidah, Jihan R Abdullah, Mansor Wmahmood Wan, and Zahariah Sahudin, “The Day of the Week Effect on Bursa ( Bourse ) Malaysia Shariah- Compliant Market.” Interdisciplinary Journal of Research in Business , Volume 1, Issue April (2011): 29–36.
Sadeghi, Mehdi, “Financial Performance of Shariah-Compliant Investment: Evidence from
Malaysian Stock Market.” International Research Journal of Finance and Economics, Issue
20 (2008): 15–26.
Walkshäusl, Christian, and Sebastian Lobe, “Islamic Equity Investing: Alternative Performance Measures and Style Analysis.” The Journal of Investing , Volume 21, Issue 4 (2012): 182–89.
———“Islamic Investing.” Review of Financial Economics , Volume 21, Issue 2 (April 2012): 53–
62.
Wawro, G., “Estimating Dynamic Panel Data Models in Political Science.” Political Analysis , Volume 10, Issue 1 (February 1, 2002): 25–48. doi:10.1093/pan/10.1.25.