Introducing a novel method for materials selection in mechanical design using
Z
-transformation in statistics for normalization of material properties
K. Fayazbakhsh, A. Abedian
*, B. Dehghan Manshadi, R. Sarfaraz Khabbaz
Department of Aerospace Engineering, Sharif University of Technology, P.O. Box 11365-8639, Tehran, Iran
a r t i c l e
i n f o
Article history:
Received 10 January 2009 Accepted 4 April 2009 Available online 12 April 2009
Keywords:
H. Selection for material properties H. Weighting and ranking factors H. Performance indices
a b s t r a c t
Optimum materials selection is a very important task in design process of every product. There are var-ious materials selection methods like Ashby’s method or digital logic methods such as DL and MDL. In the present research work theZ-transformation method is proposed for scaling the material properties to overcome the shortcoming of MDL method. The results show that despite the simple scaling function used, the ranking procedure is as powerful as MDL method and even it is superior to MDL when it ranks the less important materials existing among a list of candidate materials.
Ó2009 Elsevier Ltd. All rights reserved.
1. Introduction
It is estimated that more than 40,000 useful metallic alloys and probably close to that number of nonmetallic engineering materi-als such as plastics, ceramics and glasses, composite materimateri-als, and semiconductors to exist. This large number of materials and enor-mous number of manufacturing processes available to the engi-neers, coupled with the complex relationships between different selection parameters, often make the selection of materials for a gi-ven component a difficult task.
Mainly, based on quantitative and qualitative properties of materials, different materials selection approaches have been pro-posed and practiced by different researchers. Ashby et al.[1]have provided a comprehensive review of the strategies or methods for materials selection. From this study three types of materials selec-tion methodology could be identified. These are: (a) free searching based on quantitative analysis with the most famous being the graphical engineering selection method or the ranking method
[2,3], (b) checklist/questionnaire based on expertise capture like the reports[4–8]which are knowledge-based and intelligent data base systems or like[9]which is a structured set of questions that eventually end up with an optimal design solution, and (c) induc-tive reasoning and analog procedure[10].
Since a materials selection process could be considered as a decision making problem, the neural network, a kind of artificial intelligence[11], or the fuzzy logic approach[12]have been used for dealing with qualitative material properties. Also, in this direc-tion some fuzzy multi-criteria decision making methods like[13]
or multiple attribute decision making methods like [14] or the Technique of ranking Preferences by Similarity to the Ideal Solu-tion method (TOPSIS)[15]have been proposed by other research-ers. Furthermore, the environmental costs[16]or the dimensions of technology, economy and environment[17]have been included in the single decision making tools. Even, compatibility of a compo-nent with the linked compocompo-nents in an assembly has been consid-ered[18]or the process of selection has been divided to two stages, i.e. discrimination and optimization to minimize the number of qualitative decisions[19]. However, most of these systems and methods appear to be complex and knowledge intensive.
In this row, a variety of quantitative selection procedures have also been developed to analyze the large amount of data involved with the materials selection processes so that a systematic evalua-tion could be established. For example, Ashby[20,21]has intro-duced materials selection charts. He has also proposed a multi-objective optimization method for compromising between several conflicting objectives[22]. Garton et al.[23]used Fatigue Property Charts to select the optimal class or subclass of materials in mini-mum weight design for infinite fatigue life. Another approach to materials selection problems is the Weighted Properties Method (WPM). This numerical method ranks the candidate materials on the basis of their performance indices calculated from simple mathematics[24]. In cases where numerous material properties are involved and the relative importance of each property is not clear, determination of the weighting factors (
a
) can be largelyintuitive, so that the reliability of the selection method is highly reduced. As a result, the Digital Logic (DL) approach was proposed for determination of
a
[25]. The DL Method was then modifiedby Manshadi et al.[26]due to existing flaws in the scaling proce-dure. This new method was proposed by considering nonlinear
0261-3069/$ - see front matterÓ2009 Elsevier Ltd. All rights reserved. doi:10.1016/j.matdes.2009.04.004
*Corresponding author. Tel.: +98 21 66164947; fax: +98 21 66022731.
E-mail address:[email protected](A. Abedian).
Contents lists available atScienceDirect
Materials and Design
normalization combined with some modifications in the existing digital logic approach.
Even though a good amount of research work had been carried out on materials selection in the past, a simple and systematic sci-entific method or mathematical tool which can guide user organi-zations in taking a proper material selection decision is still a need. Therefore, in this paper, a new normalization function for MDL method is proposed. Besides, the capabilities of this new normali-zation function are discussed and compared with those of the MDL through three example problems in mechanical design and light-weight naval structures.
2. Method description
In materials selection problems, for when several material properties should be taken into account, the weighted property method and later on the digital logic methods (DL & MDL) have shown to be quite effective. Basically, in these methods, each mate-rial property is assigned a certain weight depending on its relative importance to the others. Using DL approach, evaluations are ar-ranged such that only two properties considered at a time. In com-paring two properties or performance goals, the more important goal is given a numerical value of (1) and the less important one is given (0). However, for the modified digital logic (MDL) method, a value of (1) is assigned to the less important property and the va-lue of (3) to the more important one. In this method, two proper-ties with equal importance receive equal numerical values of (2). Then the weighting factor (
a
) for each property is found bysum-ming up the positive decisions that every property receives divided by the total positive decisions that all the material properties are given. In this wayP
a
i¼1 for each material would be obtained.Then the performance index
c
for each candidate material isfound by using the following equation:
c
¼Xn
i¼1
a
iYi ð1ÞwhereYiis the scaled value of each property of a material with
re-spect to the other candidate materials for the given product. This scaling is done linearly or nonlinearly for DL and MDL methods, respectively. Although MDL method has eliminated the weighting and scaling flaws in WPM and DL methods, it may still need some modifications to find higher power or efficiency in final ranking of the candidate materials. These modifications may target the meth-od’s complications, time consuming calculations, or user unfriendly matters involved with the employed nonlinear scaling functions, should either be claimed by some users. Furthermore, the depen-dency of the scaling or normalization functions to the definition of the critical value for each material property (i.e.XC) and also its
ratio to the maximum value of the corresponding property may justify the modification attempts. It should be noted that the need
for definition ofXCmakes the process user knowledge dependent
and as was discussed in[26], forXC=Xmax/2, the nonlinear scaling
function would become indeterminate and as a result it is replaced with a linear function.
In the following subsection a new normalization function is proposed to replace the nonlinear normalization functions used in MDL method. This simplifies the calculations, has most accor-dance with statistic normalization, and increases the reliability of MDL method with eliminating the previously mentionedXC. It is
obvious that in MDL method, the normalization functions or scal-ing functions have no background in statistics and do not accord with it in any way. For the new method, the same weighting factor (
a
) as for MDL method is incorporated due to its ability inprovid-ing better comparison of material properties and their level of importance compared to DL method.
3. The bases of the proposed normalization function
In this paper theZ-transformation in statistics science is pro-posed for standard scaling or normalization[27]of materials prop-erties. TheZ-value is a dimensionless quantity which is defined by the following equation:
Z¼X
l
r
ð2ÞwhereXrepresents an individual raw score that is to be standard-ized,
r
is the standard deviation of the population, andl
is themean of the population. Here,
r
andl
are calculated by thefollow-ing equations:
whereNrepresents the number of candidate materials. The materi-als performance indices are calculated by Eq.(1), respectively[26]. It should be noted that in case, higher value of a property is of interest, Eq.(2)will be considered. However, for the properties that the lower value is of interest, Eq.(2)is used with a negative sign as indicated in the following equation:
Y¼ X
l
r
ð5ÞHere, for verification of the proposed function, three test cases are studied and the results will be compared with the results obtained by MDL method. The case studies are involved with materials selec-tion for a cryogenic storage tank, the spar for wing structure of a hu-man powered aircraft (HPA), and a high speed naval craft.
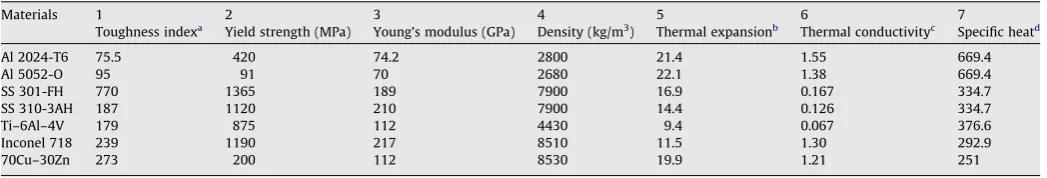
Table 1
Candidate materials properties for cryogenic storage tank (case I)[26].
Materials 1 2 3 4 5 6 7
Toughness indexa
Yield strength (MPa) Young’s modulus (GPa) Density (kg/m3
) Thermal expansionb
Thermal conductivityc
Specific heatd
Al 2024-T6 75.5 420 74.2 2800 21.4 1.55 669.4
Al 5052-O 95 91 70 2680 22.1 1.38 669.4
SS 301-FH 770 1365 189 7900 16.9 0.167 334.7
SS 310-3AH 187 1120 210 7900 14.4 0.126 334.7
Ti–6Al–4V 179 875 112 4430 9.4 0.067 376.6
Inconel 718 239 1190 217 8510 11.5 1.30 292.9
70Cu–30Zn 273 200 112 8530 19.9 1.21 251
a
Toughness index,T, is based on UTS, yield strength YS, and ductilitye, at196°C.T= (UTS + YS)e/2.
b
Thermal expansion coefficient is given in 106
/°C. The values are averaged between RT and196°C.
c
Thermal conductivity is given in 106
J/m2
/m/°C/s.
d
4. Verification of the method
4.1. Test case (I): cryogenic storage tank
This example problem is one of the problems that is widely tested by other materials selection methods. This is reanalyzed here using theZ-transformation method. Since this tank is designed for trans-portation of liquid nitrogen, the candidate materials should have good weldability and processability, lower density and specific heat, smaller thermal expansion coefficient and thermal conductivity,
adequate toughness at the operating temperature, and also the material should be sufficiently strong and stiff.
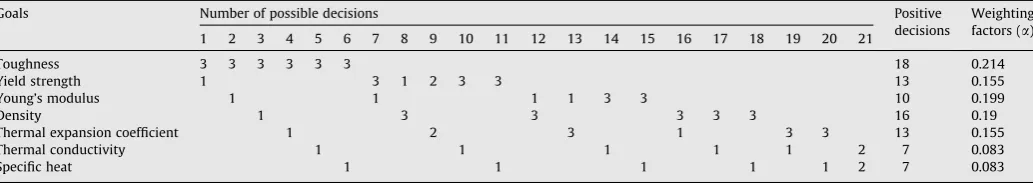
Table 1presents the properties of the candidate materials for the cryogenic tank. Also,Table 2shows the calculations for
a
. Itshould be noted that here, the same weighting factors as MDL method are used for theZ-transformation method. Finally, the per-formance index (
c
) for each material is calculated using Eq.(1). Itshould be stated that hereYiis calculated using Eqs.(2) or(5) for
theZ-transformation method. It is reminded again that linear scal-ing and nonlinear scalscal-ing functions are used for calculatscal-ingYiby DL
Table 2
Application of modified digital logic method to cryogenic storage tank (case I).
Goals Number of possible decisions Positive
decisions
Weighting factors (a) 1 2 3 4 5 6 7 8 9 10 11 12 13 14 15 16 17 18 19 20 21
Toughness 3 3 3 3 3 3 18 0.214
Yield strength 1 3 1 2 3 3 13 0.155
Young’s modulus 1 1 1 1 3 3 10 0.199
Density 1 3 3 3 3 3 16 0.19
Thermal expansion coefficient 1 2 3 1 3 3 13 0.155
Thermal conductivity 1 1 1 1 1 2 7 0.083
Specific heat 1 1 1 1 1 2 7 0.083
Table 3
Performance index and ranking of candidate materials for cryogenic storage tank using MDL andZ-transformation method (case II).
Materials The method of Manshadi et al.[26] Z-transformation method
Performance index (c) Rank Performance index (c) Rank
Al-2024-T6 1.2 5 0.56 6
Al-5052-O 8.8 7 0.65 7
SS 301-FH 47.7 1 0.78 1
SS 310-3AH 31.9 4 0.26 4
Ti–6Al–4V 43.5 2 0.39 2
Inconel 718 33.5 3 0.27 3
70Cu–30Zn 3.1 6 0.49 5
Table 4
Scaled property values performed by MDL method for cryogenic storage tank (case I).
Materials 1 2 3 4 5 6 7
Y1 Y2 Y3 Y4 Y5 Y6 Y7
Toughness Yield strength Young’s modulus Density CTE Thermal conductivity Specific heat
Al 2024-T6 33.3 3.3 15.2 90.1 25.5 53.9 17.6
Al 5052-O 22.9 68.4 19.4 100 28.1 50.1 17.6
SS 301-FH 100 100 80.7 38.4 2.7 47.9 55.5
SS 310-3AH 12.1 81.7 95.3 38.4 17.2 63.9 55.5
Ti–6Al–4V 9.6 59.9 20 14 100 100 39.9
Inconel 718 26.2 87.3 100 43 54.1 47.9 74.9
70Cu–30Zn 34.1 39.3 20 43.1 19.2 45.6 100
Sum 125 224 281 41.2 95.8 14.4 290
Table 5
Scaled property values performed byZ-transformation method for cryogenic storage tank (case I).
Materials 1 2 3 4 5 6 7
Y1 Y2 Y3 Y4 Y5 Y6 Y7
Toughness Yield strength Young’s modulus Density CTE Thermal conductivity Specific heat Al 2024-T6 0.84 0.70 1.13 1.33 1.07 1.16 1.54
Al 5052-O 0.75 1.39 1.21 1.37 1.22 0.89 1.54
SS 301-FH 2.34 1.30 0.83 0.72 0.08 1.06 0.51
SS 310-3AH 0.33 0.78 1.18 0.72 0.46 1.13 0.51
Ti–6Al–4V 0.37 0.26 0.49 0.67 1.55 1.23 0.26
Inconel 718 0.10 0.93 1.30 0.96 1.09 0.75 0.77
70Cu–30Zn 0.06 1.16 0.49 0.97 0.74 0.62 1.03
and MDL methods, respectively[26].Table 3presents the calcu-lated
c
and the corresponding ranking of the candidate materialsusing both of the applied methods. As it is seen, interestingly, the
Z-transformation provides the same ranking of the candidate materials as MDL method except for the two of the candidate materials, i.e. choices 5 and 6 of MDL method are switched by
Table 6
Candidate materials properties for HPA (case II)[26].
Materials 1 2 3 4 5 6
Price Tensile strength (MPa) Young’s modulus (GPa) Density (kg/m3
) Compressive strength (MPa) Creep resistance
Al-7075-T6 3.5 581 70.0 2600 581 Good
Al-2024-T4 3.5 425 72.5 2600 425 Good
Ti–6Al–4V 21 1008 112.0 4400 1008 Excellent
Ti–2Fe–3Al–10V 22 1295 120.0 4500 1295 Excellent
E-glass 73%–Epoxy 2.6 1642 55.9 2170 410 Average
E-glass 56%–Epoxy 2.5 1028 42.8 1970 290 Weak
E-glass 65%–Polyester 2.5 340 19.6 1800 90 Weak
S-glass 70%–Epoxy continuous fiber 9 2100 62.3 2110 550 Average S-glass 70%–Epoxy Fabric 8 680 22.0 2110 180 Average
Carbon 63%–Epoxy 45 1725 158.7 1610 900 Average
Aramid 62%–Epoxy 20 1311 82.7 1380 300 Average
Balsa 6 28.5 7.0 220 17.5 Average
Table 9
Scaled property values performed by MDL method for HPA (case II).
Materials 1 2 3 4 5 6
Y1 Y2 Y3 Y4 Y5 Y6
Price Tensile strength Young’s modulus Density Compressive strength Creep resistance
Al-7075-T6 83.1 40.7 12.7 5.2 76.8 50
Al-2024-T4 83.1 56.3 15.8 5.2 67.7 50
Ti–6Al–4V 2.1 0.8 58.8 13.7 92.7 100
Ti–2Fe–3Al–10V 4.2 27.8 66.5 14.5 100 100
E-glass 73%–Epoxy 98 59.5 5.5 11.9 66.7 0
E-glass 56%–Epoxy 100 2.7 24 15.5 56.7 50
E-glass 65%–Polyester 100 64.9 61.6 18.9 23 50 S-glass 70%–Epoxy continuous fiber 36.8 100 3 12.9 75.2 0 S-glass 70%–Epoxy Fabric 42.5 31 57.4 12.9 42.9 0
Carbon 63%–Epoxy 33.2 67 100 23.1 89.5 0
Aramid 62%–Epoxy 0 29.3 27.8 28.9 57.7 0
Balsa 56.5 97 85.4 100 22.8 0
Sum 560.5 3.05 50.7 206.4 726 200
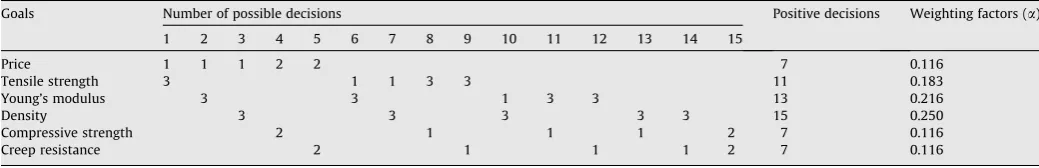
Table 7
Application of modified digital logic method to HPA (case II).
Goals Number of possible decisions Positive decisions Weighting factors (a)
1 2 3 4 5 6 7 8 9 10 11 12 13 14 15
Price 1 1 1 2 2 7 0.116
Tensile strength 3 1 1 3 3 11 0.183
Young’s modulus 3 3 1 3 3 13 0.216
Density 3 3 3 3 3 15 0.250
Compressive strength 2 1 1 1 2 7 0.116
Creep resistance 2 1 1 1 2 7 0.116
Table 8
Performance index and ranking of candidate materials for HPA using MDL andZ-transformation method (case II).
Materials The method of Manshadi et al.[26] Z-transformation method
Performance index (c) Rank Performance index (c) Rank
Al-7075-T6 20.9 7 0.007 7
Al-2024-T4 17.7 8 0.090 8
Ti–6Al–4V 31.5 5 0.030 6
Ti–2Fe–3Al–10V 38.5 2 0.216 3
E-glass 73%–Epoxy 31.8 4 0.173 5
E-glass 56%–Epoxy 11.6 9 0.196 9
E-glass 65%–Polyester 12 12 0.548 12
S-glass 70%–Epoxy continuous fiber 35.2 3 0.341 2
S-glass 70%–Epoxy Fabric 4.9 10 0.401 11
Carbon 63%–Epoxy 46.1 1 0.591 1
Aramid 62%–Epoxy 25.3 6 0.182 4
Z-transformation method. The reason for this ranking alternation will be explained latter. However, this finding (i.e. similarity in ranking of the materials by the two methods) is very exciting be-cause the scaling done here is very easy and straight forward com-pared to MDL method. It should be highlighted that this small difference in ranking by the two methods is in fact another impor-tant advantage of theZ-transformation over MDL method which for clear explanation the second test case (i.e. the human powered aircraft (HPA)) should be discussed first. However, at this stage, for better understanding of the subject matter, only a brief discussion on the scaled property values provided by the two methods is pre-sented. Here,Tables 4 and 5presentYifor the candidate materials
by MDL andZ-transformation, respectively. As it is seen, the sum of
the members of each column ofTable 5is the same and equal to zero. This is expected because theZ-transformation method has its roots in statistics and the standard scaling performed by the method must have such a characteristic. However, as Table 4
shows, the summations of members of each column, which are the scaled properties of the candidate materials performed by non-linear functions of MDL method, are neither zero nor equal to one another. This fact under some conditions may adversely affect the calculation of performance index (
c
) which uses the scaledprop-erty values and the weighting factors (
a
), see Eq.(1). When sumsof the scaled property values of the candidate materials, as ex-plained above, are not equal, the material property corresponding to the column with higher sum value will have more influence on
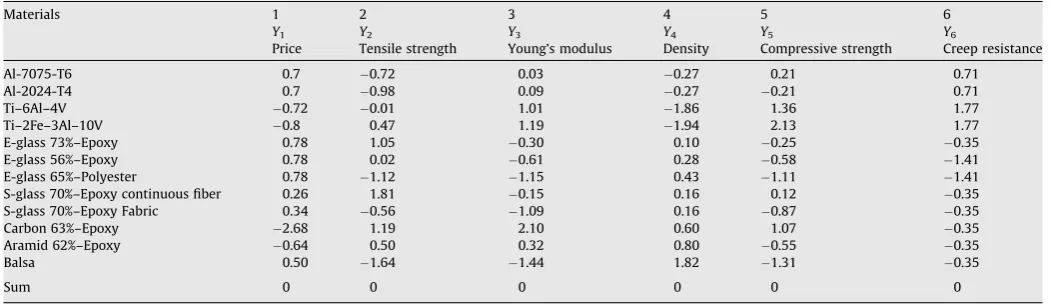
Table 10
Scaled property values performed byZ-transformation method for HPA (case II).
Materials 1 2 3 4 5 6
Y1 Y2 Y3 Y4 Y5 Y6
Price Tensile strength Young’s modulus Density Compressive strength Creep resistance
Al-7075-T6 0.7 0.72 0.03 0.27 0.21 0.71
Al-2024-T4 0.7 0.98 0.09 0.27 0.21 0.71
Ti–6Al–4V 0.72 0.01 1.01 1.86 1.36 1.77
Ti–2Fe–3Al–10V 0.8 0.47 1.19 1.94 2.13 1.77
E-glass 73%–Epoxy 0.78 1.05 0.30 0.10 0.25 0.35 E-glass 56%–Epoxy 0.78 0.02 0.61 0.28 0.58 1.41 E-glass 65%–Polyester 0.78 1.12 1.15 0.43 1.11 1.41 S-glass 70%–Epoxy continuous fiber 0.26 1.81 0.15 0.16 0.12 0.35 S-glass 70%–Epoxy Fabric 0.34 0.56 1.09 0.16 0.87 0.35
Carbon 63%–Epoxy 2.68 1.19 2.10 0.60 1.07 0.35
Aramid 62%–Epoxy 0.64 0.50 0.32 0.80 0.55 0.35
Balsa 0.50 1.64 1.44 1.82 1.31 0.35
Sum 0 0 0 0 0 0
Table 11
Candidate materials properties for high speed craft (case III)[28].
Materials 1 2 3 4 5 6 7 8 9
Yield strength (MPa)
Young’s modulus (GPa)
Fire resistance
Repairability Resistance to corrosion
Fabrication cost
Risk Density (kg/m3)
Overall potential for weight saving Grade A Steel 234.4 204.1 High Very high Low Avg. Low 7800 None Single Skin Aluminum
(A5086-H34)
137.9 67 Low High High Low Avg. 2700 High
Aluminum Sandwich (honeycomb core)
268.9 67 Avg. Avg. High Avg. Avg. 1800 Very high
LASCOR Steel 379.2 204.1 High Avg. High Very high High 5200 High Composite (CFRP) Carbon
w/Vinyl Ester Resin
1496.2 227.5 Low Avg. Very high Very high Avg. 1800 Very high
DUCTAL (UHP2C) 220.6 53.9 Very high Very high Very high Very low Very high
2500 High
Table 12
Quantitative values for material properties using Rao’s fuzzy conversion scale for high speed craft (case III).
Materials 1 2 3 4 5 6 7 8 9
Yield strength (MPa)
Young’s modulus (GPa)
Fire resistance
Repairability Resistance to corrosion
Fabrication cost
Risk Density (kg/m3
)
Overall potential for weight saving Grade A Steel 234.4 204.1 0.665 0.745 0.335 0.5 0.335 7800 0
Single Skin Aluminum (A5086-H34)
137.9 67 0.335 0.665 0.665 0.335 0.5 2700 0.665
Aluminum Sandwich (honeycomb core)
268.9 67 0.5 0.5 0.665 0.5 0.5 1800 0.745
LASCOR Steel 379.2 204.1 0.665 0.5 0.665 0.745 0.665 5200 0.665 Composite (CFRP) Carbon
w/Vinyl Ester Resin
1496.2 227.5 0.335 0.5 0.745 0.745 0.5 1800 0.745
the performance index (
c
) than the expected amount warranted byits weighting factor. The effect of this phenomenon will be ex-plained in details in the next subsection.
4.2. Test case (II): spar of a human powered aircraft (HPA)
This test example was used for explaining the advantage of MDL over DL method in [26] where it was shown that balsa was wrongly preferred over the titanium alloys for the spar application by DL method. This was then shown to happen due to linear scaling of the properties done by DL method. In fact, the method does not adequately emphasize on the large or small differences that may exist between the properties of the candidate materials. Also, the way of calculation of the weighting factors (
a
) by DL method wasfound to be responsible for this problem. It should be noted that
both of the mentioned reasons were then taken care of by the mod-ifications considered in MDL method.
Here, this example is resolved by using MDL and theZ -transfor-mation methods to shed more light on the advantages of the newly proposed method.Tables 6 and 7show the details of the candidate materials for the mentioned application and calculations of the weighting factors for MDL method, respectively. Also, calculation of performance indices and ranking of the candidates materials done by MDL andZ-transformation methods are shown inTable 8. A quick look at this table shows that except choices 1, 7, 8, 9, and 12, the rest of the rankings done by MDL andZ-transformation methods are different. For example, materials ranked 2 and 3 by MDL are switched by Z-transformation method. Also, E-glass 73%–Epoxy is ranked 4th by MDL while the 4th ranked material by Z-transformation method is Aramid 62%–Epoxy. These could
Table 13-2
Application of modified digital logic method to high speed craft (case III) (16–36).
Goals 16 17 18 19 20 21 22 23 24 25 26 27 28 29 30 31 32 33 34 35 36 Fire resistance 1 3 1 3 1 1
Repairability 3 1 1 2 1 1
Resistance to corrosion 1 3 1 1 1 1
Fabrication cost 3 3 3 3 1 1
Risk 1 2 3 1 1 1
Density 3 3 3 3 3 1
Overall potential 3 3 3 3 3 3
Table 13-3
Application of modified digital logic method to high speed craft (case III).
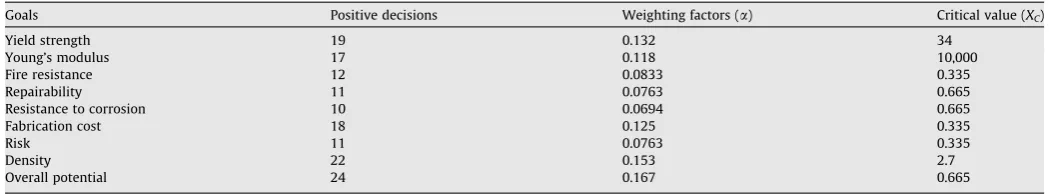
Goals Positive decisions Weighting factors (a) Critical value (XC)
Yield strength 19 0.132 34
Young’s modulus 17 0.118 10,000
Fire resistance 12 0.0833 0.335
Repairability 11 0.0763 0.665
Resistance to corrosion 10 0.0694 0.665
Fabrication cost 18 0.125 0.335
Risk 11 0.0763 0.335
Density 22 0.153 2.7
Overall potential 24 0.167 0.665
Table 14
Performance index and ranking of candidate materials for high speed craft using MDL andZ-transformation method (case III).
Materials The method of Manshadi et al.[26] Z-transformation method
Performance index (c) Rank Performance index (c) Rank
Grade A Steel 3.22 5 0.485 6
Single Skin Aluminum (A5086-H34) 0 4 0.017 3
Aluminum Sandwich (honeycomb core) 8.07 6 0.164 5
LASCOR Steel 4.5 3 0.107 4
Composite (CFRP) Carbon w/Vinyl Ester Resin 28.66 2 0.188 2
DUCTAL (UHP2C) 33.15 1 0.245 1
Table 13-1
Application of modified digital logic method to high speed craft (case III) (1–15).
Goals 1 2 3 4 5 6 7 8 9 10 11 12 13 14 15
Yield strength 3 3 3 3 2 3 1 1
Young’s modulus 1 3 3 3 2 3 1 1
Fire resistance 1 1
Repairability 1 1
Resistance to corrosion 1 1
Fabrication cost 2 2
Risk 1 1
Density 3 3
be fairly explained by consideringTables 9 and 10which illustrate the scaled property values obtained by nonlinear scaling functions of MDL andZ-transformation methods, respectively. As it is seen in these Tables, like the previous case study, sum of the column mem-bers or scaled values of each one of the properties are the same and equal to zero for theZ-transformation, while they are different for each property for MDL method. But, how this phenomenon affects the ranking is explained here. AsTable 7shows, for HPA example, the density with
a
= 0.25 appears to be the most important factorfor
c
calculation for this test case. However, based on Table 9,sum of the scaled density of the candidate materials (206.4) is low-er compared to sums of the two othlow-er scaled proplow-erties (i.e. price and compressive strength). This can strongly affect the ranking by MDL. As it is seen, MDL ranks Ti–2Fe–3Al–10V second and S-glass 70%–Epoxy continuous fiber third despite the larger density of the earlier compared to the latter (i.e. more than twice). In other words, when
a
is not the only factor influencingc
calculations theprice property with
a
= 0.116 and sum scaled values of 560 (seeTa-ble 9) may have more influence on the calculations than the den-sity. However, Z-transformation replaces the above ranking because with this method only
a
values affect thec
calculationsdue to standard scaling of the properties of the candidate materials which provides equal values for sum of the scaled properties (all are zero) as given inTable 10.
With the same reasoning, theZ-transformation method ranks Aramid 62%–Epoxy better than E-glass 73%–Epoxy while it is oppo-site in MDL method. This is done despite much higher price and smaller tensile strength of Aramid–Epoxy composite compared to E-glass–Epoxy. The much larger density of E-glass 73%–Epoxy, and also its corresponding
a
= 0.25 do not help MDL rankingbecause of the method’s inherent problem with property scaling explained earlier.
It should also be mentioned that negative sum values of the scaled properties make the situation worst. This could be better understood if one compares the sums of the scaled property values for the two HPA and cryogenic tank examples. As it is seen inTable 4, there is no negative sum value for the cryogenic tank and also sum values of all the scaled properties are not much different. However, one negative sum value and large difference between sums of the scaled values for HPA are seen inTable 9. That is why a little or no serious effect seen on the ranking results for the cryogenic tank by both methods. It should be noted that as ex-plained in the previous subsection, only materials ranked 5 and 6 by MDL method for the cryogenic tank are replaced by theZ -trans-formation method. The MDL method ranks 70Cu–30Zn 6 despite its much better toughness and Young’s modulus compared to Al 2024-T6 which is ranked 5. As the calculations show, the respec-tive
a
values for the mentioned properties are 0.214 and 0.199which are the highest
a
values for the cryogenic tank. Again, thischange in materials ranking by MDL method occurs due to the way of scaling done by this method which makes sum values of the scaled properties to be different.
4.3. Test case (III): high speed naval craft
‘‘Typically, the structural weight of a ship is about one-third of its displacement. Thus, making the potential for substantial weight saving when considering light-weight materials over traditional steel construction”[28]. High Performance light-weight materials can provide as much as 40% reduction in a ship structural weight
Table 15
Scaled property values performed by modified digital logic method for high speed craft (case III).
Materials 1 2 3 4 5 6 7 8 9 Sum 209.5 265.3 309.7 57.4 132.7 124.1 33.7 90.8 109
Table 16
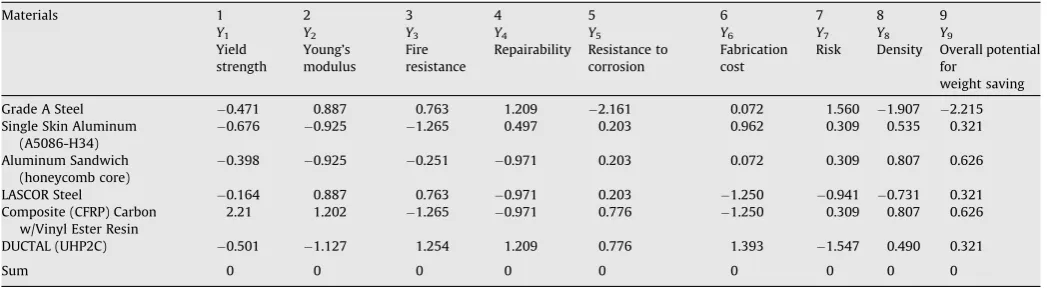
Scaled property values performed byZ-transformation method for high speed craft (case III).
Materials 1 2 3 4 5 6 7 8 9
0.676 0.925 1.265 0.497 0.203 0.962 0.309 0.535 0.321
Aluminum Sandwich
DUCTAL (UHP2C) 0.501 1.127 1.254 1.209 0.776 1.393 1.547 0.490 0.321
when compared with traditional plate and beam steel construc-tion. In this case, the system is a light-weight high-speed vessel. In particular, the materials selection is sought for the structural components of the ship such as hull plating, superstructure panels, decks, and beams. Therefore the participant material properties are: yield strength, Young’s modulus, fire resistance, repairability, resistance to corrosion, fabrication cost, risk, mass density, and overall potential for weight savings. It should be noted that this example problem has been already solved by Torrez [28] using MDL method. Here, the Z-transformation is employed to show the power of the method. The properties of the candidate materials and the corresponding quantitative values for the qualitative prop-erties are presented inTables 11 and 12. As stated in[28], Rao’s fuzzy score conversion scale has been used to convert the qualita-tive values to quantitaqualita-tive values. Here, there are nine properties (n= 9), therefore the number of possible decisions would be
N=n(n1)/2 = 36.Tables 13-1–13-3present the weighting factor calculation for MDL method along withXCfor each property.
Final-ly,Table 14illustrates ranking of the candidate materials for both MDL andZ-transformation methods.
Interestingly, the first and second choices of materials are the same for both methods. However, due to the reasons discussed be-fore, choices 3 and 4 and also 5 and 6 made by MDL are switched by theZ-transformation method. For example, MDL picks up LAS-COR Steel as the third choice instead of Single Skin Aluminum which is ranked third by Z-transformation. This is done despite higher density of LASCOR (almost twice) compared to that of the Single Skin Aluminum. It should be noted that three of the proper-ties for this material, i.e. fire resistance, Young’s modulus, and yield strength, are superior to the Single Skin Aluminum candidate. However,Z-transformation method replaces the ranking of these two materials. This seems to be done because of the absolute supe-riority of the material density. It could be easily understood if one compares the scaled property values done by MDL andZ -transfor-mation methods, which are shown inTables 15 and 16, respec-tively. As it is seen, sum of the materials’ scaled density by MDL is 90.8, while for fire resistance, Young’s modulus, and yield strength this value is 309.7, 265.3, and 209.5, respectively. These values are at least 2–3 times of the same quantity for density. This huge difference does not allow the value of
a
for density (a
= 0.153)to play a reasonable role in calculating the performance index for the Single Skin Aluminum. Also, the huge negative sum value of the scaled fabrication cost (with
a
= 0.125) adversely affects theMDL ranking. As a result, the differences in ranking of candidate materials performed by both methods are more pronounced than the last two test cases.
5. Concluding remarks
In comparison to MDL method, theZ-transformation method:
1. Technically uses a very simple function for scaling the material properties.
2. Uses a similar function for scaling the properties that their min-imum are important as those which their maxmin-imum are impor-tant with only multiplying the function with a negative sign. 3. There is no need for definingXCas in MDL method. This greatly
reduces the dependency of the method to the user knowledge. 4. With eliminating XC, there is no indeterminate point for the
scaling function. It is reminded that atXC=Xmax/2 the nonlinear
scaling functions for MDL method were found indeterminate and the user was obliged to perform linear scaling at this point. 5. Interestingly, both methods act closely in ranking the candidate materials. For example, in all three test examples the materials ranked first are the same by both methods. In fact, both
meth-ods are capable of readily identifying the materials with some distinguished properties from a bunch of candidate materials. This similarity in ranking results for some test cases even hap-pens for most of the candidate materials. However, the advan-tages of Z-transformation method is more illustrated when ranking materials for which it is not very easy to identify any superiority in properties of the candidate materials. This advan-tage of theZ-transformation method is more appreciated by the designers because most of the time the trades off between some properties, which are the result of designers engineering knowl-edge, pursue them to make use of the lower ranked materials. In such situations,Z-transformation method is more reliable than the MDL method. This is done due to more proper scaling of the material properties by the Z-transformation method. This is because the method has its scaling roots in statistics. As a result,
a
factor would be the only parameter that influences thecalcu-lations of performance index (
c
). It should be noted that basedon the reviewed examples in this study, sometimes the border of this advantage ofZ-transformation method is distributed to even second ranked choice materials done by other methods. So, it makes worthy to consider this new method. However, if only the first ranked material from among a list of candidate materials is of interest, the choice of the ranking method is not of much importance.
References
[1] Ashby MF, Brechet YJM, Cebon D, Salvo L. Selection strategies for materials and processes. Mater Des 2004;25:51–67.
[2] Ashby MF. Materials selection in mechanical design. New York: Pergamon Press; 1992.
[3] Ashby MF, Johnson K. Materials and design: the art and science of materials selection in product design. Oxford: Butterworth–Heinemann; 2002. [4] Trethewey KR, Wood RJK, Puget Y, Roberge PR. Development of a knowledge
based system for materials management. Mater Des 1998;19:39–56. [5] Amen R, Vomacka P. Case-based reasoning as a tool for materials selection.
Mater Des 2001;22:353–8.
[6] Chen JL, Sun SH, Hwang WC. An intelligent data base system for composite material selection in structural design. Eng Fract Mech 1995;50:935–46. [7] Sapuan SM. A knowledge-based system for materials selection in mechanical
engineering design. Mater Des 2001;22:687–95.
[8] Edwards KL. Selecting materials for optimum use in engineering components. Mater Des 2005;26:469–73.
[9] Zha XF. A web-based advisory system for process and material selection in concurrent product design for a manufacturing environment. Int J Adv Manuf Technol 2005;25(3–4):233–43.
[10] Amen R, Vomacka P. Case-based reasoning as a tool for materials selection. Mater Des 2001;22:353–8.
[11] Takuma M, Shibasaka T, Teshima T, Iwai Y, Honda T. Study on support system for materials selection in the design process. Trans JSME C 1994;60(574):294–300 [in Japanese].
[12] Sarfaraz Khabbaz R, Dehghan Manshadi B, Abedian A, Mahmudi R. A simplified fuzzy logic approach for materials selection in mechanical engineering design. Mater Des 2008.
[13] Liao TW. A fuzzy multi criteria decision making method for material selection. J Manuf Syst 1996;15:1–12.
[14] Shanian A, Savadogo O. A material selection model based on the concept of multiple attribute decision making. Mater Des 2006;27:329–37.
[15] Shanian A, Savadogo O. TOPSIS multiple-criteria decision support analysis for material selection of metallic bipolar plates for polymer electrolyte fuel cell. J Power Sources 2006;159:1095–104.
[16] Chen RW, Navin-Chandra D, Kurfess T, Prinz FB. A systematic methodology of material selection with environmental considerations. In: Proceedings of the 1994 IEEE international symposium on electronics and the environment, San Francisco, CA, USA; 1994. p. 252–7.
[17] Ribeiro I, Pecas P, Silva A, Henriques E. Life cycle engineering methodology applied to material selection, a fender case study. J Clean Prod 2008;16:1887–99.
[18] Bamkin RJ, Piearcey BJ. Knowledge-based material selection in design. Mater Des 1990;11(1):25–9.
[19] Sandstrom R. An approach to systematic materials selection. Mater Des 1985;6:328–37.
[20] Ashby MF. Materials selection in conceptual design. Mater Sci Tech 1989;5(6):517–25.
[22] Ashby MF. Multi-objective optimization in material design and selection. Acta Mater 2000;48:359–69.
[23] Garton DA, Kang KJ, Fleck NA, Ashby MF. Materials selection for minimum weight fatigue design. Theor Concept Numer Anal Fatigue 1992:359–76. [24] Farag M. Materials selection for engineering design. Prentice-Hall; 1997. [25] Farag MM. Materials selection for engineering design. London: Prentice Hall
Europe; 1997.
[26] Manshadi BD, Mahmudi H, Abedian A, Mahmudi R. A novel method for materials selection in mechanical design: combination of non-linear normalization and a modified digital logic method. Mater Des 2007;28:8–15. [27] Richard J, Larsen, Marx Morris L. An introduction to mathematical statistics
and its applications. Englewood Cliffs, NJ: Prentice-Hall Inc.; 1981. [28] Torrez JB. Light-weight materials selection for high-speed naval