SATELLITE-DERIVED BATHYMETRY: ACCURACY ASSESSMENT ON DEPTHS
DERIVATION ALGORITHM FOR SHALLOW WATER AREA
Najhan Md Saida, Mohd Razali Mahmuda and Rozaimi Che Hasanb a
GeoCoastal Research Unit, Faculty of Geoinformation and Real Estate, Universiti Teknologi Malaysia Skudai, Malaysia
b
UTM Razak School of Engineering and Advanced Technology, Universiti Teknologi Malaysia Kuala Lumpur, Malaysia
Email: [email protected], [email protected] and [email protected]
KEY WORDS: Satellite-Derived Bathymetry, Shallow Water Survey
ABSTRACT
Over the years, the acquisition technique of bathymetric data has evolved from a shipborne platform to airborne and presently, utilising space-borne acquisition. The extensive development of remote sensing technology has brought in the new revolution to the hydrographic surveying. Satellite-Derived Bathymetry (SDB), a space-borne acquisition technique which derives bathymetric data from high-resolution multispectral satellite imagery for various purposes recently considered as a new promising technology in the hydrographic surveying industry. Inspiring by this latest developments, a comprehensive study was initiated by National Hydrographic Centre (NHC) and Universiti Teknologi Malaysia (UTM) to analyse SDB as a means for shallow water area acquisition. By adopting additional adjustment in calibration stage, a marginal improvement discovered on the outcomes from both Stumpf and Lyzenga algorithms where the RMSE values for the derived (predicted) depths were 1.432 meters and 1.728 meters respectively. This paper would deliberate in detail the findings from the study especially on the accuracy level and practicality of SDB over the tropical environmental setting in Malaysia.
1. INTRODUCTION
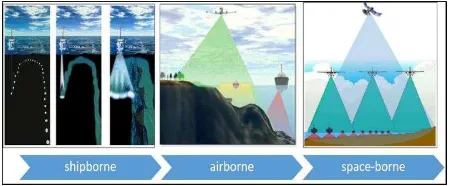
The growing demands of bathymetric data for various marine applications have increased dramatically in the past few decades. Modern marine applications, especially for marine navigation, management of environmental protection, exploration and exploitation of marine resources, fisheries, marine science research, maritime defence, the delimitation of maritime boundaries, tourism and recreation as well as the development of national spatial data infrastructure, required more comprehensive bathymetric data (IHO, 2005). The increasing demand for detailed bathymetric data indirectly has catalysed hydrographic surveying industry to diversify data collection techniques. The need for more precise and detail seabed morphology outlook have evolved the bathymetry acquisition technique from shipborne platform to airborne and even using space-borne acquisition (Pe’eri et al., 2014).
Figure 1. The evolution of bathymetry data acquisition technique (NOAA, 2017)
Figure 1 describes the evolution of bathymetry data acquisition technique from shipborne to the space-borne platform. The space-borne bathymetry acquisition method is
no more rhetoric topic and hydrographic surveying industry in recent years. The vast development of the remote sensing technology and geographical information system (GIS) application has facilitated this space-borne bathymetry to be more accessible (Stumpf et al., 2003; Louchard et al., 2003; Brando and Dekker 2003; Lyzenga et al., 2006; Su et al., 2008; Bachmann et al., 2012; Flener et al., 2012; Doxani et al., 2012; Bramante et al., 2013; and, Pe’eri et al., 2014).
Traditional unattractive satellite images can transform into a beneficial and reliable seabed information just by embracing some unique mathematical algorithm upon the combination of spectrum bands. This contemporary technique is known as Satellite-Derived Bathymetry (SDB). Now SDB is a new revolution in the field of hydrographic surveying.
which in certain conditions, capable of meeting the IHO
Special Order survey (Pe’eri et al., 2014).
Nevertheless, besides the typical issue on high levels of turbidity, the common concerns for some service providers when operating aircraft in the semi-enclosed maritime region like Malaysia is the deal out of permits for airborne operations. The unsettled overlapping maritime claims between neighbouring states in the region is high potential to become a terrifying task for the service providers to operate LiDAR system. With all the perilous issues, the operational cost of a LiDAR system in this region can go extremely high, especially when the project requires more frequent flyovers (Minghelli-Roman et al., 2009 and Pe’eriet al., 2014).
Hence,with more new satellites being launch and new sensors developed every year, a significant number of research works have been conducted to assess and analyse the SDB acquisition techniques (Bramante et al., 2013). Unsurprisingly, this contemporary remote sensing technology considered as a promising technology and an attractive option for seafloor mapping, especially in the shallow water environment.
2. SDB: A NEW OPTION IN MALAYSIA?
The retribution of today’s SDB technology inspired by Lyzenga (1978) through his study of deriving water depth estimation using airborne multispectral data with radiometric technique. The introduction of the electromagnetic (EM) spectrum capabilities in satellite technology which capable to penetrate the water medium has initiated the same principle of extracting bathymetric data from the space-borne platform. Theoretically, when the light passing through the water column, it physical properties becomes weakened and resulted the image of shallow water area appeared brighter and more realistic than in deep water areas that look dark and disturbed (Su et al., 2008).
However, the representation of the image of the earth that reflected by solar radiation is not a simple, forthright equation. In reality, the solar radiation has undergone a significant interaction through the atmosphere and water column before it reaches the satellite sensor. This common physical principle has moulded the better understanding of the capabilities of SBD method for seabed mapping.
The topic related to SDB is relatively fresh and new in Malaysia. Since this subject has generated intense debate among academics and industry players globally, the National Hydrographic Center (NHC) and Universiti Teknologi Malaysia (UTM) jointly took the initiative to carry out an in-depth study of SDB. Both organisations have always inspired to be at the forefront of pioneering technology which closely related to hydrographic surveying and becomes the reference agency to industry players at the national level. Some studies related to SDB in Malaysia already existed (Tang and Pradhan, 2015 and Muslim and Foody, 2008), although most of these studies do not evaluate and discuss in detail about the efficacy of SDB in hydrographic applications.
Therefore, the ultimate aim of this study is assessing the SDB data quality in the shallow water area. The detailed analysis is emphasis on the level of precision and consistency of SDB results in typical Malaysia’s climate environment. Simultaneously, the best practice for the SDB application for
shallow water area also developed as guiding principle amongst hydrographic surveying industry in Malaysia.
3. DATA AND PRE-PROCESSING
3.1 Study area
The study area focused in the Eastern Sabah where some part of the area located inside the gazetted security zone name as the Eastern Sabah Security Zone (ESSZONE). ESSZONE is a security zone in the state of Sabah which gazetted following the series of security invasions that occurred in the eastern part of Sabah. The availability of latest bathymetry data was the most important factor in the selection of this region as the study area. At the same time, it was a good approach to balance the research needs with operational requirements.
In meeting the research objectives, this study able to provide a general outlook of the Low Water Line (LWL) in the selected research area and capable of supporting the ongoing negotiation of the maritime boundaries between Malaysia and Indonesia. Therefore, an area fronting Tawau Port approaches area was selected as a study area.
3.2 Multispectral satellite image data
The main element of SDB technology is the multispectral satellite imagery data itself. Within the last decade, numbers of the new satellite with built-in sensors to provide high-resolution multispectral imageries have been launched (IKONOS, GeoEye, SPOT6/7, Pleiades and Worldview). These modern satellites with state-the-art capability indeed have evoked the SDB application, particularly for coastal management solutions. For high-resolution, there are SPOT 6/7 with carrying fibre-optic gyro (FOG) and four control moment gyros (CMGs) and the Pleiades with an improved panchromatic spatial resolution which capable of providing a very-high-resolution (VHR) of around 50cm resolution imageries.
Figure 2: Pleiades multispectral images for Tawau area. Image (a) Blue Band; (b) Red Band; (c) Green Band; and (d)
NIR Band.
3.3 Bathymetry data
The latest bathymetric data were used for this study to minimise the ambiguity on the final analysis stage. In order to match the new multispectral satellite image data supplied by MRSA, a dedicated survey was conducted to acquire new data set at the study area. A Single Beam Echosounder System (SBES) was adopted since the nature of the study area are relatively very shallow water depths. The hydrographic surveying works commenced on 30 November to 2 December 2016.
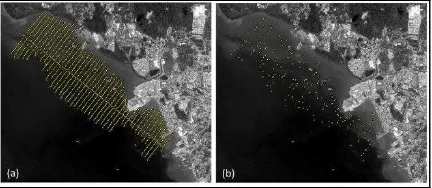
The bathymetric data divided into two (2) categories, the random dataset and full dataset. The random dataset is a set of randomly selected data which exclusively used for the calibration process. A total of 200 samples has been chosen randomly using MATLAB software from the whole dataset. The full dataset is the entire data consist of 2452 sample depths. This full dataset is data used for the final accuracy analysis stage. Figure 3 shows the overview of the random dataset and full dataset in the study area.
Figure 3: The overview of the latest bathymetry dataset
collected dedicatedly for this study. (a) Full Dataset; and (b) Random Dataset
3.4 Processing software
ArcMap software Version 10.1 with the support of 3D Analyst Tool was the main software used for the processing stage. CARIS BASE Editor and MATLAB were the other supporting software utilised for accuracy analysis and statistical exploration. Flowchart for the data processing activities of this SDB study described in Figure 4. The pre-processing of the multispectral image data involved the Geometric Correction, Radiometric Corrections (Top-of-Atmosphere (ToA)
Radiance, ToA Reflectance, Sun Glint Correction and Atmosphere Correction) and Radiometric Analysis to produce SDB.
Figure 4: The flow chart of all corrections involve in the SDB
processing stage.
4. BATHYMETRY DERIVATION ALGORITHM
There are several algorithm models developed to deriving bathymetry data from satellite images. This study adopted the two (2) most popular derivation algorithm models, Stumpf and Lyzenga. Albeit, there is no new algorithm developed, the new improvement made through the calibration stage. This enhancement involves a least square computation to form the best fit linear derivative model.
4.1 Stumpf model (Log-Ratio Model)
This model developed by Stumpf (2003) apply the fundamental principle that every band has a different level of
water body’s absorption. The different level of absorption conceptually will generate the ratio between bands and this ratio will consistently change simultaneously when the depth changes.
Theoretically, when the ratio increases the depth will increase as well. The band with a higher level of absorption will continually decrease when the depth increase. According to Stumpf et al. (2003), this log-ratio model is more robust and has demonstrated more accurate depth estimation especially for shallow habitats with low reflectance and in the area of deeper benthic habitats compared to other derivation models. The Equation 1 below deliberate the Stumpf log-ratio model algorithm.
(1)
Where;
the constant coefficients for the model;
the radiances for spectral λ1and λ2;
4.2 Lyzenga Model (Log-Linear Model).
(2)
Where;
(i = 0,1,..,N) the constant coefficients, N is the number of spectral bands;
L(λi ) L(λi) the remote sensing radiance
after atmospheric and sun-glint corrections for spectral band λi;
L∞(λi) the deep-water radiance for spectral band λi.
The Equation 2 explains that a linear correlation between water depth and corrected deep-water radiances of spectral bands produced by the conventional logarithm transformation process. Therefore, the model works with the simple assumption where the single wavelength band algorithm based on invariant bottom type (reflectance) while the algorithm for a pair of wavelength bands is a multiple log-linear regression model which the bottom type (reflectance) is variable (Su et al., 2008).
5. RESULTS AND DISCUSSION
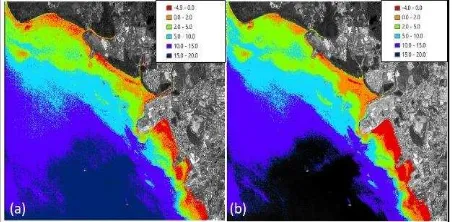
In general, both derivation algorithm models successfully produced decent results. Stumpf algorithm is simpler and straightforward during the processing stage. However, this model delivers slightly rough results compared to Lyzenga model which having more clean results. Nevertheless, Lyzenga algorithm was quite demanding in the final processing stage as this model apply the multiple regression methods. Figure 5 shows the final result obtained from both models.
Figure 5: The result of SDB image produced by using both
derivation algorithm model; (a) Model Stumpf; and (b) Model Lyzenga
The assessment of accuracy made by comparing the SDB data generated by both models with the real bathymetry data (Full Dataset) acquired by SBES. The accuracy level of both algorithms was assessed using the simple statistic models, the Root Mean Square Error (RMSE). The RMSE equations used is shown in Equation 3.
(3)
Where;
predicted depths (SDB data); reference depths (SBES data); number of samples.
Initially, the results of the analysis show that the Stumpf model delivered the RMSE value of 1.624 m while Lyzenga’s produced 1.915 m. However, these results have improved marginally after adopting the new enhancement method using Least Square Equation (LSE) adjustments during the calibration process. The new RMSE result from Stumpf shows 1.432 m which improved 0.192 m and Lyzenga model produced 1.728 m, improved 0.187 m. Roughly, the LSE adjustment successfully improves 11.82 percent from Stumpf
model’s initial result and 9.76 percent for Lyzenga’s. Generally, the LSE adjustment does not only simplify the painstaking manual calibration process but also improve the RMSE results. The improvement also takes place in the maximum and minimum variance values. The marginal improvement in the result of RMSE analysis for both derivation model described in Table 1.
Table 1: The improvement of results by adopting new
enhancement using LSE adjustment applied for both Stumpf and Lyzenga model
Nevertheless, the enhancement in RMSE values did not adequately represent the right assessment of the SDB accuracy level. Thus, the further quality assessment was made to analyse the outcome of the SDB produced from both improved models with the IHO Survey Standards requirements as published by the International Hydrographic Organization (IHO) in Special Publication No 44 (5th Edition updated
February 2008). According to the S-44 publication, the maximum allowable Total Vertical Uncertainties (TVU) are as shown in Table 2.
Table 2: The Total Vertical Uncertainties (TVU) requirements
(Source: IHO, 2008)
the minimum order Order 1b. At the same time, a total of 1146 samples which equivalent to 46.7 percent samples made the minimum standards of Order 2.
Nevertheless, the results achieved by Stumpf model were slightly diverse than the results produced by Lyzenga model where a total of 610 samples or 24.9 percent of the total 2452 samples reached the minimum order Order 1b. In addition, only 957 samples which are 39.0 percent able to achieve the minimum requirements for the Order 2. Histogram graph in Figure 6 shows the accuracy assessment analysis results for both Stumpf and Lyzenga model compared with the IHO S-44 standard requirements (Order 1b and Order 2).
Figure 6: Histogram graphs show results from the accuracy
assessment for both Stumpf and Lyzenga derivation model where the IHO S-44 Order 1b (green) and Order 2 (green and
yellow); (a) Stumpf Model; and (b) Lyzenga Model.
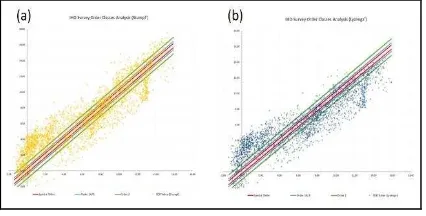
Further assessment was conducted to analyse the error distribution of SDB value compared to the IHO Survey Order classes standard. Figure 7 shows the distribution of the errors where the graph pattern demonstrated that the distribution of errors is relatively harmony with the IHO Survey Order classes trendlines for both Stumpf (yellow) and Lyzenga (blue). The trend pattern also clearly identified that, for the shallow water area (depth less than 5 meters), the results were slightly higher. Further detail analysis is still on-going to identify the main factor for the errors. The analysis is also looking at the error distribution concerning depth layers and seabed classifications as well.
Figure 7: Error distribution patterns of the SDB values
derived from both algorithm modified models in relation to IHO Survey Order classes; (a) Stumpf (yellow) and (b)
Lyzenga (blue).
6. CONCLUSION
Principally, this study has successfully illuminated the level of quality that the SDB technology can offer to the hydrographic surveying industry in Malaysia. As the status of the
hydrographic survey coverage percentage in this country is relatively small, sooner or later, this enormous gap of bathymetry data, especially in the shallow water area, need to be addressed by the relevant authority. Therefore, this study has aligned the methodology and scope into meeting the interest from hydrographic surveying industry. The approach of this study purposely designed to address the mind-blowing question amongst the hydrographic surveying community whether this SDB technology can deliver the level of accuracy required by the industry.
As this study is still enduring, the promising results from this initial stage capable of providing a definite answer to that question. At the very least, the preliminary results have to enlighten which level of accuracy does this SDB technology can offer to the hydrographic survey industry. Albeit, in-depth analysis is yet to be carried out; these encouraging results demonstrate that this study over SDB technology is very significant, feasible and indeed capable of delivering likely outcomes.
ACKNOWLEDGEMENTS
The authors would like to thank the National Hydrographic Centre, Department of Survey and Mapping Malaysia, Malaysia Remote Sensing Agency and Acburn Marine Automation Sdn Bhd (Kongsberg Maritime local representative). We are grateful to the Ministry of Education Malaysia and Universiti Teknologi Malaysia for funding this research under Research University Grant (Vote number: Q.J130000.2527.17H97).
REFERENCES
Bachmann, C., Montes, M., Parrish, C., Fusina, R., Nichols, R., Li, R., Hallenborg, E., Jones, C., Lee, K., Sellars, J., White, S., and Fry, J. (2012). A Dual-Spectrometer Approach to Reflectance Measurements Under Sub-Optimal Sky Conditions. Optics Express, 20, 8959–8973.
Bramante, J. F., Raju, D. K. and Sin, T. M. (2014). Multispectral Derivation of Bathymetry in Singapore's Shallow, Turbid Waters. International Journal of Remote Sensing, 34:6, 2070-2088.
Brando, V. E., and Dekker, A. G. (2003). Satellite Hyperspectral Remote Sensing for Estuarine and Coastal Water Quality. IEEE Transactions on Geoscience and Remote Sensing, 41, 1378–87.
Doxani, G., Papadopoulou, M., Lafazani, P., Pikridas, C. and Tsakiri-Strati, M. (2012). Shallow-Water Bathymetry over Variable Bottom Types Using Multispectral Worldview-2 Image. ISPRS Congress Proceeding, 25 Aug – 1 Sept 2012, Melbourne, Australia. 159-164.
Flener, C., Lotsari, E., Alho, P., and Kayhko, J. (2012). Comparison of Empirical and Theoretical Remote Sensing Based Bathymetry Models in River Environments. River Research and Applications, 28, 118–133.
International Hydrographic Organization (2008). IHO Standards for Hydrographic Surveys (5th Edition). Monaco: IHO Publication S-44.
Louchard, E. M., Reid, R. P., Stephens, C., Davis, C. O., Leathers, R. A. and Downes, T. V. (2003). Optical Remote Sensing of Benthic Habitats and Bathymetry in Coastal Environments at Lee Stocking Island, Bahamas: A Comparative Spectral Classification Approach. Limnology and Oceanography, 48, 511–21.
Lyzenga, D. R. (1978). Passive Remote Sensing Techniques for Mapping Water Depth and Bottom Features. Applied Optics, 17:3, 379-383.
Lyzenga, D. R. (1981). Remote Sensing of Bottom Reflectance and Water Attenuation Parameters in Shallow Water Using Aircraft and Landsat Data. International Journal of Remote Sensing, 2:1, 71-82.
Lyzenga, D. R. (1985). Shallow-Water Bathymetry Using Combined Lidar and Passive Multispectral Scanner Data.
International Journal of Remote Sensing, 6:1, 115-125.
Lyzenga, D., Malinas, N. and Tanis, F. (2006). Multispectral bathymetry using a simple physically based algorithm. IEEE Trans. Geoscience and Remote Sensing, 44:8, 2251-2259.
Minghelli-Roman, A., Goreac, A., Mathieu, S., Spigai, M. and Gouton. P. (2009). Comparison of Bathymetric Estimation Using Different Satellite Images in Coastal Sea Waters.
International Journal of Remote Sensing, 30, 5737–50.
National Oceanic and Atmospheric Administration (NOAA). (2017, May 17). History of Hydrographic Survey. Retrieved from the NOAA Office of Coast Survey website: https://www.nauticalcharts.noaa.gov.
Pe’eri, S., Parrish, C., Azuike, C., Alexander, L. and
Armstrong, A. (2014). Satellite Remote Sensing as Reconnaissance Tool for Assessing Nautical Chart Adequacy and Completeness. Marine Geodesy, 37, 293–314.
Stumpf, R. P., Holderied, K. and Sinclair, M. (2003). Determination of Water Depth with High-Resolution Satellite Imagery over Variable Bottom Types. Limnology Oceanography, 48, 547-556.
Su, H., Liu, H. and Heyman, W. D. (2008). Automated Derivation of Bathymetric Information from Multi-Spectral Satellite Imagery Using a Non-Linear Inversion Model.
Marine Geodesy, 31, 281-298.