FOOD VULNERABILITY AND ALLUVIAL FARMING FOR FOOD SECURITY IN
CENTRAL DRY ZONE AREA OF MYANMAR
M. S. Booria,b, d *, K. Choudharya, M. Eversd, A. Kupriyanova, c a
Samara National Research University, 34, Moskovskoye Shosse, Samara, 443086, Russia – [email protected]
b
American Sentinel University, 2260 South Xanadu Way, Suite 310, Aurora, Colorado 80014, USA
c
Image Processing Systems Institute of the RAS, Molodogvardejskaya St. 151, Samara,443001, Russia
d
Bonn University, Meckenheimer Allee 166, D-53115 Bonn, Germany
KEY WORDS: Food vulnerability, alluvial farming, remote sensing, GIS
ABSTRACT:
The central dry zone area of Myanmar is the most water stressed and also one of the most food insecure regions in the country. In the Dry Zone area, the total population is 10.1 million people in 54 townships, in which approximately 43% live in below poverty line and 40-50% of the rural population is landless. Agriculture is the most important economic sector in Myanmar as it is essential for national food security and a major source of livelihood for its people. In this region the adverse effects of climate change such as late or early onset of monsoon season, longer dry spells, erratic rainfall, increasing temperature, heavy rains, stronger typhoons, extreme spatial-temporal variability of rainfall, high intensities, limited rainfall events in the growing season, heat stress, drought, flooding, sea water intrusion, land degradation, desertification, deforestation and other natural disasters are believed to be a major constraint to food insecurity. For food vulnerability, we use following indicators: slope, precipitation, vegetation, soil, erosion, land degradation and harvest failure in ArcGIS software. The erosion is influenced by rainfall and slope, while land degradation is directly related to vegetation, drainage and soil. While harvest failure can be generate by rainfall and flood potential zones. Results show that around 45% study area comes under very high erosion danger level, 70% under average harvest failure, 59% intermediate land degradation area and the overall around 45% study area comes under insecure food vulnerability zone. Our analysis shows an increase in alluvial farming by 1745.33 km2 since 1988 to reduce the insecure food vulnerability. Food vulnerability map is also relevant to increased population and low income areas. The extreme climatic events are likely increase in frequency and magnitude of serious drought periods and extreme floods. Food insecurity is an important thing that must be reviewed because it relates to the lives of many people. This paper is helpful for identifying the areas of food needs in central dry zone area of Myanmar.
* Corresponding author. This is useful to know for communication with the appropriate person in cases with more than one author. 1. INTRODUCTION
The world‟s population is expected to grow almost 10 billion by 2050, boosting agricultural demand – in a scenario of modest economic growth – by some 50 percent compared to 2013. Income growth in low- and middle-income countries would hasten a dietary transition towards higher consumption of meat, fruits and vegetables, relative to that of cereals, requiring commensurate shifts in output and adding pressure on natural resources. In World Food Conference the term "food security" was defined as "exists when all people, at all times, have physical and economic access to sufficient, safe and nutritious food to meet their dietary needs and food preferences for an active and healthy life". Food security incorporates a measure of resilience to future disruption or unavailability of critical food supply due to various risk factors including droughts, shipping disruptions, fuel shortages, economic instability and wars. In the years 2011-2013, an estimated 842 million people were suffering from chronic hunger. The Food and Agriculture Organization (2014) identified the four pillars of food security as availability, access, utilization, and stability. The United Nations (1999) recognized the Right to Food in the Declaration of Human Rights in 1948 and has since noted that it is vital for the enjoyment of all other rights.
Over the past century, enormous progress has been achieved worldwide in improving human welfare. Societies have changed radically thanks to quantum leaps in technology, rapid
urbanization and innovations in production systems. Similarly, much remains to be done to fulfil the vision of the Food and Agriculture Organization of the United Nations (FAO, 2014): to create „a world free of hunger and malnutrition and one in which food and agriculture contribute to improving the living standards of all, especially the poorest, in an economically, socially and environmentally sustainable manner‟. Projected growth in the world‟s population is expected to be concentrated in Africa and South Asia and in the world‟s cities. By mid -century, two-thirds of the global population will live in urban areas. Low-income countries will see large increments in the 15-24 years age group. The population will continue to grow in South Asia until mid-century and in sub-Saharan Africa until at least the end of the century. By the year 2100, Asia and Africa are expected be home to a combined population of 9 billion, out of the projected 11 billion people who will inhabit Earth.
In Myanmar, 44 percent of households had problems meeting food needs (JICA, 2013) despite being part of a major agricultural region (World Bank, 2014). According to (World Bank, 2014), 58% of those living in the region are farmers and 25% are farm laborers. Similarly, other studies (Haggblade et. al., 2013) also indicate that farming and casual labor in the agriculture sector are the two key livelihood activities in the Dry Zone (LIFT, 2015). The vulnerabilities of many farming communities are increasingly complex as Myanmar undergoes unprecedented political, social and environmental changes, making the design of impactful development interventions
The International Archives of the Photogrammetry, Remote Sensing and Spatial Information Sciences, Volume XLII-4/W5, 2017 GGT 2017, 4 October 2017, Kuala Lumpur, Malaysia
This contribution has been peer-reviewed.
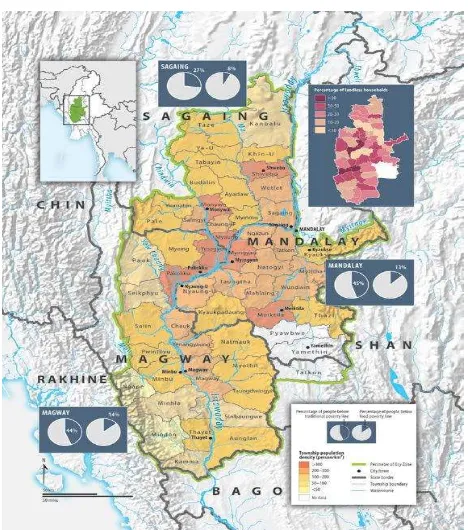
challenging. Food insecurity and flood risk are very common in the Dry Zone (Fig. 1). A survey conducted by (WFP, 2011) found that 18% of households had inadequate food for consumption and more than a quarter of children under the age of five were underweight. Households with poor access to land and markets and those relying on casual labor are the most likely to have insufficient food. Farming households are more likely to be food-secure, but food security is precarious even for these families. In 2010, the food security of 41% of farming households was adversely affected by dry spells (WFP, 2011).
Figure. 1. The demographics of Myanmar's Dry Zone, showing the population density of townships and distribution of landless households. (Source: Boundary/townships as defined by the Myanmar Information Management Unit [MIMU] [Map Id.: MIMU983V01], March 2013 [www.themimu.info/]; Statistics
on population density, poverty and landless households from [3]).
Remote sensing and GIS technology can help to access food insecurity through satellite data and socio-economic data such as soil condition/thickness, rate of erosion and harvest/crop failure. The erosion is directly related to rainfall and slope, which we can get from rainfall stations and elevation map/DEM. Land degradation level is based on vegetation condition, drainage and soil solum thickness. While harvest failure can be generate by rainfall and flood potential zones. With remote sensing technology, the analyst will know the locations that are vulnerable for experiencing food insecurity and it will help the local government to distribute the food needs for the community based on the analysis. Spatial modelling for food insecurity was usually performed using quantitative modelling methods of tiered-overlay where each parameter has a weight for each factor. So that, the greater the value of the factor, the greater the influence to the result.
Besides of physical parameter, we also used the social and economic parameters, which are the society‟s income information on the population in the study area that is vulnerable to the poverty line. So that the mapping of food insecurity is very helpful for managing equitable distribution of
food to the local community needs. The main objective of this research work is (1) build a model for food security through remote sensing and GIS, (2) identify the different levels of food insecurity, (3) identify the different parameters, which used to identify food insecurity, (4) identify most influential factors of food insecurity and (5) identify location distribution of food insecurity in the study area.
2. MATERIALS AND METHODS
1.1 Land use/cover scenario
A. Data
To know the land use/cover scenario in the study are we used primary (satellite data) and secondary data such as ground truth for land use/cover classes and topographic sheets. The ground truth data were collected using Global Positioning System (GPS) for the year of 2016 in the month of June to August for image analysis and classification accuracy. A selection of multisensor, multi-resolution and multi-temporal images was used in this study. The specific satellite images used were Landsat TM (Thematic Mapper) for 1985, 1995, ETM+ (Enhanced Thematic Mapper plus) for 2005, Landsat OLI (Operational Land Imager) for 2016, an image captured by a different type of sensors (Boori et. al., 2016a).
B. Image processing
Digital image processing was manipulated by the ArcGIS software. The scenes were selected to be geometrically corrected, calibrated and removed from their dropouts. Other image enhancement techniques like histogram equalization were also performed on each image for improving the quality of the image. Digital topographical maps, 1:50,000 scale, were used for image georeferencing for the land use/cover map and for increased accuracy of the overall assessment. At this stage, 20 points were selected as GCPs (Ground Control Point) for all images. Data sources used for the GCP selection were: digital topographic maps, GPS (Global Positioning System) acquisitions. Then, all four images were geometrically corrected up to orthorectified level. The data of ground truth were adapted for each single classifier produced by its spectral signatures for producing series of classification maps (Boori et. al., 2016b).
C. Classification of images
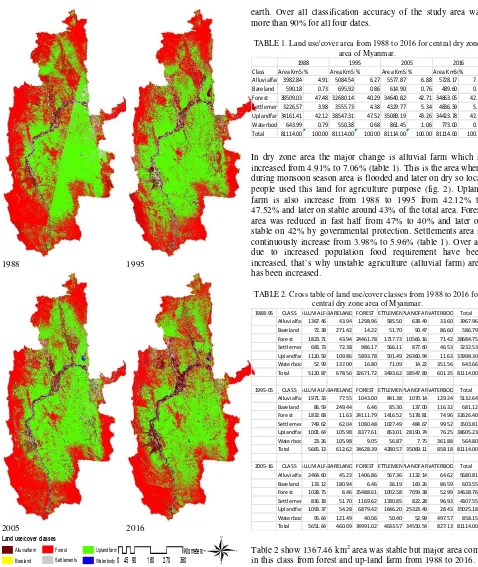
After pre-processing, first use unsupervised classification and get maximum possible classes on the basis of gray levels. Then used supervised classification method with maximum likelihood algorithm in ArcGIS 10.2 Software. Maximum likelihood algorithm (MLC) is one of the most popular supervised classification methods used with remote sensing image data. This method is based on the probability that a pixel belongs to a particular class. Ground verification was done for doubtful areas. Based on the ground trothing, the misclassified areas were corrected using recode option in ArcGIS (Boori et. al., 2016b). The error matrix and Kappa methods were used to assess the mapping accuracy. Six land use/cover types are identified in the study area viz., (i) Alluvial farm (ii) Bare land (iii) Forest (iv) Settlements (V) Up-land farm (Vi) Waterbody.
1988 1995
2005 2016
Land use/cover classes
Alluvialfarm
Bareland
Forest
Settlements
Uplandfarm
Waterbody0 4590 180 270 360 Kilometers
®
Figure 2. Land use/cover maps from 1988 to 2016 for central dry zone area of Myanmar.
D. Land use/cover change detection and analysis
Figure 2 shows land use/cover image after supervised classification. These images provide pattern of land use/cover of the study area. The gray color represent settlements, dark brow alluvial farm, red color forest, blue color water, yellow color shows the bare land and green color shows up-land farm. All land cover class maps were compared with reference data, which was prepared by ground truth, sample points and google
earth. Over all classification accuracy of the study area was more than 90% for all four dates.
TABLE 1. Land use/cover area from 1988 to 2016 for central dry zone area of Myanmar.
Class Area KmSq% Area KmSq% Area KmSq% Area KmSq%
Alluvialfarm3982.84 4.91 5084.54 6.27 5577.87 6.88 5728.17 7.06
Bareland 590.18 0.73 695.92 0.86 614.90 0.76 489.60 0.60
Forest 38509.03 47.48 32680.14 40.29 34640.82 42.71 34863.05 42.98 Settlement 3226.57 3.98 3555.73 4.38 4329.77 5.34 4836.39 5.96 Uplandfarm34161.41 42.12 38547.31 47.52 35089.19 43.26 34423.78 42.44 Waterbody 643.99 0.79 550.38 0.68 861.45 1.06 773.00 0.95 Total 81114.00 100.00 81114.00 100.00 81114.00 100.00 81114.00 100.00
1988 1995 2005 2016
In dry zone area the major change is alluvial farm which is increased from 4.91% to 7.06% (table 1). This is the area where during monsoon season area is flooded and later on dry so local people used this land for agriculture purpose (fig. 2). Upland farm is also increase from 1988 to 1995 from 42.12% to 47.52% and later on stable around 43% of the total area. Forest area was reduced in fast half from 47% to 40% and later on stable on 42% by governmental protection. Settlements area is continuously increase from 3.98% to 5.96% (table 1). Over all due to increased population food requirement have been increased, that`s why unstable agriculture (alluvial farm) area has been increased.
TABLE 2. Cross table of land use/cover classes from 1988 to 2016 for central dry zone area of Myanmar.
1988-95 CLASS ALLUVIALFABARELAND FOREST SETTLEMENTUPLANDFARMWATERBODY Total Alluvialfarm1367.46 43.94 1298.96 585.50 638.49 33.60 3967.96 Bareland 72.38 271.42 14.22 51.70 90.47 86.60 586.79 Forest 1823.71 43.94 24461.78 1717.73 10566.16 71.42 38684.75 Settlements 683.73 72.38 986.17 566.11 877.60 46.53 3232.53 Uplandfarm 1120.59 109.86 5893.78 501.49 26360.94 11.63 33998.30 Waterbody 52.99 137.00 16.80 71.09 14.22 351.56 643.66 Total 5120.87 678.56 32671.72 3493.62 38547.89 601.35 81114.00
1995-05 CLASS ALLUVIALFABARELAND FOREST SETTLEMENTUPLANDFARMWATERBODY Total Alluvialfarm1971.33 77.55 1043.00 841.38 1070.14 129.24 5132.64 Bareland 86.59 249.44 6.46 85.30 137.00 116.32 681.12 Forest 1832.68 11.63 24111.79 1416.52 5178.81 74.96 32626.40 Settlements 749.62 62.04 1080.48 1027.49 484.67 99.52 3503.81 Uplandfarm 1001.64 105.98 8377.61 853.01 28190.74 76.25 38605.23 Waterbody 23.26 105.98 9.05 56.87 7.75 361.88 564.80 Total 5665.13 612.62 34628.39 4280.57 35069.11 858.18 81114.00
2005-16 CLASS ALLUVIALFABARELAND FOREST SETTLEMENTUPLANDFARMWATERBODY Total Alluvialfarm2464.60 45.23 1406.86 567.36 1132.14 64.62 5680.81 Bareland 133.12 180.94 6.46 36.19 160.26 86.59 603.55 Forest 1028.75 6.46 25488.61 1002.58 7059.38 52.99 34638.76 Settlements 836.18 51.70 1169.62 1330.85 822.28 96.93 4307.55 Uplandfarm 1093.37 54.28 6879.42 1646.20 25323.49 28.43 35025.18 Waterbody 95.64 121.49 40.06 50.40 52.99 497.57 858.15 Total 5651.64 460.09 34991.02 4633.57 34550.54 827.13 81114.00
Table 2 show 1367.46 km2 area was stable but major area come in this class from forest and up-land farm from 1988 to 2016. It means during monsoon season these forest and up-land farms are under flood and later on in dry time local people use this area for alluvial farming to complete food demand. Settlement area have been increasing continuously but from 1988 to 2005 its increase in alluvial farm and up-land farm as booth areas used for agriculture purpose so farmers and labors use there agriculture field for accommodation. This is also convenient for them. But from 2005 to 2016 forest area was encroached by settlements around 1002 km2 forest area convert in settlements. In all three decade major forest area encroached by upland farm, it`s show pressure of food demand on agriculture area due to increased population (table 2).
The International Archives of the Photogrammetry, Remote Sensing and Spatial Information Sciences, Volume XLII-4/W5, 2017 GGT 2017, 4 October 2017, Kuala Lumpur, Malaysia
This contribution has been peer-reviewed.
1.2 Food vulnerability
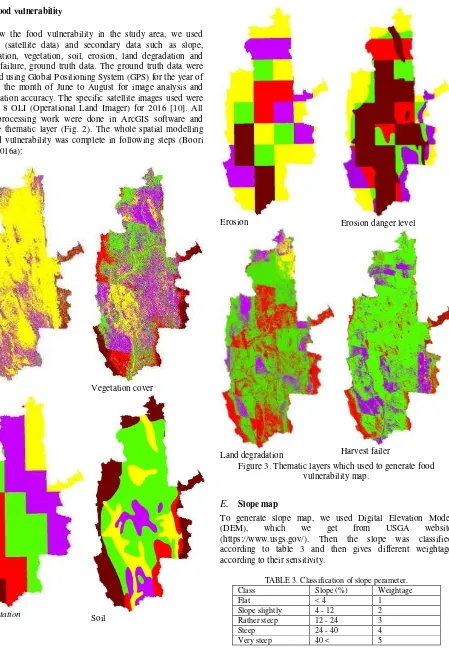
To know the food vulnerability in the study area, we used primary (satellite data) and secondary data such as slope, precipitation, vegetation, soil, erosion, land degradation and harvest failure, ground truth data. The ground truth data were collected using Global Positioning System (GPS) for the year of 2016 in the month of June to August for image analysis and classification accuracy. The specific satellite images used were Landsat 8 OLI (Operational Land Imager) for 2016 [10]. All image processing work were done in ArcGIS software and generate thematic layer (Fig. 2). The whole spatial modelling for food vulnerability was complete in following steps (Boori et. al., 2016a):
Slope Vegetation cover
Precipitation Soil
Erosion Erosion danger level
Land degradation Harvest failer
Figure 3. Thematic layers which used to generate food vulnerability map.
E. Slope map
To generate slope map, we used Digital Elevation Model (DEM), which we get from USGA website (https://www.usgs.gov/). Then the slope was classified according to table 3 and then gives different weightage according to their sensitivity.
TABLE 3. Classification of slope perameter. Class Slope (%) Weightage
Flat < 4 1
Slope slightly 4 - 12 2 Rather steep 12 - 24 3
Steep 24 - 40 4
Very steep 40 < 5
F. Vegetation map
Vegetation map was generated by landsat 8 OLI imagery. First we make NDVI then classcifiy image based on color tone. Dark red color show thick vegetation and light tone thin vegetation. The vegetation classification show in following table 4 and figure 3.
TABLE 4. Classification of vegetation cover.
Class Slope (%) Weightage http://atlas.gwsp.org/index.php) with 0.5 degree. For analysis work, first shapefile was converet into raster file with 30*30m cell size by mean value (Fig. 3). Then mean annual precipetation value were assigned weightage according to following table.
TABLE 5. Classification of annual precipetation.
Mean annual
precipitation >15 15 - 25 25 - 35 35 - 50 50 <
Weightage 1 2 3 4 5
H. Soil map
We get soil map from GWSP (Digital Water Atlas http://atlas.gwsp.org/index.php) with 0.5 degree. For analysis work, first shapefile was converet into raster file with 30*30m cell size by mean value (Fig. 3). Then soil value were assigned weightage according to following table.
TABLE 6. Classification of Soil characteristics.
thickness Soil characteristics Wei. Very thin Yellowish brown regosol and grey grumosol
complex, grey regosol, greyish brown regosol, association of litosol and brown and reddish brown mediteran, complex latosol and renzina
3
Deep Brown latosol, reddish latosol, complex reddish brown latosol, and litosol http://atlas.gwsp.org/index.php) with 0.5 degree. For analysis work, first shapefile was converet into raster file with 30*30m cell size by mean value (Fig. 3). Then erosion value were assigned weightage according to following table.
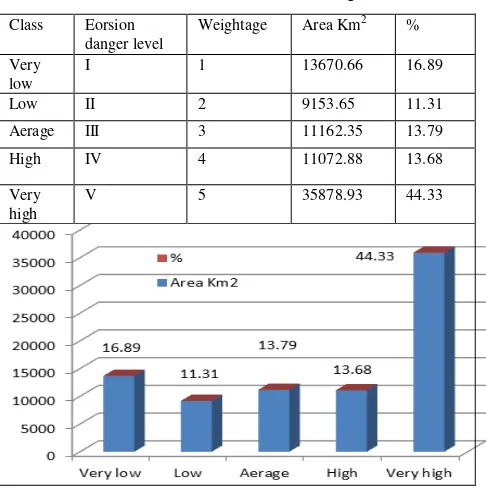
TABLE 7. Classification of erosion parameter.
Class Eorsion (ton/ha/year) Weightage Very low < 20 1 Around 45% study area comes under very high erosion danger level due to lose soil, sparse vegetation and uncertain rain intensity.
TABLE 8. Classification of erosion danger level.
Class Eorsion cover and slope. All these parameters have weighted, according to their effectiveness/sensitivity. Now in land degradation modeling, vegetation cover parameter weight is 45, erosion danger level is 35 and slope parameter weight is 20. Then the result was classified as table 9. Analysis shows that around 59% area under medial type of land degradation (Table 9). The influence parameters for land degradation are low vegetation cover, high slope and high erosion rate, which is also increase food vulnerability.
The International Archives of the Photogrammetry, Remote Sensing and Spatial Information Sciences, Volume XLII-4/W5, 2017 GGT 2017, 4 October 2017, Kuala Lumpur, Malaysia
This contribution has been peer-reviewed.
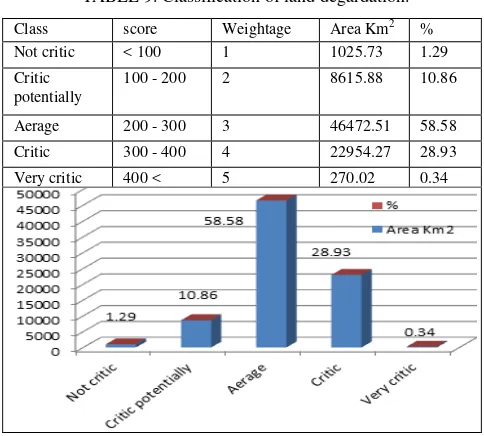
TABLE 9. Classification of land degardation.
Class score Weightage Area Km2 % Not critic < 100 1 1025.73 1.29 Critic
potentially
100 - 200 2 8615.88 10.86
Aerage 200 - 300 3 46472.51 58.58 Critic 300 - 400 4 22954.27 28.93 Very critic 400 < 5 270.02 0.34
L. Harvest failure modeling
This modeling was generated by 3 parameters: 1) Terrain unit, 2) flood risk and 3) vegetation cover. Then it was classified based on its score as follow in table 10. We find that almost 70% central dry zone area comes under middle type of harvest failure; this is also increase high food insecurity.
TABLE 10. Classification of harvest failure.
Class % harvest failer
Weightage Area Km2 %
Very low < 2 1 433.46 0.53
Low 2 - 5 2 14722.05 18.14
Aerage 5 - 10 3 56787.62 69.98 High 10 - 15 4 8450.45 10.41 Very high 15 < 5 756.84 0.93
M. Food vulnerability modeling
This is the final modeling. It‟s generated by following parameters: vegetation cover, precipitation, land degradation and harvest failure parameter.
Vegetation cover factor (V) = 0.007A2 – 1.7109A + 101.53
Annual precipitation factor (ACH) = -0.0078B2 – 2.0304B – 11.424
Land degradation factor (LD) = -0.0242C2 + 3.5117C – 1.4752
Harvest failure factor (HF) = -0.0472D2 + 4.7183D – 6.080
Then, food endurance level (Y) will be calculated by following formula:
Y = (0.1255*V) + (0.1671*ACH) + (0.2808*LD) + (0.4273*HF)
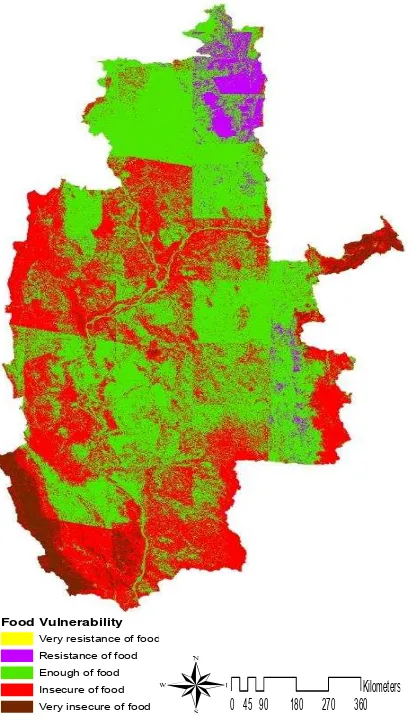
TABLE 11. Classification of food vulnerability.
Y Explanation Area Km2 %
< 20 Very resistance of food 30.47 0.04 20 - 40 Resistance of food 3409.64 4.20 40 - 60 Enough of food 42689.48 52.60 60 - 80 Insecure of food 31743.87 39.11 80< Very insecure of food 3291.29 4.06 Analysis shows that 52.60 % central dry zone area comes under enough of food class but around 45% study area is under insecure food class area (Table 11 and Fig. 4).
Food Vulnerability
Figure 4. Food vulnerability map of central dry zone area of Myanmar.
3. RESULTS AND DISCISSION
The Central Dry Zone is mostly that, with the Irrawaddy River (joined by the Chindwin River), owing through it from north to south. The Bago Hills range runs parallel to the Irrawaddy River in the southern part of the Dry Zone, gaining altitude towards the north and ending in southeast Mandalay. Fertile alluvial soil is found along the banks of the major rivers, but the Bago Hills are sandstone and have less fertile sandy soil. As its name suggests, the Dry Zone is the driest region of the country, with annual rainfall between 500 and 1,000 mm.
In this research work food vulnerability determined by vegetation cover, land degradation, precipitation and harvest failure risk. Precipitation reflects the abnormal rainfall in the area that`s why many time, its cause of droughts and floods. This abnormal rainfall can influence harvest result because every plant has each standard of water amount to grow. If rainfall intensity is too high, then the plant growth will be disturbed or may be died. That rainfall anomaly also can cause harvest failure. If annual precipitation is high, then harvest failure will also high. Based on the precipitation data center to northeast part has the highest annual precipitation amount.
Vegetation covers also influence food vulnerability because the appearance of vegetation cover means that the soil can be planted. Vegetation also decrease flood risk by absorbing water
for photosynthesis and tight caught the soil. So vegetation cover also reduces the amount of erosion. Results show that around 45% central dry zone area comes under very high erosion danger level.
Erosion danger level is influenced by erosivity, erodibility, length and slope index, plant management and soil conservation. Erosivity indicates the power of rainfall intensity that can cause soil to erosion. High intensity of rainfall is increase the possibility of high erosion. Soil erodibility is the sensitivity of a particular type of soil to erosion where it is influenced by soil characteristics, soil thickness and vegetation covers.
Land degradation means soil is too bad for plantation. Land degradation can be caused by erosion and vegetation cover. Degraded land is determined if there is no vegetation cover or only sparse vegetation covers. Around 60% study area affected by middle type of degraded land. Based on the map of degradation Land some parts in the center, border of the area and south part is highly degraded in central dry zone of Myanmar due to highly dry area and hilly sandstone and sandy soil or very less fertile soil.
Food vulnerability map (Fig. 4) show very less area with very resistance food class, only some patches in the study area. A small part of study area is in class of resistance of food vulnerability in the northeast part due to dry area. Around 50% area, maximum in central and north part is come in enough of food vulnerability class; it‟s due to alluvial farming and monsoon rain. Approximately 45% central dry zone area of Myanmar comes under high insecure food vulnerability class. Maximum south part, some patches of center, maximum North West and border part comes in insecure food vulnerability class due to harsh climatic condition and unplanned management and polices. A small part of south west comes in very insecure food vulnerability class. The main cause of this class is high erosion rate, less fertile soil, slope and hilly terrine.
Myanmar has various ecological zones with rice as the main crop. While rice and other crops are the backbone of agricultural production, livestock and fisheries provide protein foods and contribute partially, if not fully, to livelihoods of the rural populations. In the past, hydro-meteorological hazards have affected rice production in many regions in Myanmar and are probably the main triggers of food insecurity. In the most food insecure zones, drought is the major agricultural challenge as indicated in the World Food Programmer‟s [7] Food Security Assessment in Dry Zone in 2011.
a. Alluvial farming an additional influence on sedimentation loads in the river and create new fertile floodplains. Most likely, these processes have a visible impact on alluvial farming in the dry zone because more fertile arable land with good access to irrigation water is available. This is of even higher importance in the light of an increase in dry spells and changed timing of the monsoon rain in the dry zone. Our land use/cover analysis shows an increase in alluvial farming by 1745.33 km2 since 1988. Most of the alluvial farmers grow crops like onions because of market
The International Archives of the Photogrammetry, Remote Sensing and Spatial Information Sciences, Volume XLII-4/W5, 2017 GGT 2017, 4 October 2017, Kuala Lumpur, Malaysia
This contribution has been peer-reviewed.
prices, suitability to alluvial land and short-term benefits (personal communication with citizens of the dry zone). Concurrently, small-scale alluvial farming implies a potentially higher flood risk and related crop failure and loss of yields for the farmers and livelihoods of their families and communities.
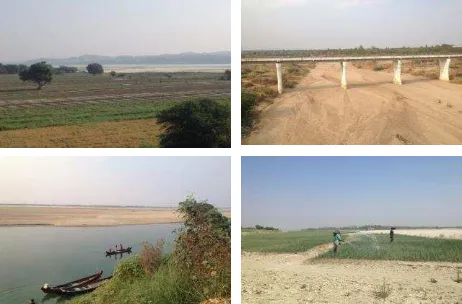
Figure 5. Study area photographs during ground truth and field verification in central dry zone area of Myanmar.
4. CONCLUSIONS
This research work show that food vulnerability modeling is possible by remote sensing and GIS techniques with the help of food vulnerability related parameters. Overall 45% study area comes under very high erosion danger level, 70% under average harvest failure, and 59% intermediate land degradation area, so overall 45% study area comes under insecure food vulnerability zone. Food vulnerability is influenced by the precipitation anomaly, vegetation cover, degradation land, and harvest failure risk.
ACKNOWLEDGEMENT
This work is financially supported by the Russian Scientific Foundation (RSF), grant no. 14-31-00014 “Establishment of a Laboratory of Advanced Technology for Earth Remote Sensing”.
REFERENCES
Boori M.S., Choudhary K., Kupriyanov A., Sugimoto A., Paringer R. (2016a), Land use/cover change detection and vulnerability assessment in Indigirka river basin, Eastern Siberia, Russia. Imnage Processing, Geoinformatics and Information Security. ISSN 1613-0073. Vol. 1638: 270-283. Doi:10.18287/1613-0073-2016-1638-270-283
Boori M.S., Choudhary K., Kupriyanov A. (2016b), Vulnerability analysis on Hyderabad city, India. Computer Optics. ISSN 0134-2452. Vol. 40(5), pp. 752-758.
Doi:10.18287/2412-6179-2016-40-5-752-758
Boori M.S., Choudhary K., Kupriyanov A., Sugimoto A. (2017), Informatics and computation method for inundation and land use study in arctic sea eastern Siberia, Russia. Proc. of SPIE Vol. 10176, 101761D. PP: 01-06.
Doi:10.1117/12.2268153
FAO: FAOSTAT on the UN, Myanmar, Food and Agriculture Organization of the United Nations (FAO),
http://faostat.fao.org/CountryProfiles/Country_Profile/Direct.as px?lang=en&area=28 (last access: 24 September 2015), 2014.
Haggblade, S.; Boughton, D.; Denning, G.; Kloeppinger-Todd, R.; Cho, K.M.; Wilson, S.; Wong, L.C.Y.; Oo, Z.; _an, T.M.; Wai, N.E.M.A.; Win, N.W.; Sandar, T.M. (2013), A strategic agricultural sector and food security diagnostic for Myanmar. Michigan, USA: Michigan State University; Yangon, Myanmar: Myanmar Development Resource Institute – Centre for Economic and Social Development (MDRI-CESD). Available at
http://fsg.afre.msu.edu/Myanmar/myanmar_agricultural_sector_ diagnostic_july_2013.pdf (accessed on July 3, 2015).
JICA (2010), The development study on sustainable agricultural and rural development for poverty reduction programme in the central dry zone of the Union of Myanmar. Report No. RDJR10-502, Japan International Cooperation Agency.
LIFT (2015), LIFT Dry Zone Programme Framework. Yangon, Myanmar: Livelihoods and Food Security Trust Fund (LIFT). Available at
http://www.liftfund.org/sites/liftfund.org/_les/uploads/Dry_Zon e/Dry_Zone_programme_framework_-_24_April_15.pdf (accessed on June 17, 2015).
United Nations Commission on Sustainable Development. Last Update: December 1999.
World Food Programme (2011), Food security assessment in the Dry Zone Myanmar. Rome, Italy: World Food Programme (WFP). Available at
http://home.wfp.org/stellent/groups/public/documents/ena/wfp2 34780.pdf (accessed on June 17, 2015).
World Bank (2014), Myanmar - Ayeyarwady integrated river basin management project. Washington, DC: World Bank Group. Available at
http://documents.worldbank.org/curated/en/2014/11/20394428/ myanmar-ayeyarwady-integrated-river-basin-management-project (accessed on June 22, 2015). 2014