13
Maria Praptiningsih
Faculty of Economics, Petra Christian University Jl. Siwalankerto 121-131 Surabaya 60263
E-mail: [email protected]
ABSTRACT
Penelitian ini memiliki tiga tujuan. Pertama, untuk menganalisis apakah Teori Portfolio Modern dapat diaplikasikan dalam pengambilan keputusan yang dilakukan oleh investor guna meningkatkan profit melalui aktivitas investasi, khususnya di Pasar Modal Indonesia. Kedua, untuk menguji bagaimana perilaku tiap aset berdasarkan konsep Capital Assets Pricing Models melalui pengukuran varian, kovarian, korelasi, serta parameter yang lain. Ketiga, untuk menentukan model portfolio yang terbaik, yaitu menghasilkan return yang tinggi pada suatu tingkat resiko tertentu atau tingkat resiko yang paling rendah pada tingkat return tertentu. Hasil-hasil penelitian menunjukkan tiga saham yang terdaftar di Bursa Efek Indonesia memiliki hubungan positif dengan market return; reaksi investor terhadap masing-masing saham tidak saling berkaitan; model portfolio yang digunakan menghasilkan varian atau resiko semakin kecil; dan expected rate of return mencapai 2,2 persen pada tingkat deviasi antara 8,8 persen sampai 9,2 persen.
Kata Kunci: alokasi aset, teori portfolio modern, seleksi portfolio
ABSTRACT
This study has three objectives. First, we investigate whether Modern Portfolio Theory can be applied on the financial decisions that made by investors or individual in order to increase their wealth through investment activities. Second, we examine the real behavior of each asset in terms of capital assets pricing models. Third, we determine whether our portfolio is the best model to produce a higher return in a given level of risk or a lowest risk in a particular level of return. It is found that three different stocks listed in the Indonesia Stock Exchange have a positive relationship with market returns. The reactions of the investor regarding these stocks are not influenced by each other. Lastly, the minimum variance portfolio (MVP) point which represents the single portfolio with the lowest possible level of standard deviation, occurs when the expected return of portfolio is approximately 2.2 percent at a standard deviation of 8.8 percent.
Keywords: asset allocation, modern portfolio theory, portfolio selection
INTRODUCTION
A fundamental question in finance is how the risk of an investment should affect its expected return (Perold, 2004). In order to answer this basic question, we should be able to identify and analyze theories and concepts that supported the question particularly. Nevertheless, before we get started to discuss the theory, we will describe the background of invest-ment activity including portfolio selection theories and concepts by utilizing expected rate of return, standard deviation, and other indicators.
The aim of this paper is to analyze how the Modern Portfolio Theory can be applied on the financial decisions that made by investors or individual in order to gain a profit and increase their wealth through these particular investment activities
for investors to be able to calculate the investment risks, which is represents by standard deviation, also the weights and the minimum variance of portfolios in order to gain an expected rate of return. In addition, the investors should be able to analyze the results and utilize it to produce investment decisions. Therefore,
the paper’s results will beneficial to investors who
willing to invest in the Indonesia Stock Exchange particularly and contribute recommendations to policy makers who actively organized and responsible to capital markets in Indonesia.
This paper divided into six sections. Firstly, we describe background of the paper and purposes of this study. Secondly, we provide the literature review concerning the modern portfolio theory and its expansion, started with Harry Markowitz studied, followed by Brinson, Randolph & Beebower (1986) and many other studies that can confirm and strengthening our discussions. Thirdly, we describe our methodology started with asset allocation and portfolio choices, which is including the data of each assets, the limitation of the length of period, the analysis tools, and how its interpretations. Fourthly, we will observe from the characteristics of each asset in our portfolio; calculate its variance, covariance, correlations, expected rate of return; drawing the isoexpected return line, isovariance ellipses, and critical line; identifying the minimum variance set and efficient set; and examine the most valuable positions in our portfolio. Fifthly, we explain the results and describe how its mechanism works in stock market particularly. Lastly, we determine our conclusionsand recommendations.
LITERATURE REVIEW
As we pointed out earlier, we are concern in discussing the investors or individual willingness to have a portfolio in order to gain the most profitable investment. There are many indicators, which inves-tors should consider to get the highest return in a given level of risks. For example; the total wealth that investors have to put into a portfolio; the price of each asset in a capital market; the risk of each asset; the expected return; the magnitude of the cause and effect between the returns of asset and the returns of market.
The Minimum Variance and Efficient Sets
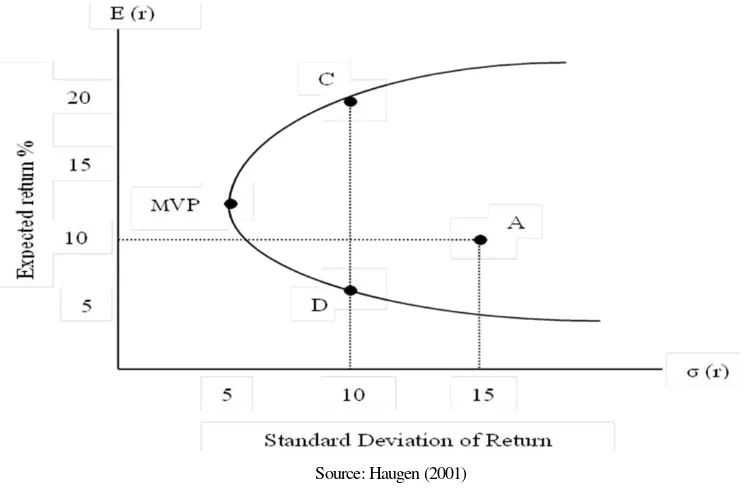
Given the level of risk or standard deviation, investors prefer positions with higher expected rates of return; given the level of expected return, investors prefer positions of lower risk. In any case, given the characteristics of the available populations of stocks, the investment opportunity set has a parameter that is represented by the bullet-shaped curved. This curve is also called as the minimum variance set (Haugen, 2001). Each point on the minimum variance set represents a portfolio, with portfolio weights allocated to each of the stocks in the population. Therefore, each of the portfolios in the minimum variance set meets the following criterion: given a particular level of expected rate of return, the portfolio on the minimum variance set has the lowest standard deviation (or variance) achievable with the available population of stocks. The following is the figure of minimum variance set.
Source: Haugen (2001)
Figure 1 presents the relationship between expected rate of return and standard deviation. Haugen (2001) stated that the minimum variance set can be divided into two halves, a top and a bottom. The halves are separated at the point MVP. This point represents the single portfolio with the lowest possible level of standard deviation. The most desirable portfolios for us to hold are those in the top half of the bullet. The most undesirable are those in the bottom half. The top half of the bullet is called the efficient set. All the portfolios in the efficient set should meet the following criterion: given a particular level of standard deviation, the portfolios in the efficient set have the highest attainable expected rate of return. Thus, the portfolio C and D both meet the criterion for the minimum variance set (lowest standard deviation, given expected return), only C meets the criterion for the efficient set (highest expected return, given standard deviation). Portfolio D actually has the lowest expected return, given its standard deviation level. Nevertheless, the most preferable point is the MVP point.
The Isoexpected Return Lines
In order to find a set of portfolios which have the same expected rate of return, we should determine the weight of each stock in portfolios. The weights for these portfolios are given by one of the isoexpected return lines. The formula for the expected return on a three-stock portfolio are:
( ) ( ) ( ) (
) ( ) (1)
The lines are drawn in space and the following relationship with intercept and slope can be expressed as:
(2)
The formula of intercept :
( ) ( )
( ) ( ) (3)
and the formula of slope :
( ( ) ( ) ( )) (4)
Thus, the value of the intercept depends on the desired expected rate of return on the portfolio. If we want to see the combinations of weights that are consistent with a different value for the portfolio expected return, we must look to a different isoex-pected return line. In general, however, the slope and relative position of the isoexpected return lines are dependent on the relative expected returns of the three stocks considered. In the analysis, the paper utilizes all
the formula in order to determine the highest expected rate of return including the portfolio weights in a given level of risk.
The Isovariance Ellipses
In order to find a set of portfolios which has the same variance of return, we also should determine the weight of each stock in portfolios. The portfolio weights for members of this set are given by one of the isovariance ellipses. As with the isoexpected return lines, there is a family of these ellipses, each representing a different level of portfolio variance. In order to find the isovariance ellipse representing a given level of portfolio variance, we utilize the equation of the variance for a three-stock portfolio:
( ) ( ) ( ) (
) ( ) ( )
( ) ( )
( ) ( ) (5)
As smaller values for the portfolio variance are selected, the ellipses become smaller and smaller in size, converging on the point labelled MVP. This point represents the lowest possible portfolio variance level achievable, given the covariance matrix for the three stocks.
The Critical Line
The critical line shows the portfolio weights for the portfolios in the minimum variance set. The critical line can be found by tracing out the points of tangency between the isoexpected return lines and the isovariance ellipses. It is important to recognize that the critical line represents all the portfolios in the minimum variance set. In the analysis, the paper also determine the critical line in order to find the combination of weights in the portfolio.
There were some papers discussed about the portfolio selection and the result of expected rate of return at a givel level of risk. In his study, Markowitz (1952) considered the second stage on the process of selecting a portfolio, started with the relevant beliefs about future performances and ends with the choice of portfolio. Firstly, he considered the rules that the investor had maximized discounted expected returns. This rule was rejected both as a hypothesis to explain, and as a maximum to guide investment behavior. Secondly, he considered the rule that the investor had (or should) considered expected return a desirable thing, both as a maximum for, and as hypothesis about, investment behavior. He illustrated geometri-cally relations between beliefs and choice of portfolio
(E-V) rule. The result of Markowitz study stated that in order to use the E-V rule in the selection of securities, we must have procedures for finding reasonable expected return and variances. Therefore, the set of efficient E-V combination could be com-puted then the investor could select the combination he preferred, and the portfolio, which gave rise to this E-V combination, could be found.
Using an exploratory empirical study, Cardozo & Smith (1983) evaluated whether financial portfolio theory could be applied to design and management of
an organization’s portfolio of products and services.
They found that return and risk measurements of product-market investments demonstrate a high posi-tive covariance, and thus are candidates for use in a consistent constrained optimization approach similar to that developed in modern portfolio theory. Accor-dingly, these results indicate that it is possible to create the product portfolio equivalent of an efficient frontier by nonlinear optimization techniques familiar to both investment theory and operations research.
Similar with Markowitz, study of Brinson, Randolph & Beebower (1986) found the following: an asset allocation, which is how your portfolio is split into different asset classes, accounts for 94% of investment returns. A security selection, that is picking which stock or bond to invest in, accounts for 4% of investment returns. Market timing, which is trying to pick the right moments to get in and out of investments, accounts for 2 percent of investment returns. This research had validated Modern Portfolio Theory, by Markowitz and these findings have a profound impact on how financial professionals should create investment portfolios for their clients.
In further study, Simaan (1993) developed a three-moment framework for portfolio selection that resembles the simplicity and the intuitive appeal of the mean-variance model. In addition, given the results of the normative model, a three-factor capital asset pricing model is developed with the existence and the non-existence of the riskless asset. The expected return on the latter two zero-beta funds and the expected on the market portfolio determine the prices of variance risk and skewness in the capital
market. The individual asset’s risk premium is
determined by its exposure to the variance and the skewness of the market portfolio and the market prices of variance and skewness risk. It is also shown that the sign of skewness premium cannot be determined for all risk-averse investors.
Meanwhile, Pastor (2000) stated that the goal of portfolio selection is to find an optimal allocation of wealth across a number of assets. Under the capital asset pricing model, the market portfolio is the single benchmark, and is therefore the optimal portfolio of every investor.
RESEARCH METHODOLOGY
The methodology section is divided into three subsections. The first subsection lays out the data sources that are used in this study, including the restrictions, which is, become one of the limitations of this following study. The second subsection describes the portfolio selection process, started with the relevant beliefs about future performances; describe the main argumentation of choosing those three stocks into a portfolio, identifying the characteristics of each stock, and ends with the choice of portfolio. The last subsection isthe research method and the technical analysis used in this paper.
Data Sources
The data used in this study is obtained from the Indonesia Stock Exchange (IDX) Monthly Statistics in 2008, which contains the closing price of each stock on the portfolio. This study is required to meet three conditions: (a) there are three stocks in portfolio that are represents the risky asset, therefore the study assumed that there are no risk-free assets, (b) each stock indicates different industry in order to represent the complexity of the industry background including its characteristics, and (c) the length of the data is five years from 2003–2008, which contains monthly data.
Portfolio Selection
Based on the data that is provided by the Indonesia Stock Exchange, the study uses the LQ45 Index that is announced quarterly for the period of carefully chosen, liquidity being the main indicator as it is considered a solid performance criterion and a reflection of a market’s true value. Once selected, these stocks are closely monitored and their quarterly performance is evaluated.
The paper chooses three different stocks which is represent the different industry and its charac-teristics. These three different stocks have good performance in the market. The stock price of each stock shows a positive trend and tend to increase over time. According to this evidence, the paper attempt to
utilize these stocks as a representative of investor’s
com-panyis Semen Gresik (Persero) Tbk, which has a security code called SMGR. The main business is on the chemicals sector and has the sub sector in cement production. Third is Bank Negara Indonesia Tbk or usually called BBNI. The core business of this company is on the financial sector which focuses on banking industry. All three stocks that are issued by those companies are included in the LQ45 index and have a good performance in liquidity and capitali-zation. These indicators become our main factor in selecting the assets in order to construct a portfolio.
Technique Analysis
The paper utilizes a case study method in order to analyze the portfolio selection based on the phenomenon that had happened. In addition, the paper using a quantitative and qualitative analysis in order to construct the most efficient portfolio model including the argumentations of those models. The paper also utilizes all formulas in calculating para-meters and observe the results as a part of the imple-mentation of the theory. The paper uses the basic parameters to analyze the performance of portfolio allocation that consists of the expected return, variance, and covariance, as a numerical and graphi-cal approach. Based on those graphi-calculations and figures, in further we can observe the behavior of portfolio and its profitability. In the last part, we can conclude whether the asset allocation in a portfolio could maximize the profit of the investor and result some suggestions for the investment activities.
RESULTS AND DISCUSSIONS return and the variance of each stocks and portfolio. We can observe that each stock has a very small amount of return. For TLKM the expected rate of return is 2.39 percent, SMGR has 3.56 percent, and BBNI has the smallest 0.09 percent as in individually stock. However, as a portfolio we gain 2.71 percent rate of return. As we can see from the result, the rate of return of portfolio relatively smaller than each stock of TLKM and SMGR particularly, because the effect of BBNI return.
In addition, we have a relatively small variance in portfolio, rather than the variance in each stock,
which is 0.0032. If we look into each stock, the variance of TLKM is 0.0059, SMGR is 0.0124, and BBNI is 0.0219. We are notice that as a portfolio the variance become relatively smaller, and it is a good indicator on investment activity because the variance and the standard deviation are represent the risk of our portfolio.
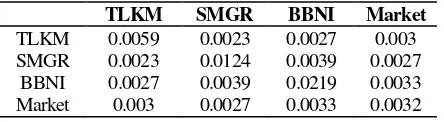
Table 2 presents the result of covariance matrix. As we already learn that, as a number, the covariance does not explain much about the relationship between the returns on the two or three stocks. In this case, since it is a positive number, so that when one stock produces a return above its mean return, the others tends to do so.
are realize that each stock in our portfolio comes from different industry or sector, TLKM represent the telecommunication sector, SMGR represent the cement industry, and BBNI represent the banking sector. Each sector has a specific variable that can affect significantly on its return or correlations. As in macroeconomics point of view, the cement sector represents the real sector, which is influenced by fiscal policy and banking sector represent the monetary sector, which is influence by monetary policy, in common approach.
Table 4 and Table 5 presents the results of beta and intercepts of the isoexpected return lines. It will generates some possible isoexpected return lines which is given in the Figure 2.
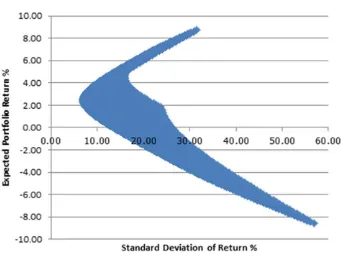
Figure 1 presents the minimum variance set results. The portfolios in the minimum variance set should meet the following criterion: given a particular level of expected rate of return, the portfolio on the minimum variance set has the lowest standard deviation (or variance) achievable with the available population of stocks. From the figure above, we can find the global minimum variance portfolio, which is shows, the single portfolio with the lowest possible level of standard deviation, or it is called MVP point. This point occurs when the expected rate of return of portfolio approximately 2.2 percent at a standard deviation of 8.8 percent. From the MVP point or the
top half of the bullet in minimum variance set, we found the efficient set. All the portfolios in the efficient set meet the following criterion: given a particular level of standard deviation, the portfolios in the efficient set have the highest attainable expected rate of return. In contrast, the most undesirable are those in the bottom half the bullet.
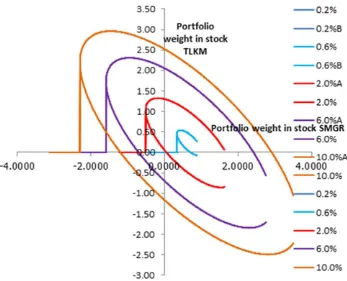
Figure 2 presents the isoexpected return lines results. All colored lines represent the possible expected rate of return. Nevertheless, the result of MVP point shows that the most possible expected rate of return in a given level of standard deviation is approximately 2.2 percent. The light blue line in Figure 2 is the 2 percent expected rate of return which has the weight combination along in the line. Suppose we moved the light blue line sligthly to the right (northeast) and achieve the level of 2.2 percent of expected rate of return, we will find the wights combination of all three stocks.
Figure 3 shows isovariance ellipses results. The isovariance ellipses represent points of constant variance, instead of altitude, with the MVP point positioned at the bottom of a valley rather than at the top of hill. In the figure above, we can not found the MVP point clearly because of the limitation of the data. Nevertheless, the result of this isovariance ellipses are beneficial in constructing the next step which is the critical lines.
Source: Author (processed)
Source: Author (processed)
Figure 2. Isoexpected Return Lines Results
Source: Author (processed)
Source: Author (processed)
Figure 4. Critical Lines Results
Source: Author (processed)
In order to construct the critical line, we first analyze the isoexpected return line and isovariance ellipses. First steps are assuming the value of each portfolio weight and then calculate the line of isoexpected return. Second steps are constructing the isovariance ellipses by assuming a certain level of isoexpected return line. Lastly, we get the critical line by tracking out the points of tangency between the isoexpected return lines and the isovariance ellipses.
As we can see from Figure 4, it is not easy to construct and determine which absolute point that is the MVP in a critical line. Nevertheless, our critical line tries to represent the most valuable point which is become our objective during this study. The light blue ellipse which is the smallest one become our consi-deration in order to determine the most possible point. Therefore, the MVP point should be positioned along the tangency between the smallest ellipse and the critical line.
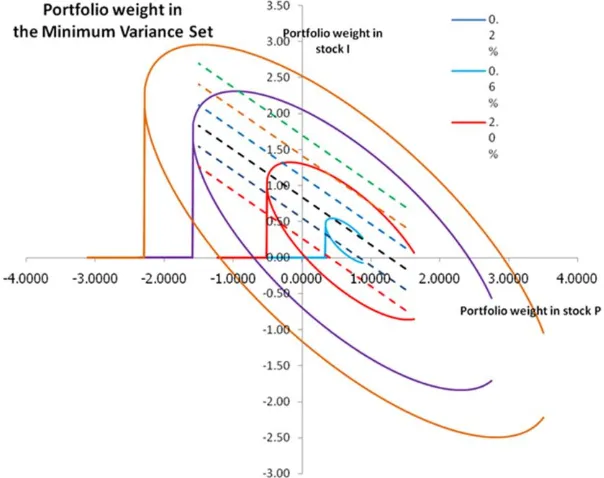
Figure 4 presents the minimum variance port-folio results. All positions inside the triangle represent portfolios where we have invested positive amounts of money in each of the three stocks. According to the previous result of the MVP point which is 2.2 percent of expected rate of return, it can be seen on Figure 4. The dark blue line is the approximately 2 percent isoexpected return line. Eventually, where the purple line which is the critical line passes through the horizontal axis, we begin to sell both TLKM and BBNI short and use the proceeds to invest in SMGR. The MVP point which is on the blue area (Figure 4) shows that we should invest approximately 20 percent in SMGR (stock P), 80 percent in BBNI and short selling in TLKM (stock I). This result become one of the preferable investment decision that might be applied in Indonesia Stock Exchange. Nevertheless, the results are depend on the research period of observation. Therefore, the investors should be able to utilize empirical study and historical data in order to analyze and predict the behavior of stocks in the stock market particularly.
CONCLUSIONS AND RECOMMENDATIONS
According to all results and discussions during this study, we realize that this paper has many limitations and might be less accurate to be applied on the real capital market, particularly in portfolio selection and asset allocation concepts. However, we found some conclusions that could be applied in real capital market and there are clearly many areas of research object for future research.
1. The portfolio selection process needs a judgment
and accurate future’s prediction, using the basic
parameter in portfolio tools and empirical study. The portfolio in this research might not be the best portfolio model in order to generate high return.
Nevertheless, the result of portfolio selection is vary depends on many factors such as the characteristics of industry background, the performance of the stocks, and other external factors including the economic fluctuation. 2. TLKM, SMGR, and BBNI have a positive
direction or relationship with the market return. Therefore, the investors should consider this portfolio in order to gain the maximum return. When the market return tends to increase, the portfolio return tends to increase particularly. However, the investors should consider also the weight of their portfolio, because it is become a crucial part on investments. The research found the expected rate of return of the portfolio is approximately 2.2 percent at a given level of standard deviation which is approximately 8.8 percent. The paper also found that the investors should invest approximately 20 percent in SMGR, 80 percent in BBNI and short selling in TLKM. This result also implies that the portfolio selection should be considered carefully. When we choose the three different stocks, we assumed that all stocks are risky, different industry and have good performance on stock price. According to those assumptions, the different industry might be the main problem that affect the weight combination. This result also shows that in the period of research which is from 2003-2008, the volatility of each stock price might be affected by the volatility of macroeconomy. This volatility generates potential risks that could affect the standard deviation of portfolio.
3. The diversifications of assets become a better way to minimize the risk of assets. Even though this study chooses all risky assets in portfolio allocation; the result found that the risk of portfolio was relatively small. It means by choosing the assets, which is, comes from different industry, it will spread the potential risk, and therefore the investors could optimizing the return. Nevertheless, the investors needs to keep cial Analysts Journal, 7(8): 39-44.
]
Haugen, R. A. 2001. Modern Investment Theory. Fifth Edition. New Jersey: Prentice Hall.
Indonesia Stock Exchange. 2008. IDX Monthly Statis-tics. 17(8).
Indonesia Stock Exchange. 2008. LQ45 Index Quar-terly Announcement. Jakarta: Indonesia Stock Exchange.
Indonesia Stock Exchange. 2009. LQ45 Index Quar-terly Announcement. Jakarta: Indonesia Stock Exchange.
Markowitz, H. 1952. Portfolio Selection. The Journal of Finance, 7(1): 77-91.
Pastor, L. 2000. Portfolio Selection and Asset Pricing Models. The Journal of Finance, 55(1): 179-223.
Perold, A. F. 2004. The Capital Asset Pricing Model. The Journal of Economic Perspectives, 18(3): 3-24.