ISLANDS ON THE VERGE OF EXTINCTION –
THE EXAMPLE OF ZADAR ISLANDS, CROATIA
VERA GRAOVAC UDC: 911.3:314.87(497.5-37 Zadar) Department of Geography, University of Zadar Original scientific paper Odjel za geografiju, Sveučilište u Zadru Izvorni znanstveni članak
Primljeno: 2004-09-08 Received:
This paper analyzes demographic trends on Zadar islands in 20th century, with particular interest in the period after the Second World War. The Croatian islands have been emigrational areas for over a century, but the emigration intensified considerably after the war, and later on coupled with constant natural decrease the islands started experiencing depopulation that has continued until today. The aim of this paper is to establish the intensity of depopulation on Zadar islands and determine which settlements and islands are the most threatened by extinction. The analysis was made by comparing several selected indicators and it included 16 islands and 57 settlements. The results showed that the most threatened were the remoter islands, regardless of their size, with poor traffic connections to the mainland.
Ključne riječi: Zadar islands, Croatian islands, depopulation, population decrease, natural decrease, emigration, population aging.
U ovom radu analiziraju se demografski trendovi na zadarskim otocima tijekom 20. st. s osobitim osvrtanjem na razdoblje nakon Drugoga svjetskog rata. Hrvatski su otoci emigracijska područja već više od stotinu godina, ali emigracija se posebice intenzivirala nakon rata i kasnije je zbog dugogodišnjeg iseljavanja i negativne prirodne promjene započeo proces depopulacije otoka, koji se nastavio do danas. Cilj je ovoga rada utvrditi intenzitet depopulacije na zadarskim otocima i utvrditi koja su naselja i otoci najugroženiji i kojima prijeti izumiranje. Analiza je napravljena uspoređujući nekoliko odabranih pokazatelja i obuhvaćala je 16 otoka i 57 naselja. Rezultati su pokazali da su najugroženiji udaljeniji otoci, bez obzira na veličinu, koji su ujedno i vrlo slabo prometno povezani s kopnom.
Key words: zadarski otoci, hrvatski otoci, depopulacija, smanjenje broja stanovnika, negativna prirodna promjena, emigracija, starenje stanovništva
Introduction
In the last several decades demographic situation in Croatia has been a research topic for many scientists of different profiles – geographers, demographers, economists, planners etc., but lately it has also been of a concern of the general public. The most prominent demographic process in Croatia is depopulation, which differs regionally.
Among the areas most severely affected by depopulation are Croatian islands. The main factors that caused depopulation of the islands are primarily a long-term emigration, which was later followed by a long-term natural decrease. Croatian islands have been emigrational areas for over a century. Emigration from the islands assumed mass characteristics in the last decades of the 19th century, it continued throughout the 20th century (LAJIĆ, 1989) and is still present now, at the beginning of the 21st century.
Majority of these migrations were stimulated by unfavourable economic situation on the islands. Emigrations at the end of the 19th century and at the beginning of the 20th century were mostly caused by overpopulation, wine-growing crisis, farmers’ debts etc. (LAJIĆ, 1989) and most of the emigrants went overseas (North and South
America, Australia). At first, the negative effects of emigration were not particularly emphasized, but its postponed effects came to light in mid-20th century and later. During these emigration waves the islands were characterized by overpopulation (unfavorable ratio between the population number and arable land), so the loss of population was not very worrying, because the number of inhabitants had constantly been increasing due to significant natural increase. However, the negative consequences of these migratory movements revealed themselves a few decades later through decreased number of young male population (who made up most of the migrants), decreased birth rates and reduced labour force.
It was only after the First World War that the population number started decreasing, but emigration did not cease, moreover, it continued and it is present even today, but its direction changed. With the occurrence of immigration quotas in overseas countries, the emigration waves were directed toward the European countries and cities on the Croatian coast. Traditionally, the most important economic activity on the islands was agriculture, but the lack of arable land and other resources for developing insular economy were powerful push factors that stimulated emigration together with pull factors present on the mainland, such as fast industrialization, demand for labour force, better living conditions and standard. This emigration did not reflect itself only in slow increase of population or population decrease, but it also influenced age and sex composition of the population, fertility and nuptiality. Namely, selective character of the migrations was evident – most of the migrants were young people whose leaving meant less people in reproductive age (directly affecting future reproduction on the islands) and reduced labour force (directly affecting future economic development).
Due to their specific demographic development the Croatian islands have been a research topic of many scientific research and papers written in the last few decades, mostly by demographers, geographers, economists, sociologists etc. (BABIĆ ET AL.,2004, ČUKA,MAGAŠ,2003,FRIGANOVIĆ,1962,1974,LAJIĆ,1986,1989,1995,1997,LAJIĆ ET AL.,2001,MAGAŠ,FARIČIĆ,1999,2000,2002,MIKAČIĆ,1987,NEJAŠMIĆ,1991a,1992,
1997,1998,STRGAČIĆ,1994).Of course, besides analyzing general demographic trends
on the islands, some of the authors analyzed different groups of islands, but with different methodologies, especially when classifying certain groups of islands.
However, the emigration and depopulation are not characteristic only for Croatian islands. There are many examples from world literature that evidence similar problems and concerns over emigration in several European islands date back many centuries. As early as 1422 legislation existed in the Isle of Man to prevent emigration, whilst in the Azores and Canary Islands emigration to Spanish America had started before the end of the 17th century (ALDRICH, CONNELL, 1998). There are also some other
examples of depopulation of many other islands around the world, and in some cases to such extent that it provoked fears of almost complete depopulation. But, in the second half of the 20th century tourism allayed such fears and a number of island groups (e.g. US Virgin Islands, St Maarten, the British Virgin Islands, and subsequently Anguilla, Montserrat, Bonaire and the Turks and Caicos) made transition from being islands of emigration to places of immigration (MCELROY, DE ALBUQUERQUE, 1988). Tourism, and
subsequently retirement migration, brought similar population turnarounds outside the Caribbean, primarily in the Mediterranean and some of Britain's offshore islands such as the tax havens of Jersey, Guernsey and the Isle of Man. But, these were elite not mass migrations. On a very different scale, the 1950s, 1960s and 1970s marked a new era of emigration in many island realms. The "long boom" created a demand for labour in metropolitan states, and accelerated incipient processes of migration from distant, mainly colonial territories (migrants from Caribbean islands in Britain, Polynesians in New Zealand, migrants from different islands around the globe to France, Denmark, The Netherlands, the United States etc.) (CONNELL,KING, 1999).
It is also important to mention that insularity is not merely a geographical concept. It is in essence a complex idea that incorporates distance, centre-periphery relationships, technology, political and economic decisions, external and internal information flows, physical characteristics of topography, soils and climate affecting the resource base, and social and cultural patterns. It is as much a state of mind as it is an objective reality (MARSHALL, 1999).
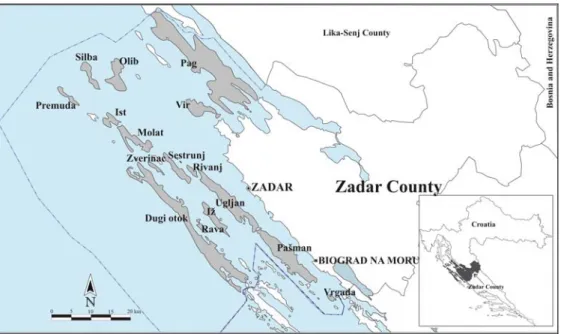
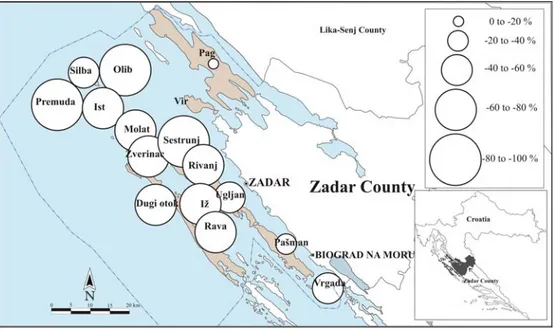
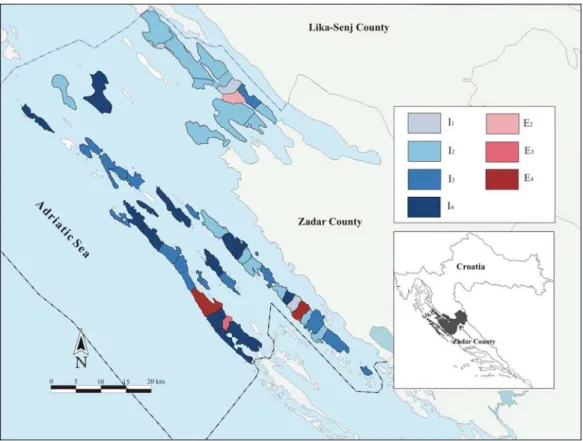
Fig. 1 Inhabited islands of Zadar County Sl. 1. Naseljeni otoci Zadarske županije
Aims and methodology
The aim of this paper is to contribute to the knowledge on contemporary demographic development of Croatian islands by thoroughly analyzing demographic features of Zadar islands as one group of Croatian islands, and to determine the intensity of depopulation processes. As it has been stated previously, different authors employed different classifications of Croatian islands depending on the type of analysis, so for example, Nejašmić (1991) divided the islands into four groups: Kvarner islands (Krk, Cres, Lošinj, Rab and adjacent smaller islands), North Dalmatian islands (Zadar and Šibenik islands – from Pag Island in the north to Krapanj Island in the south), Central Dalmatian islands (from Mali Drvenik Island in the north to Hvar and Vis Islands in the south) and South Dalmatian islands (from Sušac to Koločep). On the other hand, Lajić
(1995) divided them into only two groups: Kvarner islands and Dalmatian islands; Friganović (2001) into Kvarner islands and Dalmatian islands, then into Kvarner islands, North Dalmatian islands, Central Dalmatian islands and South Dalmatian islands, small and big islands etc.
In this paper the author will divide the islands into five groups: Kvarner islands, Zadar islands, Šibenik islands, Split islands and Dubrovnik islands. The main criteria for dividing the islands are county boundaries, so the first group includes the islands belonging to Primorje-Gorski kotar and Lika-Senj Counties, Zadar islands include those belonging to Zadar County, Šibenik islands are those belonging to Šibenik-Knin County, Split islands are those within Split-Dalmatia County boundaries and finally, Dubrovnik islands are those that belong to Dubrovnik-Neretva County. The only disputable island is Pag Island because its northern part belongs to Lika-Senj County and the rest of the island to Zadar County. The problem is that the authors who have dealt with demographic development of particular group of islands, e.g. Zadar islands or Kvarner islands, usually omitted Pag Island from their analyses, so the author of this paper considers that it is justified to divide Croatian islands into the above-mentioned groups in order to make a thorough analysis. Following this methodology, the analysis of Zadar islands in this paper will include 16 islands: Pag (i.e. the part that belongs to Zadar County), Vir, Olib, Silba, Premuda, Ist, Molat, Rivanj, Sestrunj, Zverinac, Ugljan, Iž, Rava, Dugi Otok, Pašman and Vrgada (Fig. 1). The total number of settlements on these islands is 57. However, there is another small island (Ošljak), but it is analyzed within Ugljan Island, because in some official statistics data it is considered as a part of the settlement of Preko on Ugljan Island, so it is not possible to extract the data for this island only.
Since the islands have been losing their population continuously, especially after 1960s, some of the settlements and islands, particularly the smaller ones, are severely affected by depopulation and are faced with extinction. In view of these facts, the purpose of this paper is to present the exact indicators that reveal the present demographic situation on the islands and their future likewise.
The most important indicators that will be included in the analysis are: number of inhabitants, birth and death rates, age and sex composition, annual growth rate, age-dependency ratio, proportion of young and old population, with particular interest in the period from 1971 to 2001. The result of the analysis will show on which islands the demographic situation is the worst and which settlements and islands are on the verge of extinction.
As there were certain differences in census methodologies, there was a need to adjust them. The most important difference is between 1991 and 2001 censuses and it concerns people who had official residence in Croatia, but lived abroad. Namely, according to 1991 census all those people who had official place of residence in Croatia, but had lived abroad for several years were considered as permanent inhabitants of Croatia. In contrast, according to 2001 census only those who had been living abroad up to one year were considered permanent residents. So in order to adjust these two censuses, the author excluded those living abroad when referring to number of inhabitants in 1991, particularly because the number of these so-called "foreigners" was significant in 1991.
Population development of Zadar islands
Croatian part of the Adriatic Sea comprises 79 islands, 525 islets and 642 rocks (DUPLANČIĆLEDER ET AL., 2004), but only 47 islands and islets are inhabited. According
to the last population census from 2001, insular population comprised only 2.7% of the total population in Croatia. Population of Zadar islands comprises 15.8% of the total insular population (compared to Kvarner islands that comprise 34.6%, Šibenik islands 5.2%, Split islands 28.7% and Dubrovnik islands 15.6%). The largest settlement on Croatian islands is Mali Lošinj with 6,295 inhabitants, while the smallest ones are Sv. Andrija (one inhabitant – the lighthouse keeper) and Male Srakane and Vidalići (two inhabitants). As for the Zadar islands, the largest and the smallest settlements are Pag (2,701 inhabitants) and Kolanski Gajac (16 inhabitants) respectively, both on Pag Island. Just the look on the insular landscape clearly indicates that the islands are affected by retrograde processes, and the statistics and research prove that the islands are seriously affected by depopulation (NEJAŠMIĆ, 1991a).
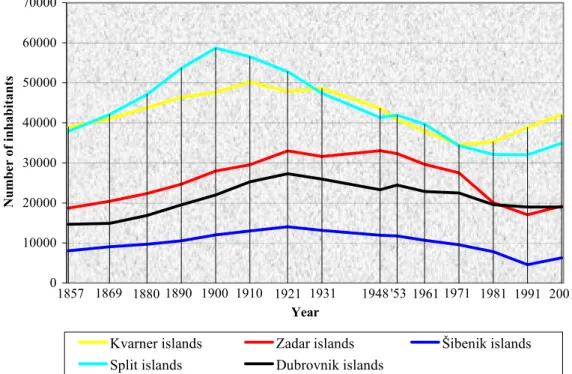
Until the beginning of the First World War the number of inhabitants on all groups of islands was increasing (with the exception of Split Islands) despite the emigrations that initiated in the mid-19th century and continued throughout the 20th century (Fig. 2). The first official population census on the territory of the Republic of Croatia was taken in 1857 and according to it Zadar islands had 18,718 inhabitants. Until the first census after the Second World War in 1948 the number of inhabitants on Zadar islands was mostly increasing, in fact, it increased by 76,5% (Tab. 1). Three islands in the north, farthest from Zadar (Olib, Silba and Premuda) were the only ones to record population decrease, while the rest of the islands had population increase, and some even tripled their population. The increase would have been much higher if there were no long-term emigrations and reduced birth rates, but the increase would also have been much slower if the birth rates at that time had not been as high as they actually were.
The economy of the islands was well behind the economy of the mainland and of overseas countries, which experienced lack of labour force (especially unskilled labour force). This was the most powerful push factor for the islanders to emigrate, but there were also some other, including political reasons (evading military service in the First World War) and social and psychological reasons (desire to live on the mainland) (BABIĆ
1857 1869 1880 1890 1900 1910 1921 1931 1948 '53 1961 1971 1981 1991 2001 0 10000 20000 30000 40000 50000 60000 70000 Year N u mb er of inhabitants
Kvarner islands Zadar islands Šibenik islands Split islands Dubrovnik islands
Fig. 2 Population trends on Croatian islands in the period 1857-2001 Sl. 2. Kretanje broja stanovnika na hrvatskim otocima 1857.-2001.
After the Second World War the reasons for emigrating changed to a certain extent. Namely, the towns on the mainland experienced stronger economic and social development due to industrialization, and as such they were in need for labour force. On the other hand, the islands remained underdeveloped in comparison to the mainland, because the most important sector of insular economy were still autarkic agriculture and fishing, which could not ensure stronger economic development.
Migrations before the First World War showed selectivity according to sex – most of the emigrants were young men. Of course, this long-term emigration of young male population negatively affected sex composition of the population and fertility. The intention of part of these overseas emigrants was to find a job in a new country and make provisions for the arrival of their families. The other part of them did not have the intention to stay in a new country forever, but to earn enough money to provide better life for their families back home and to return home eventually.
After the Second World War the emigrations were not so selective – both sexes participated equally, and these emigrations had different effects on life on the islands. Due to fast industrialization of Zadar after the war there was an increased need for labour force, so part of the population from the surrounding areas, including the islands, moved to Zadar. So, the migrations in this period were mostly short-distance, and men did not make up most of the migrants. Women also had opportunities for employment,
particularly in textile industry. In this post-war period negative trends that had begun at the end of the 19th century continued, but they were additionally worsened by low natural increase or even decrease. Migrations do not only affect the spatial distribution of the population but also the number of inhabitants, components of natural increase (birth and death rates) and population structures (NEJAŠMIĆ, 1991b).
As it has been stated previously, despite the significant migrations, the number of inhabitants was increasing until mid-20th century due to high birth rates and natural increase, but the negative effects of these migrations emerged in the second half of the century.
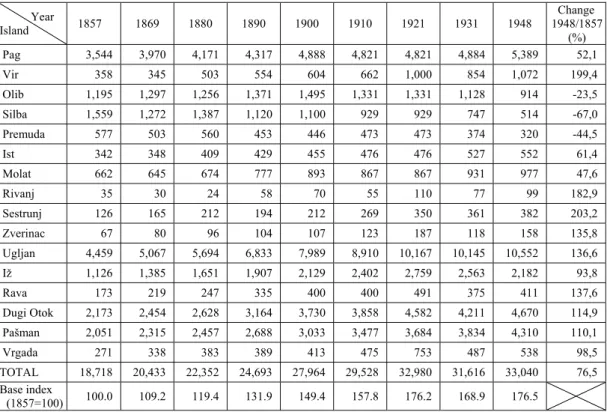
Tab. 1 Number of inhabitants on Zadar islands from 1857 to 1948 Tab. 1. Kretanje broja stanovnika zadarskih otoka 1857.-1948. godine
Year Island 1857 1869 1880 1890 1900 1910 1921 1931 1948 Change 1948/1857 (%) Pag 3,544 3,970 4,171 4,317 4,888 4,821 4,821 4,884 5,389 52,1 Vir 358 345 503 554 604 662 1,000 854 1,072 199,4 Olib 1,195 1,297 1,256 1,371 1,495 1,331 1,331 1,128 914 -23,5 Silba 1,559 1,272 1,387 1,120 1,100 929 929 747 514 -67,0 Premuda 577 503 560 453 446 473 473 374 320 -44,5 Ist 342 348 409 429 455 476 476 527 552 61,4 Molat 662 645 674 777 893 867 867 931 977 47,6 Rivanj 35 30 24 58 70 55 110 77 99 182,9 Sestrunj 126 165 212 194 212 269 350 361 382 203,2 Zverinac 67 80 96 104 107 123 187 118 158 135,8 Ugljan 4,459 5,067 5,694 6,833 7,989 8,910 10,167 10,145 10,552 136,6 Iž 1,126 1,385 1,651 1,907 2,129 2,402 2,759 2,563 2,182 93,8 Rava 173 219 247 335 400 400 491 375 411 137,6 Dugi Otok 2,173 2,454 2,628 3,164 3,730 3,858 4,582 4,211 4,670 114,9 Pašman 2,051 2,315 2,457 2,688 3,033 3,477 3,684 3,834 4,310 110,1 Vrgada 271 338 383 389 413 475 753 487 538 98,5 TOTAL 18,718 20,433 22,352 24,693 27,964 29,528 32,980 31,616 33,040 76,5 Base index (1857=100) 100.0 109.2 119.4 131.9 149.4 157.8 176.2 168.9 176.5
Source: SMOLJANOVIĆ ET AL. (1999): Stanovništvo hrvatskih otoka, Zavod za javno zdravstvo
Županije Splitsko-dalmatinske, pp 482.
Depopulation that occurred in mid-20th century is still the most prominent process on the islands, along with aging of the population. It is a general fact that a large proportion of emigrants are people between 20 and 40 years of age (WERTHEIMER
-BALETIĆ, 1999) and as they leave, an imbalance between the sexes occurs, resulting in
reduced nuptiality and significantly lower birth rates. So, the out-migration in the second half of the 20th century, coupled with natural decrease resulted in severe depopulation.
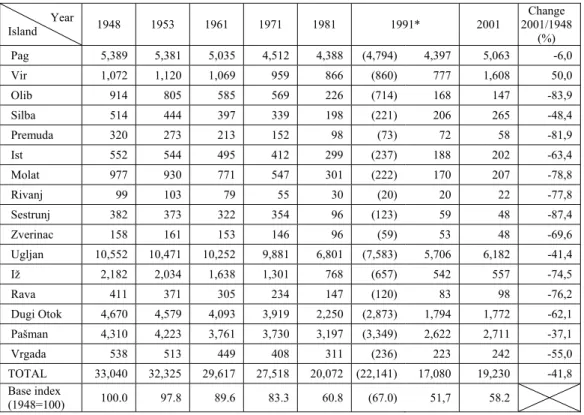
The most conspicuous decrease was recorded in the period between 1971 and 1981, which coincides with the period of strongest industrial development of Zadar and with the beginning of natural decrease that has continued until today (Tab. 2 and Fig. 3). In the same period two of Zadar islands almost completely depopulated – Babac and Škarda. Tab. 2 Number of inhabitants on Zadar islands from 1948 to 2001
Tab. 2. Kretanje broja stanovnika zadarskih otoka 1948.-2001. godine
Year Island 1948 1953 1961 1971 1981 1991* 2001 Change 2001/1948 (%) Pag 5,389 5,381 5,035 4,512 4,388 (4,794) 4,397 5,063 -6,0 Vir 1,072 1,120 1,069 959 866 (860) 777 1,608 50,0 Olib 914 805 585 569 226 (714) 168 147 -83,9 Silba 514 444 397 339 198 (221) 206 265 -48,4 Premuda 320 273 213 152 98 (73) 72 58 -81,9 Ist 552 544 495 412 299 (237) 188 202 -63,4 Molat 977 930 771 547 301 (222) 170 207 -78,8 Rivanj 99 103 79 55 30 (20) 20 22 -77,8 Sestrunj 382 373 322 354 96 (123) 59 48 -87,4 Zverinac 158 161 153 146 96 (59) 53 48 -69,6 Ugljan 10,552 10,471 10,252 9,881 6,801 (7,583) 5,706 6,182 -41,4 Iž 2,182 2,034 1,638 1,301 768 (657) 542 557 -74,5 Rava 411 371 305 234 147 (120) 83 98 -76,2 Dugi Otok 4,670 4,579 4,093 3,919 2,250 (2,873) 1,794 1,772 -62,1 Pašman 4,310 4,223 3,761 3,730 3,197 (3,349) 2,622 2,711 -37,1 Vrgada 538 513 449 408 311 (236) 223 242 -55,0 TOTAL 33,040 32,325 29,617 27,518 20,072 (22,141) 17,080 19,230 -41,8 Base index (1948=100) 100.0 97.8 89.6 83.3 60.8 (67.0) 51,7 58.2
* The first column refers to total number of inhabitants (including those working abroad and members of their families) and the second column to the actual number of inhabitants. See notes on methodology
Source: SMOLJANOVIĆ ET AL. (1999): Stanovništvo hrvatskih otoka, Zavod za javno zdravstvo
Županije Splitsko-dalmatinske, pp 482.
Popis stanovništva, domaćinstava, stanova i poljoprivrednih gospodarstava, 31. ožujak 1991., Stanovništvo u zemlji i inozemstvu, po naseljima, Dokumentacija 911, Zagreb, 1996.
Popis stanovništva, kućanstava i stanova 31. ožujka 2001., Državni zavod za statistiku, http://www.dzs.hr/Hrv/Popis%202001/popis20001.htm
In analyzing population trends it is inevitable to take into consideration the methodology of 1991 census and make certain corrections. Although at the first glance it seems that the number of inhabitants in 1991 rose by 10%, this increase is in fact fictitious, because if we subtract those inhabitants that are actually living abroad, the actual number decreased by 15% compared to 1981. Out of total number of inhabitants in
1991 as much as 5,061 (22.9%) of them lived abroad. Since this is a significant proportion, it cannot be disregarded. So, in analyzing population trends in this paper the author will use the actual number of inhabitants (i.e. without those living abroad) in order to present a more realistic demographic situation on the islands.
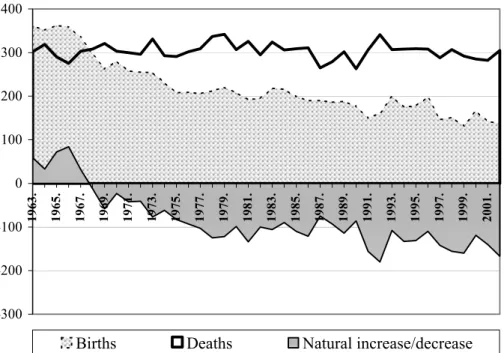
-300 -200 -100 0 100 200 300 400 1963. 1965. 1967. 1969. 1971. 1973. 1975. 1977. 1979. 1981. 1983. 1985. 1987. 1989. 1991. 1993. 1995. 1997. 1999. 2001.
Births Deaths Natural increase/decrease
Fig. 3 Births, deaths and natural increase/decrease on Zadar islands from 1963 to 2002 Sl. 3. Prirodno kretanje stanovništva zadarskih otoka 1963.-2002.
So, natural increase on Zadar islands was last recorded in 1967 and until today the islands have recorded only decrease, but this is understandable considering the demographic development of these islands in the last hundred years. Due to emigration and low fertility, the fertile cohort has been reducing for over a century, the insular population is aging and the islands are not economically developed enough to attract migrants. As a result, in the second half of the 20th century the number of inhabitants reduced by almost 42% (Tab. 2).
Only one island recorded increase (Vir, 50%) and only one recorded slight decrease (Pag, -6%), while the others were affected by severe loss of population. The most probable reason for more favourable situation on Vir and Pag is the fact that these two islands are connected to the mainland by bridges, so their insularity is not so emphasized and in a way they have become an integral part of the mainland. An additional justification is the fact that these islands have developed tourism as a very important economic activity and that there is a large number of second homes (e.g. about 1160 second homes to 100 permanent residences on Vir Island in 2001), so a certain number of second home owners stated these islands as their permanent place of residence to avoid paying taxes.
Fig. 4 Intensity of population decrease on Zadar islands from 1948 to 2001
Sl. 4. Intenzitet smanjenja broja stanovnika na zadarskim otocima 1948.-2001. godine All the other islands experienced more than 35% decrease, particularly smaller and remoter ones. Among these islands, the reduction is the lowest on Ugljan and Pašman Islands, which are the closest to the mainland and have good ferryboat connections. Although it seems that depopulation is the most intensive on smaller islands (smaller both in area and in population size), it is justified to presume that it is in fact the most intensive on remoter islands with poor traffic connections. Generally looking, the intensity of depopulation increases with the distance from the mainland, and this model can be easily observed from Fig. 4. So, the size of the island and its population are not the most significant factors. The best example is Dugi Otok Island, which comprises 11 settlements and it had 4,670 inhabitants in 1948, while today that number is down to only 1,772 inhabitants. However, the islands that are closest to the mainland are not spared either. The example of Ugljan Island can illustrate this fact very well. Namely, this island is very close to the mainland and has good and frequent ferryboat connections, but it still lost over 40% of its population. One thing is almost certain – there is simply nothing to keep the young people on the islands or attract migrants to stop or reduce this long-lasting depopulation.
To be able to understand the contemporary demographic development of Zadar islands, and Croatian islands in general, it is essential to present a brief background on the economy of the islands in the second half of 20th century. The most important issue was the fact that after the Second World War the state did not invest in the economic development of the islands for a number of years. In fact, for about 20-25 years there were no serious incentives that would stimulate economic activities and the associated positive impacts, particularly industrial sector (MONTANA, 1987). Another unfavourable
traditional economic activity, so agricultural production is now almost exclusively reduced to meeting the needs of the local population.
However, there were some positive impulses for the local economy, primarily investments in traffic infrastructure and development of tourism, but they were also unevenly developed on particular islands. Namely, tourism was mostly developing spontaneously, without a well determined development concept. One of the most significant drawbacks was the fact that the local population readily oriented to new economic activity (tourism) and largely neglected their traditional activities (agriculture, fishing) instead of combining these two activities that are actually mutually complementary. Unfortunately, not even tourism succeeded in establishing firm economic foundations that would stimulate the islanders, particularly the young people, to stay on the islands.
On the other side, the towns on the mainland provided much better educational and job opportunities, together with provisions for satisfying other social and cultural needs inherent to modern society. In this way, the islands became a periphery, whose development has been neglected for a long time. A number of scientists (STIPERSKI ET AL., 2001, NEJAŠMIĆ, 1999, MAGAŠ, FARIČIĆ, 2002) consider tourism as the most important factor in reviving the insular economy and preventing further depopulation of the islands, but that can be hardly applied to Zadar islands considering the intensity of depopulation present there. Economic development cannot be considered separately from human potentials, but through cause-and-effect concept. Namely, the economic crisis a direct consequence of the lack of human potentials, i.e. labour force, but at the same time, the underdeveloped economy, and underdevelopment in general, is a powerful push factor that stimulates emigration.
As it has been mentioned previously, population change is not the same in every place, but it depends on the intensity of natural increase/decrease, annual population growth/decline and net migration. In order to distinguish types of general population trend Friganović (1990) developed a model with eight types of population trend – four of them are immigrational and four emigrational: I1 – expansion through immigration, I2 –
regeneration through immigration, I3 – weak regeneration through immigration, I4 – very
weak regeneration through immigration; E1 – emigration, E2 – depopulation, E3 –
significant depopulation, E4 – dying out. All immigrational types have positive net
migration, but of different intensity, while all emigrational types have negative net migration of different intensity.
Until the end of 1960s the islands were still in transitional phase with high birth rates and lower death rates, but in 1968 the islands recorded natural decrease, which has continued until today. At the same time, Zadar was developing rapidly as an urban and industrial center and it attracted many people from the surrounding area, including the islands. Between 1953 and 1971 Zadar recorded the highest increase in number of inhabitants (GRAOVAC, 2004). Additionally, the islands could not provide all the things
that the towns on the coast could, and the islands kept lagging behind. Part of the people who found jobs in Zadar permanently moved there with their families.
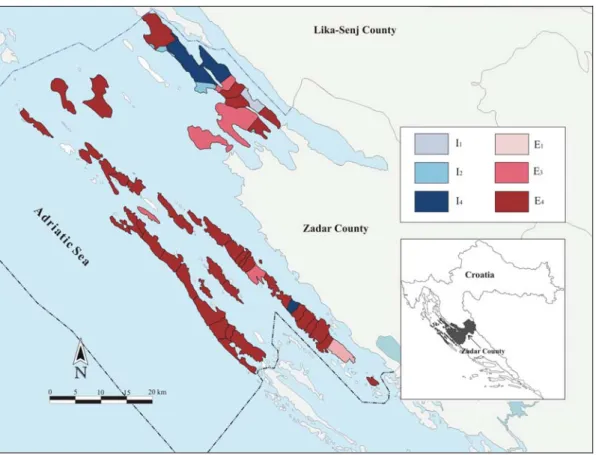
Fig. 5 Types of general population trend of the settlements on Zadar islands in the period 1971-1981. I1 – expansion through immigration, I2 – regeneration through immigration,
I4 – very weak regeneration through immigration; E1 – emigration, E3 – significant
depopulation, E4 – dying out.
Sl. 5. Tipovi općeg kretanja stanovništva po naseljima na zadarskim otocima u razdoblju 1971.-1981. I1 – ekspanzija imigracijom, I2 – regeneracija imigracijom, I4 – vrlo slaba
regeneracija imigracijom; E1 – emigracija, E3 – izrazita emigracija, E4 – izumiranje.
So, this was the period when there was no high natural increase that could compensate the negative net migration as it was the case in the 19th and in the first half of the 20th century. Out of seven settlements with immigrational population trend six of them are on Pag Island (Dinjiška, Košljun, Mandre, Pag, Smokvica and Šimuni) and one on Pašman Island (Banj) (Fig 5). But looking at a higher level, it is evident that all islands recorded natural decrease and negative net migration, and as a result net migration in this period was extremely high (-6,592), and coupled with natural decrease (-854) it resulted in total population decrease of -7,446 inhabitants.
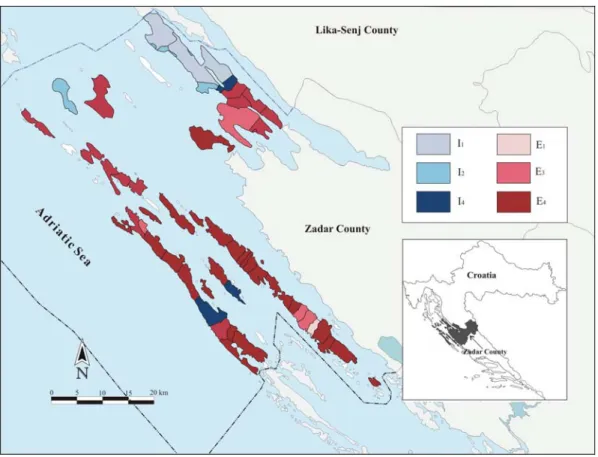
Fig. 6 Types of general population trend of the settlements on Zadar islands in the period 1981-1991. I1 – expansion through immigration, I2 – regeneration through immigration,
I4 – very weak regeneration through immigration; E1 – emigration, E3 – significant
depopulation, E4 – dying out.
Sl. 6. Tipovi općeg kretanja stanovništva po naseljima na zadarskim otocima u razdoblju 1981.-1991. I1 – ekspanzija imigracijom, I2 – regeneracija imigracijom, I4 – vrlo slaba
regeneracija imigracijom; E1 – emigracija, E3 – izrazita depopulacija, E4 – izumiranje.
In the following intercensal period (1981-1991) the situation and dominant trends did not change much (Fig. 6). Of course, if the author had used the total number of inhabitants (i.e. together with those inhabitants that were actually living abroad), the analysis would have given a distorted image of population trends. Considering the proportion of those living abroad it is probable that almost all settlements would have had immigrational types of general population trend, when in fact they continued to depopulate. In some settlements and on some islands the proportion of those living abroad was extremely high (Olib 76.5%, Ošljak 75.4%, Dragove 63.3%, Brbinj 55.4%, Sestrunj 52.0%). In this period only nine settlements had immigrational types of general population trend and again most of them were on Pag Island (Gorica, Kolan, Košljun, Mandre, Pag and Šimuni), while the rest included Silba (Silba Island), Mali Iž (Iž Island) and Luka (Dugi Otok Island). Net migration in this period was not as high as it had been
in the previous (-1,963). However, natural decrease was higher (-1,029), but total population increase was still significantly lower than in the previous period (-2,992).
Fig. 7 Types of general population trend of the settlements on Zadar islands in the period 1991-2001.1I
1 – expansion through immigration, I2 – regeneration through immigration,
I3 – weak regeneration through immigration, I4 – very weak regeneration through
immigration; E2 – depopulation, E3 – significant depopulation, E4 – dying out.
Sl. 7. Tipovi općeg kretanja stanovništva po naseljima na zadarskim otocima u razdoblju 1991.-2001. I1 – ekspanzija imigracijom, I2 – regeneracija imigracijom, I3 – slaba
regeneracija imigracijom, I4 – vrlo slaba regeneracija imigracijom; E2 – depopulacija,
E3 – izrazita depopulacija, E4 – izumiranje.
In 1980s tourism developed strongly in Croatia and the islands became very popular tourist destinations. This partially contributed to the recovery of the insular economy – building of hotels and private accommodation and accompanying infrastructure, development of service sector, improved standard of the local population
1 Due to differences in census methodology, these data is not completely comparable with data from previous intercensal periods.
etc. Nevertheless, the emigrational trends continued and demographic situation worsened additionally.
The analysis of 1991-2001 intercensal period seemingly reveals that the negative population trends have been reversed – only five settlements record negative population trends: Kolan and Stara Vas (Pag Island), Luka and Zaglav (Dugi Otok Island) and Neviđane (Pašman Island). All the other settlements record different intensities of immigrational population trend. However, these facts should not be taken for granted. Once again this is related to different methodologies employed by those two censuses, so the provided data are not completely comparable. The 2001 census employed international standards in defining permanent residents, so the permanent residents of Croatia included also Croatian citizens who had been living abroad up to one year, and foreign citizens who had been living in Croatia for more than a year.
The natural decrease continued in this period too (-1,394), so in this way the islands were losing over 100 inhabitants annually. On some islands no baby has been born for years, e.g. on Sestrunj and Zverinac from early 1980s. This clearly shows that there are virtually no young people on the islands, but this topic will be thoroughly discussed in the following chapter. On the other hand, only five settlements recorded negative net migration, and unlike in previous two intercensal periods, the total net migration on the islands was positive (3,487). The final result of such natural decrease and positive net migration was total increase of 2,150 inhabitants.
The increase in number of inhabitants and positive net migration in this period are hardly the result of reversed demographic trends. Although the tourism has developed significantly in the last thirty years, it still could not have become a decisive factor that would be powerful enough to attract migrants to the islands. So, the reasons for this increase were of a different nature. One of the consequences of rapid and spontaneous development of tourism was the emergence of a large number of second homes on the islands and part of the second home owners stated the islands as their permanent place of residence. But this increase is fictitious, since a number of them actually live in Zadar or some other place outside the islands.
However, there is a certain number of people who actually did move to the islands and live there. Most of these people are older people, who used to live on the islands, but moved to the mainland or went abroad for different reasons (employment, family reasons etc.) and returned to their native places when they retired. All demographic, social and economic changes discussed so far have had a significant impact on the landscape of the islands, settlement physiognomy and way of life.
Biological structure
Structural characteristics of the population can be divided into two groups: biological (age and gender) and sociocultural (social class, ethnicity, etc). When analyzing different structural variables of a population, age structure is the most important one, because it is a reflection of recent demographic development and a determiner of future demographic and economic development. Age structure determines future reproduction of the population, mortality and labour force. The best indicators that can indicate whether the age structure is favourable or not, are proportions of young and old people, their mutual ratio and mean age of the population. In order to present the
dominant trends in age structure, the author will compare the indicators from 1971 with those from 2001.
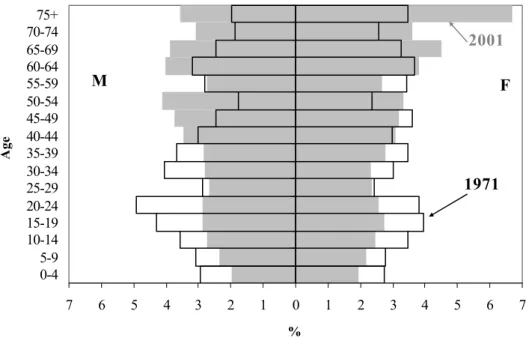
All negative effects of migrations and changes in natural decrease on the islands in the second half of 20th century are clearly visible in today’s age structure of the population. In the period from 1971 to 2001 the proportion of old people (65 and above) rose significantly – in 1971 it was 15.6% and in 2001 25.3%. At the same time the proportion of young people (0-14 years) decreased from 18.5% to 13.6%. The severity of the problem can also be illustrated by another indicator – ratio between the young and old people. In 1971 the young people still outnumbered the old, so there were 84.1 old people to 100 young people, but in only three decades that ratio worsened drastically and in 2001 there were 185.7 old people to 100 young people. The reduction is also very significant in 15-39 age group, and this group comprises people in their reproductive age, who are the bearers of population reproduction and future survival of the population (Fig. 8).
7 6 5 4 3 2 1 0 1 2 3 4 5 6 7 0-4 5-9 10-14 15-19 20-24 25-29 30-34 35-39 40-44 45-49 50-54 55-59 60-64 65-69 70-7475+ Ag e % M F 1971 2001
Fig. 8 Comparison of age and sex structure on Zadar islands in 1971 and 2001 Sl. 8. Usporedba dobno-spolne strukture zadarskih otoka 1971. i 2001. godine
Considering the dominant trends in the last few decades it is to be expected that they will continue in the future and that the future perspective of the islands is far from bright. In 2001 there were nine settlements and four islands (Sestrunj, Rivanj, Molat, Zverinac) without young people (0-14 years), and on Rivanj Island the youngest person was in 45-49 age group. The most significant increase is recorded in female group above 75 years. The age structure is particularly unfavourable on remoter islands. These data show that the situation on the islands is beyond critical, and seeing the dominant trends in the last thirty years it is obvious that there is absolutely no chance that the islands can
survive, they are bound to die out eventually, of course, unless a drastic change happens (primarily immigration of a large number of young people in their reproductive age, but that is not likely to happen).
5 4 3 2 1 0 1 2 3 4 5 0-4 5-9 10-14 15-19 20-24 25-29 30-34 35-39 40-44 45-49 50-54 55-59 60-64 65-69 70-74 75-79 80-84 85-89 90-9495+ Ag e % M F Zadar Islands Croatian Islands
Fig. 9 Comparison of age and sex structure of Croatian islands and Zadar islands in 2001 Sl. 9. Usporedba dobno-spolne strukture hrvatskih i zadarskih otoka 2001. godine
With the increase in proportion of old people and reduction in proportion of young people, the mean age of the population increased too from 38.6 in 1971 to 45.3 in 2001. If we compare the age structure of Zadar islands with those of Croatian islands in general, we come to the conclusion that the situation on Zadar islands is notably worse (Fig. 9) – there is less young population and much more old population and mean age is higher (mean age of the population of Croatian islands in 2001 was 42.2).
Sex ratio (SR) is expressed as the number of males for every one hundred females -
[
(m/f)×100]
where m is the number of males in a population and f is the number of females. This ratio is especially sensitive to the age of a population, with a general rule being the younger the population, the higher the ratio. Also, a "surplus" of women reflects an aging population (WEINSTEIN,PILLAI, 2001). On Zadar islands thenumber of males and females in 2001 was almost equal, so the sex ratio was 99.1. However, it is interesting to analyze the sex ratio of certain age groups, particularly the sex ratio of narrower fertile cohort (20-29 age group), because a significant misbalance in this age group can severely affect nuptiality and birth rates. That ratio is relatively balanced today (in 2001 it was 112.4), but in 1971 it was 125.3, and that "lack" of women reduced nuptiality and birth rates in the following years.
According to 2001 census the sex ratios for all the other age groups do not differ much from general rules; the males outnumber women in the group of young and middle-aged people, while the women are numerous in older age groups (above 65 years of age the sex ratio is 71.2). The dominance of women in older age groups is related to the fact that they generally live longer, and in this case, to the fact that a number of men who were supposed to reach this age during 2001 census, died in the Second World War. The presented age structure shows that the population of Zadar islands belongs to the category of "old" population, because it has high proportion of middle-age and elderly persons, a high mean age, and thus a lower growth potential.
Islands’ future
Although the general trend on Zadar islands is depopulation with strong tendencies toward dying out, there are still certain differences in depopulation intensity between the settlements, as well as between the islands. In order to find out which settlements and which islands are most severely affected and threatened by extinction, the author made an analysis using several indicators. These indicators are:
A. age-dependency ratio in 2001 – ratio of persons in the ages defined as dependent (under 15 and over 65) to persons in the ages defined as economically productive (15-65) in a population. It is calculated as follows: 100
P P P ) 65 15 ( ) 65 ( ) 15 ( + × − > < .
B. proportion of old people (over 65) in 2001, calculated as follows: 100 P P ) total ( ) 65 ( > ×
C. proportion of young people (under 15) in 2001, calculated as follows: 100 P P ) total ( ) 15 (< ×
D. natural increase rate in the period 1971-1981, calculated as follows:
) 1000 2 P P ( ) 10 M N ( (1971−1981)− (1971−1981) ÷ (1971)+ (1981) ×
E. natural increase rate in the period 1981-1991, calculated as follows:
) 1000 2 P P ( ) 10 M N ( (1981−1991)− (1981−1991) ÷ (1981)+ (1991) ×
F. natural increase rate in the period 1991-2001, calculated as follows:
) 1000 2 P P ( ) 10 M N ( (1991−2001)− (1991−2001) ÷ (1991)+ (2001) ×
G. annual growth rate in the period 1971-1981, calculated as follows:
) 100 2 P P ( ) 10 P P ( (1981)− (1971) ÷ (1971)+ (1981) ×
H. annual growth rate in the period 1981-1991, calculated as follows: ) 100 2 P P ( ) 10 P P ( (1991)− (1981) ÷ (1981)+ (1991) ×
I. annual growth rate in the period 1991-2001, calculated as follows:
) 100 2 P P ( ) 10 P P ( (2001)− (1991) ÷ (1991)+ (2001) ×
Each indicator was calculated for each settlement/island and then the most unfavourable value for each indicator was ranked first and the most favourable was ranked the last (Tab. 3). In the end, the settlement/island with most unfavourable values for each indicator was ranked the first and designated as the most threatened by extinction and so on. The last one on the list is the least threatened. This analysis included 54 settlements and 16 islands. The three settlements excluded from this analysis are Bošana and Kolanski Gajac (Pag Island) and Verunić (Dugi Otok Island), because these settlements were founded relatively recently (Bošana in 1980s, Kolanski Gajac and Verunić in 2000) and it was not possible to analyze all the selected indicators for these settlements. But, the omission of these settlements does not diminish the results of the analysis.
Tab. 3 Comparative analysis of settlements on Zadar islands according to selected indicators. A – age-dependency ratio (2001); B – proportion of old people (over 65 years) (2001); C – proportion of young people (under 15 years) (2001); D – natural increase rate 1971-1981 (in ‰); E – natural increase rate 1981-1991 (in ‰); F – natural increase rate 1991-2001 (in ‰); G – annual growth rate 1971-1981 (in %); H – annual growth rate 1981-1991 (in %); I – annual growth rate 1991-2001 (in %). The settlement with the most unfavourable indicators is ranked the first and the one with most favourable is ranked the last.
Tab. 3. Usporedna analiza naselja na zadarskim otocima prema odabranim pokazateljima. A – koeficijent dobne ovisnosti (2001.); B – udio starog stanovništva (iznad 65 godina) (2001.); C – udio mladog stanovništva (do 15 godina) (2001.); D – stopa prirodne promjene 1971.-1981. (u ‰); E – stopa prirodne promjene 1981.-1991. (u ‰); F – stopa prirodne promjene 1991.-2001. (u ‰); G – godišnja stopa porasta stanovništva 1971.-1981. (u %); H – godišnja stopa porasta stanovništva 1981.-1991. (u %); I – godišnja stopa porasta stanovništva 1991.-2001. (u %). Naselje s najlošijim pokazateljima nalazi se na prvom mjestu, a ono s najboljim pokazateljima na posljednjem mjestu.
Rank Settlement Island A B C D E F G H I2
1 Dragove Dugi Otok 281.8 73.8 0.0 -10.8 -32.6 -36.6 -12.0 -4.2 -1.9 2 Sestrunj Sestrunj 147.1 52.1 0.0 -11.6 -21.9 -56.1 -11.5 -4.8 -2.1 3 Soline Dugi Otok 230.0 66.7 3.0 -9.6 -23.9 -25.9 -8.4 -6.6 -1.0 4 Molat Molat 152.6 60.4 0.0 -18.8 -26.6 -26.8 -5.9 -4.8 1.5
2 See note 1.
5 Mali Iž Iž 145.0 53.7 5.4 -29.7 -76.0 -42.2 -7.3 -6.4 3.0 6 Brgulje Molat 120.8 54.7 0.0 -13.5 -24.4 -38.0 -5.4 -4.7 1.2 6 Olib Olib 129.7 45.6 10.9 -14.3 -26.9 -27.9 -8.6 -2.9 -1.3 6 Rivanj Rivanj 320.0 72.7 0.0 -11.8 -8.0 -47.6 -5.9 -4.0 1.0 9 Premuda Premuda 90.0 44.8 1.7 -13.6 -30.6 -30.8 -4.3 -3.1 -2.2 10 Savar Dugi Otok 128.0 56.1 0.0 -12.8 -17.1 -30.8 -6.8 -6.6 1.9
11 Rava Rava 139.0 57.1 1.0 -8.9 -27.8 -19.9 -4.6 -5.6 1.7
12 Zverinac Zverinac 140.0 58.3 0.0 0.8 -21.5 -23.8 -4.1 -5.8 -1.0 13 Luka Dugi Otok 102.1 39.4 10.1 -10.7 -31.7 -14.8 -8.5 -1.4 -1.7 14 Zapuntel Molat 96.6 48.3 0.0 -4.7 -23.1 -38.8 -6.0 -7.7 3.7 15 Veli Iž Iž 100.0 44.6 4.8 -9.3 -12.1 -24.0 -4.1 -2.5 -0.5 16 Brbinj Dugi Otok 183.3 54.1 10.6 -2.1 -11.2 -15.0 -8.9 -3.2 1.3 17 Veli Rat Dugi Otok 107.1 41.7 10.0 -6.2 -13.3 -18.9 -6.3 -4.7 3.0
18 Ist Ist 80.2 39.1 5.0 -3.7 -15.6 -22.6 -3.2 -4.6 0.7
19 Ošljak Ošljak 200.0 66.7 0.0 0.0 0.0 -70.6 0.2 -12.1 1.2 20 Žman Dugi Otok 79.1 29.1 13.8 -9.5 -19.9 -14.8 -4.2 -2.4 -0.7 21 Lukoran Ugljan 73.8 34.3 7.9 -2.3 -10.3 -17.5 -3.4 -2.0 -1.1 22 Silba Silba 102.3 40.0 10.6 -16.4 -7.9 -20.0 -5.3 0.4 2.5 23 Poljana Ugljan 67.1 26.7 13.3 -2.8 -5.7 -17.3 -4.3 -4.4 -0.6 24 Ždrelac Pašman 71.8 32.2 9.4 -10.5 -5.4 -13.3 -3.7 -4.0 2.4 25 Kukljica Ugljan 68.3 29.4 11.1 -5.5 -6.7 -8.6 -6.3 -1.3 0.3 26 Božava Dugi Otok 95.4 35.4 13.4 -11.9 7.5 -16.4 -5.6 -0.7 -0.2 27 Sutomišćica Ugljan 76.0 26.8 16.1 -5.5 -4.9 -9.9 -4.4 -1.5 -0.6 28 Vrgada Vrgada 67.4 26.9 13.2 -3.3 -9.4 -11.6 -2.7 -3.3 0.8
29 Banj Pašman 65.8 25.8 13.9 -4.3 -7.7 -11.6 -0.3 -5.2 -0.5
30 Zaglav Dugi Otok 62.5 25.5 12.5 -4.0 -14.0 0.5 -4.3 -2.1 -0.4
31 Pašman Pašman 58.9 22.2 14.9 -5.3 -8.5 -6.1 -2.6 -2.3 0.5
32 Neviđane Pašman 72.9 25.9 16.1 -1.6 1.1 -6.7 -0.6 -3.2 -1.1
33 Ugljan Ugljan 46.6 24.5 6.9 -4.7 -4.4 -9.1 -3.5 -1.3 2.7
34 Vlašići Pag 79.4 26.0 18.3 -4.5 -2.6 -8.4 -1.9 -3.1 2.0
35 Vrčići Pag 115.0 37.2 16.3 0.0 0.0 7.6 -3.6 -3.3 1.8
36 Preko Ugljan 66.4 24.1 15.5 -0.5 -5.6 -5.0 -3.3 -1.9 0.9
37 Sali Dugi Otok 62.4 23.5 14.4 -2.2 -2.0 -6.9 -2.3 -1.0 -0.3
38 Kolan Pag 69.9 26.2 14.9 0.0 2.2 -6.1 -1.8 0.3 -1.6
39 Dinjiška Pag 33.3 11.1 13.9 3.8 -12.7 -18.8 4.0 -2.7 0.1
40 Mrljane Pašman 89.0 23.7 23.2 -7.3 3.4 -0.9 -2.7 0.2 0.8
41 Dobropoljana Pašman 83.9 21.2 24.5 -3.6 0.8 0.4 -3.6 -1.0 0.9 42 Miškovci (Miškovići) Pag 38.6 19.7 8.2 0.0 0.0 -7.7 -2.9 -2.4 3.5
43 Smokvica Pag 108.3 34.0 18.0 0.0 0.0 2.3 0.8 -3.0 3.0
45 Kraj Pašman 58.9 17.8 19.2 -0.3 -3.8 -1.1 -0.4 -0.9 0.4
46 Tkon Pašman 57.7 20.1 16.1 5.0 -2.3 -3.4 -0.2 -0.4 0.3
47 Stara Vas Pag 58.7 20.0 17.0 0.0 0.0 5.0 -1.4 -1.1 0.1
48 Gorica Pag 35.9 9.2 17.2 8.7 -16.1 -2.5 -1.3 -1.4 1.5 49 Pag Pag 55.5 20.3 15.3 -2.1 1.0 -1.0 -0.1 0.6 1.6 50 Povljana Pag 51.8 19.5 14.6 1.2 2.8 -1.6 -0.6 -0.3 1.2 51 Vir Vir 41.7 14.7 14.5 1.4 -0.9 -2.3 -1.0 -1.1 7.0 52 Košljun Pag 71.0 18.9 22.6 0.0 0.0 -2.2 2.2 6.0 3.6 53 Šimuni Pag 57.0 20.0 16.3 0.0 0.0 3.3 0.9 1.8 2.2 54 Mandre Pag 59.5 11.6 25.7 0.0 0.0 4.7 7.1 1.2 5.7
Source: SMOLJANOVIĆ ET AL.,(1999): Stanovništvo hrvatskih otoka, Zavod za javno zdravstvo
Županije Splitsko-dalmatinske, pp 482.
Popis stanovništva, domaćinstava, stanova i poljoprivrednih gospodarstava, 31. ožujak 1991., Stanovništvo u zemlji i inozemstvu, po naseljima, Dokumentacija 911, Zagreb, 1996.
Popis stanovništva, kućanstava i stanova 31. ožujka 2001., Državni zavod za statistiku, http://www.dzs.hr/Hrv/Popis%202001/popis20001.htm
Tablogrami rođeni i umrli po naseljima, Državni zavod za statistiku, Zagreb.
The settlement most severely threatened by extinction is Dragove on Dugi Otok Island with only 42 inhabitants in 2001, with extremely high age-dependency ratio (281.8), over 73% of the population is over 65 years of age, the youngest persons on the island are above 40 years of age and natural decrease is extremely high (Tab. 3). This detailed analysis confirms the theory and previously stated model that the intensity of depopulation increases with the distance from the mainland, and that the remoter islands with poor traffic connections are more endangered (Tab. 3 and Tab. 4). Some of these islands may soon face the destiny of Škarda and Babac Islands, which completely depopulated in 1990s.
The settlements that are in more favourable position are those on Pag Island and Vir Island, which are connected to the mainland by bridges, and settlements on the other three islands that are closest to the mainland and have more frequent traffic connections with the mainland – Pašman, Ugljan and Vrgada. Ugljan Island is connected with Zadar by a ferry line (the busiest ferry line on the Croatian coast), Pašman Island is connected to Biograd na moru, and these two islands are mutually linked by a bridge.
Seeing the whole demographic situation and dominant trends on Zadar islands it is clear that the situation is alarming. The analyses of Croatian islands done by other scientists also indicate that many of the islands have begun to die out, and this paper emphasizes the severity of the problem on Zadar islands, but so far much has been said and little has been done. Although some scientists (STIPERSKI ET AL.,2001, NEJAŠMIĆ,
1999, MAGAŠ,FARIČIĆ, 2002) consider that stronger development of tourism, shipping,
shipbuilding, industry and agriculture, triggered by more investments in insular infrastructure, could at least partially reverse the negative demographic trends on the islands and prevent further depopulation, this theory may be applicable only to some bigger and closer islands and those connected to the mainland by bridges, but the remoter ones are almost surely to die out eventually.
It is true that stronger economic development can have positive influence on demographic development of an area because it can enable higher employment, stimulate in-migration of young people and higher birth rates. But, economic development cannot be achieved without significant investments and human potential, and it is exactly those preconditions that the islands lack. Namely, the analyses of demographic development and age structure of the population on Zadar islands have shown that the population has been decreasing constantly, as well as the natural decrease, and the age structure is highly unfavourable. Regardless of the long-term negative demographic trends, so far very little has been done to reverse that. Generally looking, the only action that can stimulate population growth and ensure future survival of the islands is immigration of young people, but there are virtually no real pull factors that could stimulate the in-migration. Tab. 4 Comparative analysis of Zadar islands according to selected indicators. A – age-dependency ratio (2001); B – proportion of old people (over 65) (2001); C – proportion of young people (under 15) (2001); D – natural increase rate 1971-1981 (in ‰); E - natural increase rate 1981-1991 (in ‰); F – natural increase rate 1991-2001 (in ‰); G – annual growth rate 1971-1981 (in %); H – annual growth rate 1981-1991 (in %); I – annual growth rate 1991-2001 (in %). The island with the most unfavourable indicators is ranked the first and the one with most favourable is ranked the last.
Tab. 4. Usporedna analiza zadarskih otoka prema odabranim pokazateljima. A – koeficijent dobne ovisnosti (2001.); B – udio starog stanovništva (iznad 65 godina) (2001.); C – udio mladog stanovništva (do 15 godina) (2001.); D – stopa prirodne promjene 1971.-1981. (u ‰); E – stopa prirodne promjene 1981.-1991. (u ‰); F – stopa prirodne promjene 1991.-2001. (u ‰); G – godišnja stopa porasta stanovništva 1971.-1981. (u %); H – godišnja stopa porasta stanovništva 1981.-1991. (u %); I – godišnja stopa porasta stanovništva 1991.-2001. (u %). Otok s najlošijim pokazateljima nalazi se na prvom mjestu, a otok s najboljim pokazateljima na posljednjem mjestu.
Rank Island A B C D E F G H I3 1 Sestrunj 147.1 52.1 0.0 -11.6 -21.9 -56.1 -11.5 -4.8 -2.1 2 Rivanj 320.0 72.7 0.0 -11.8 -8.0 -47.6 -5.9 -4.0 1.0 3 Molat 126.4 55.6 0.0 -13.2 -25.1 -32.9 -5.8 -5.6 2.0 4 Olib 129.7 45.6 10.9 -14.3 -26.9 -27.9 -8.6 -2.9 -1.3 5 Iž 115.9 44.9 8.8 -15.9 -27.8 -28.2 -5.2 -3.5 0.3 5 Premuda 90.0 44.8 1.7 -13.6 -30.6 -30.8 -4.3 -3.1 -2.2 7 Zverinac 140.0 58.3 0.0 0.8 -21.5 -23.8 -4.1 -5.8 -1.0 8 Rava 139.0 57.1 1.0 -8.9 -27.8 -19.9 -4.6 -5.6 1.7 9 Ist 80.2 39.1 5.0 -3.7 -15.6 -22.6 -3.2 -4.6 0.7 10 Dugi Otok 82.7 32.9 11.9 -6.4 -10.5 -11.6 -5.4 -2.3 -0.1 11 Silba 102.3 40.0 10.6 -13.8 -7.9 -20.4 -5.3 0.4 2.5 12 Vrgada 67.4 26.9 13.2 -3.3 -9.4 -11.6 -2.7 -3.3 0.8 13 Ugljan 60.2 25.0 12.4 -1.7 -4.4 -7.8 -3.7 -1.8 0.8 3 See note 1.
14 Pašman 66.7 22.9 16.9 -2.4 -2.8 -4.9 -1.5 -2.0 0.3
15 Pag 56.9 20.3 15.9 -0.8 0.3 -2.0 -0.3 0.0 1.4
16 Vir 41.7 14.7 14.5 1.4 -0.9 -2.3 -1.0 -1.1 7.0
Source: SMOLJANOVIĆ ET AL. (1999): Stanovništvo hrvatskih otoka, Zavod za javno zdravstvo
Županije Splitsko-dalmatinske, pp 482.
Popis stanovništva, domaćinstava, stanova i poljoprivrednih gospodarstava, 31. ožujak 1991., Stanovništvo u zemlji i inozemstvu, po naseljima, Dokumentacija 911, Zagreb, 1996.
Popis stanovništva, kućanstava i stanova 31. ožujka 2001., Državni zavod za statistiku, http://www.dzs.hr/Hrv/Popis%202001/popis20001.htm
Tablogrami rođeni i umrli po naseljima, Državni zavod za statistiku, Zagreb.
The present situation on Zadar islands and the thinking of young people that live there is best presented by a survey conducted on three islands (Dugi Otok, Iž and Ugljan) by Babić et al. (2004). The survey showed that the islands cannot retain their own young population let alone attract new migrants. A large part of young people wants to leave the islands mostly because they want to avoid everyday travelling to the mainland, they think they have a better future on the mainland, which can provide them better job and schooling opportunities, more cultural and social events etc. In other words, they perceive the islands as a periphery that is neglected by the society.
Then what is the future for these islands? The islands that are closer to the mainland or connected to it by frequent ferry lines or by a bridge definitely have better developmental possibilities and will not depopulate completely. But, the remoter islands are on the way of completely depopulating and becoming seasonally inhabited, mostly during the summer tourist season. Croatian coast and the islands are very attractive tourist destinations due to their exquisite beauty, preserved nature and particular social and cultural heritage. For several decades these areas have recorded significant increase in number of hotels and especially second homes. That trend has continued up to the present day, but at the expense of natural beauties that were characteristic for these areas. So, many of these places are overbuilt, and the building continues regardless of the carrying capacity of the area.
A number of people who do not live on the islands, but have some property or real estate there, sell them and new houses are erected, many of which do not correspond to traditional way of building and do not fit into the insular landscape. Instead of renewing traditional stone houses, some of the newcomers build real "palaces" that diminish the true, hundreds of years old ambiance. Unfortunately, there are no laws or regulations that would prevent the newcomers from building unfit houses and oblige them to build houses in the traditional spirit or refurnish the old ones in the same manner.
As Croatia approaches the European Union it is sure that the demand for real estates on the Croatian coast and on the islands will increase rapidly and there is a serious threat that the devastation of these areas will progress. So far, the islands have still preserved most of their traditional features that make them appealing for the tourists, and due to their mild climate and other favourable natural and cultural characteristics they might become havens for many Europeans who seek peaceful rural landscapes where they could spend their retirement days. Similar thing happened to the Island of Corfu (Greece) where a number of retired British people bought holiday homes. Namely, they used to spend their holidays there, but when they retired they opted for quiet lifestyles in the
peaceful rural places, and some of the most important factors in their migration decision-making are climate coupled with human and aesthetic quality-of-life variables(LAZARIDIS ET AL., 1999).
It is obvious that Croatia cannot stop depopulation of some of its islands and that it cannot prevent the laws of free market from being executed (i.e. selling and buying properties and real estates), but it can prevent the destruction of one of its most valuable assets at least make good use of the islands whose depopulation cannot be stopped. It is essential to retain the traditional insular landscape, prevent extensive building and create appealing, unique summer resorts and real retirement havens during the winter. Of course, such plans involve considerable investments, but upon their successful execution the state can expect many benefits and profits.
Conclusion
Considering the dominant negative processes Croatian islands have become problem areas threatened by extinction, and this particularly refers to outer range of islands that are farther from the mainland, have poor traffic connections, negative demographic indicators, underdeveloped economy and infrastructural problems. Only the inner range of islands that are closer to the mainland (Ugljan, Pašman and Vrgada) and those connected by bridges (Vir and Pag) have better chances for development and survival of their population. Since it is hard to believe that the full demographic revival of all the islands is possible, the probable future of some of the islands is to become summer and winter resorts.
A survey conducted by Babić et al. in 2001 on three of Zadar islands showed that the islanders like the places where they lived, their physical surroundings, but the restrictions and disadvantages in their social surroundings (lack of entertainment and cultural events, small number of shops, strong dependency on the mainland, poor traffic connections and constant travelling to the mainland, lack of jobs and schools etc.) are forcing them to emigrate. This particularly refers to the young people, but the older people are also faced with many difficulties like frequent visits to the doctors on the mainland, higher prices in the shops, solitude etc. But, due to their place of living, migration is a constant in their lives and it cannot be avoided. A century or two ago the social and economic differences between the mainland and the islands were not so emphasized, but in the era of fast industrialization, particularly in the second half of the 20th century, the gap between these two areas widened creating center-periphery relationships. The islands kept lagging behind and that gap is hard to bridge now.
Although the islanders hope that the situation will improve, that their islands will not die out one day, they are nevertheless aware of the evident future that awaits them. So the best perception of the present and future of the islands can be given by the islanders themselves, particularly the youngest ones, who are supposed to be the future of the islands: "Iž is a small island with not many inhabitants over the winter, but with much more people during the summer. Most of the people are old, although there are some younger people, but most of the young people have moved to Zadar. A lot of people live out of fishing and some out of agriculture. I don't like the fact that many young people go to work in Zadar and there aren't many entertainment facilities for the young people. I am not satisfied with traffic connections with Zadar, and I think that not many people are
involved in preserving the nature on the island. People leave the island because they have no real job opportunities, no preconditions for family planning, they want to educate themselves, ensure better life and provide for their families." ("My island in 2001", an essay written by an elementary school pupil from Iž Island) (BABIĆ ET AL., 2001). "I think that in ten years the island will have a small number of inhabitants. The people will continue leaving the island. I will certainly be in some town where I will continue my schooling. …I wish there were more entertainment and shops on the island throughout the year, so more people would stay on the island." ("My island in 2011", an essay written by an elementary school pupil from Iž Island) (BABIĆ ET AL., 2001).
LITERATURE
ALDRICH,R.,CONNELL,J. (1998): The Last Colonies, Cambridge University Press, Cambridge, pp. 349.
BABIĆ, D., LAJIĆ, I., PODGORELEC, S. (2004): Otoci dviju generacija, Institut za migracije i narodnosti, Zagreb, pp. 233.
CONNELL,J.,KING,R. (1999): Island Migration in a Changing World, in: Small Worlds, Global
Lives – Islands and Migration (ed: Russell King and John Connell), Pinter, London-New York, 1-26. ČUKA,A.,MAGAŠ,D.,(2003): Socio-geographic transformation of Ist island, Croatia, Geoadria, 8.,
No. 2, 67-86.
DUPLANČIĆLEDER,T.,UJEVIĆ,T.,ČALA,M. (2004): Coastline lenghts and areas of islands in the
Croatian part of the Adriatic Sea determined from the topographic maps at the scale of 1 : 25 000,
Geoadria, 9, No. 1, 5-32.
FRIGANOVIĆ,M.(1962): Suvremeni geografski problemi naših otoka, Geografski horizont, 1-2, 30-41. FRIGANOVIĆ, M. (1974): Neka demografska obilježja i problemi Zadarskih otoka, u: Zbornik Zadarsko otočje, sv. 1, 381-413.
FRIGANOVIĆ, M. (1990): Demogeografija – stanovništvo svijeta, 4. dopunjeno izdanje, Školska knjiga, Zagreb, pp. 271.
FRIGANOVIĆ,M.(2001): O demografskoj problematici hrvatskih otoka na Jadranu, Sociologija sela, Vol. 39, No. 1/4 (151/154), 37-59.
GRAOVAC,V. (2004.): Populacijski razvoj Zadra, Geoadria, 9, No. 1, 51-72.
LAJIĆ, I. (1986): Migracije i depopulacija dalmatinskih otoka: kratak demografski prikaz, Migracijske teme, 1, 61-70.
LAJIĆ, I. (1989): Utjecaj društveno-ekonomskih i demografskih promjena na iseljavanje s
dalmatinskih otoka u 19. i prvoj polovini 20. stoljeća, Migracijske teme, 5, 307-324.
LAJIĆ,I.(1995): Utjecaj novijeg iseljavanja na demografski razvitak jadranskih otoka, Migracijske teme, Vol. 11, No. 1, 165-177.
LAJIĆ,I.(1997): Suvremena demografska problematika jadranskih otoka, u: Nacionalni program razvitka otoka (ur. Nenad Starc et al.), Ministarstvo razvitka i obnove Republike Hrvatske, Zagreb, 13-32. LAJIĆ,I., PODGORELEC,S.,BABIĆ, D.(2001): Migracijske dileme otočana: od cirkulacije prema
migraciji ili ostanku?, Migracijske i etničke teme, 17, No. 3, 175-194.
LAZARIDIS, G., POYAGO-THEOTOKY, J., KING, R. (1999): Islands as Havens for Retirement
Migration: Finidng a Place in Sunny Corfu, in: Small Worlds, Global Lives – Islands and
Migration (ed: Russell King and John Connell), Pinter, London-New York, 297-320.
MCELROY,J.E., DE ALBUQUERQUE,K. (1988): Migration transition in small northern and eastern
Caribbean states, International Migration Review, 22, No. 1, 30-58.
MAGAŠ,D.,FARIČIĆ,J. (1999): Prirodno-geografska obilježja otoka Rave u Zadarskom arhipelagu, Geoadria, 4, 33-60.
MAGAŠ,D.,FARIČIĆ,J. (2000): Geografske osnove razvitka otoka Ugljana, Geoadria, 5., 49-92. MAGAŠ, D.,FARIČIĆ, J. (2002): Problemi suvremene socio-geografske preobrazbe otoka Oliba, Geoadria, 7, No. 2, 35-62.
MARSHALL,J. (1999): Insiders and Outsiders: The Role of Insularity, Migration and Modernity on
Grand Manan, New Brunswick, in: Small Worlds, Global Lives – Islands and Migration (ed:
Russell King and John Connell), Pinter, London-New York, 95-113.
MIKAČIĆ, V. (1987): Demografska kretanja na jadranskim otocima – suvremeno stanje i
perspektive, Pomorski zbornik, Vol. 25, 57-73.
MONTANA,M. (1987): Društveno-ekonomski razvoj jadranskih otoka, Pomorski zbornik, Vol. 25,
75-100.
NEJAŠMIĆ, I. (1991a): Depopulacija istočnojadranskih otoka i izumiranje kao moguća
demografska perspektiva, Migracijske teme, 1, 77-99.
NEJAŠMIĆ, I. (1991b): Depopulacija u Hrvatskoj – korijeni, stanje, izgledi, Globus –
Institut za migracije i narodnosti, Zagreb, pp. 344.
NEJAŠMIĆ, I. (1992): Promjene u dobno-spolnom sastavu stanovništva istočnojadranskog otočja
(1953.-1991.), Acta Geographica Croatica, Vol. 27, 15-34.
NEJAŠMIĆ, I. (1997): Suvremene značajke (bio)reprodukcije stanovništva hrvatskog otočja, Migracijske teme, 13, 1/2, 71-83.
NEJAŠMIĆ,I. (1998): Croatian Islands: the Role of Demographic Features in Tourism Development, Geografski glasnik, 60, 17-30.
NEJAŠMIĆ, I. (1999): Uloga turizma u diferenciranom demografskom razvitku otočnih naselja:
primjer srednjodalmatinskog otočja, Hrvatski geografski glasnik, Vol. 61, 37-52.
STIPERSKI, Z., MALIĆ, A., KOVAČEVIĆ, D. (2001): Međuzavisnost dostupnosti, gospodarstva i
revitalizacije hrvatskih otoka, Sociologija sela, Vol. 39, No. 1/4 (151/154), 153-168.
STRGAČIĆ, I. (1994): Temeljna žarišta emigracije i depopulacije zadarskih otoka, Radovi, Sveučilište u Splitu, Ekonomski fakultet, 4, 11, 293-312.
WEINSTEIN,J.,PILLAI,V.K. (2001): Demography: The Science of Population, Allyn and Bacon,
Boston-London, pp. 450.
WERTHEIMER-BALETIĆ,A.(1999): Stanovništvo i razvoj, MATE, Zagreb, pp. 655. SOURCES
SMOLJANOVIĆ,M.,SMOLJANOVIĆ,A.,NEJAŠMIĆ,I. (1999): Stanovništvo hrvatskih otoka, Zavod za javno zdravstvo Županije Splitsko-dalmatinske, pp 482.
Popis stanovništva, domaćinstava, stanova i poljoprivrednih gospodarstava, 31. ožujak 1991., Stanovništvo u zemlji i inozemstvu, po naseljima, Dokumentacija 911, Zagreb, 1996.
Popis stanovništva, kućanstava i stanova 31. ožujka 2001., Državni zavod za statistiku, http://www.dzs.hr/Hrv/Popis%202001/popis20001.htm
Tablogrami rođeni i umrli po naseljima, Državni zavod za statistiku, Zagreb. SAŽETAK
Vera Graovac: Otoci na rubu izumiranja – primjer zadarskih otoka
Jedan od najznačajnijih demografskih procesa u Hrvatskoj jest depopulacija, čiji je intenzitet regionalno različit. Među područjima koja su najjače pogođena depopulacijom, jesu i hrvatski otoci. Glavni uzrok depopulacije na otocima u prvom redu je dugotrajna emigracija, koja je kasnije popraćena i dugotrajnom negativnom prirodnom promjenom. Emigracija s otoka poprimila je masovna obilježja krajem 19. st., nastavila se tijekom 20. st. te je prisutna i danas, na početku 21. st. Glavnina migracija bila je potaknuta nepovoljnom ekonomskom situacijom na otocima. U početku negativne posljedice iseljavanja nisu bile jako izražene, ali njihov odgođeni učinak izišao je na vidjelo u drugoj polovini 20. st. i kasnije. Najznačajnija gospodarska aktivnost na otocima bila je poljoprivreda, ali zbog nedostatka obradivog zemljišta i oskudnosti ostalih prirodnih resursa gospodarstvo otoka sporo se razvijalo, što je bio značajan potisni faktor za otočno stanovništvo. U