SEVENTH REPORT
OF
THE MALAYSIAN
DIALYSIS AND TRANSPLANT
REGISTRY
1999
edited by
T. O. LIM
Y.N. LIM
MALAYSIAN ORGAN SHARING SYSTEM/ NATIONAL RENAL REGISTRY
(MOSS/NRR)
Malaysian Society of Nephrology
c/o Department Of Nephrology
Hospital Kuala Lumpur
Jalan Pahang
50586 Kuala Lumpur
ACKNOWLEDGMENTS
We would like to thank all those for their toil, sweat and occasionally perhaps, tears to
see this seventh report to fruition.
We would like to especially thank the following:
All centre coordinators, nephrologists and physicians in-charge of dialysis centres
and renal units from the various government, non-governmental and private centres
without whose dedication and hard work this registry report would not be possible.
Ms. Lee Day Guat for her tireless and meticulous effort as data manager
Ms Zudiana Zulkafli and Nor Asiken for their help in data entry
The Ministry of Health, Malaysia for assistance seen and unseen.
And of course not forgetting our sponsors Janssen Pharmaceutica, Fresenius Medical
care, Novartis, Medi-Chem Systems, Hemodynamics and Bristol-Myers.
MOSS/NRR COMMITTEE
PARTICIPATING CENTRES
GOVERNMENT CENTRES
1 801 Rumah Sakit Angkatan Tentera, Kucing
2 807 Rumah Sakit Angkatan Tentera, Sg. Petani
3 810 Rumah Sakit Angkatan Tentera, Majidee
4 819 Rumah Sakit Angkatan Tentera, TUDM
5 94 Hospital Angkatan Tentera, Terendak
6 95 Hospital Angkatan Tentera, Kinrara
7 96 Hospital Angkatan Tentera, Lumut
8 Alor Setar Hospital
9 Baling Hospital
10 Batu Pahat Hospital
11 Besut Hospital
12 Bintulu Hospital
13 Bukit Mertajam Hospital
14 Dutches of Kent Hospital
15 HTAA, Kuantan
16 Ipoh Hospital
17 Kajang Hospital
18 Kangar Hospital
19 Kemaman Hospital
20 Keningau Hospital
21 Kluang Hospital
22 Kota Bharu Hospital
23 Kuala Krai Hospital
24 Kuala Lumpur Hospital
25 Kuala Nerang Hospital
26 Kuala Pilah Hospital
27 Kuala Terengganu Hospital
28 Kuching Hospital
32 Melaka Hospital
33 Mentakab Hospital
34 Miri Hospital
35 Muar Hospital
36 Pulau Pinang Hospital
37 Pusat Hemodialisis KEMENTAH (KL)
38 Pusat Rawatan Angkatan Tentera (KB)
39 Queen Elizabeth Hospital
40 Raub Hospital
41 Segamat Hospital
42 Selayang Hospital
43 Seremban Hospital
44 Sg Petani Hospital
45 Sibu Hospital
46 Sik Hospital
47 Sultanah Aminah Hospital
48 Taiping Hospital
49 Tawau Hospital
50 Teluk Intan Hospital
51 Tg Ampuan Rahimah
52 Universiti Kebangsaan Malaysia Hospital
53 Universiti Sains Malaysia Hospital
54 University Hospital
NON-GOVERNMENT ORGANISATION (NGO) DIALYSIS CENTRES
1 Amitabha Centre
2 Bakti-NKF Dialysis Centre, Kelang 3 Berjaya NKF Dialysis Centre, PJ 4 Buddhist Tzu Chi Dialysis Centre 5 Charis-NKF Dialysis Centre, Cheras
6 Che Eng Khor Haemodialysis Centre
7 CHKMUS-MAA Medical Charity Centre
8 Fo En Haemodialysis Centre
9 Haemodialysis Association Klang
10 JB Lions MAA Medical Charity Dialysis Centre 11 KAS-Rotary/NKF Dialysis Centre, Sarawak 12 Kiwanis Dialysis Centre
13 Lions Club of Alor Setar-NKF Dialysis Centre 14 MAA Medical Charity Dialysis Centre, Butterworth 15 MAA Medical Charity Dialysis Centre, Cheras 16 MAA Medical Charity Dialysis Centre, KL
17 MAA Medical Charity Dialysis Centre, Teluk Intan 18 MMA Medical Charity Dialysis Centre, Kajang 19 Moral Uplifting-NKF Dialysis Centre, Ipoh 20 Muar Lions Renal Centre
21 National Kidney Foundation Dialysis Centre, KL 22 Pahang Buddhist Association Haemodialysis Centre
23 Persatuan Buah Pinggang Sabah, KK
24 Persatuan Bulan Sabit Merah Cawangan Miri 25 Pertubuhan Hemodialisis SPS, Penang
26 Pusat Hemodialisis (MCA Cawagan Pasar Meru), Kelang 27 Pusat Hemodialisis Darul Iltizam, Ipoh
28 Pusat Hemodialisis Manjong-NKF, Setiawan
29 Pusat Hemodialisis Mawar Negeri Sembilan, Bahau 30 Pusat Hemodialisis Mawar Negeri Sembilan, Lukut 31 Pusat Hemodialisis Mawar Negeri Sembilan, Seremban
32 Pusat Hemodialisis Persatuan Membaiki Akhlak Che Luan Khor 33 Pusat Rawatan Islam Sdn. Bhd. (PJ)
34 Rotary Club Of Damansara-NKF Dialysis Centre, Kepong 35 Sibu Kidnwy Foundation Haemodialysis Centre
36 TDC-NKF Trengganu Dialysis Centre
PRIVATE CENTRES
1 Aiman Dialysis Centre
2 Ampang Puteri Specialis Hospital
3 Assunta Hospital
5 Bangsar Dialysis Centre
6 Bercham Dialysis Centre
4 BP Renal Care Sdn. Bhd.
7 Bukit Mertajam Specialist Hospital
8 C. S. Loo Kidney & Medical Specialist Centre 9 Damai Medical & Heart Clinic
10 Damansara Specialist Hospital
11 Fo Yi Haemodialysis Centre
12 Healthcare Dialysis Centre
13 Ipoh Dialysis Centre
14 Ipoh Specialist
15 Island Hospital
16 K K Tan Specialist Centre 17 Klinik Pakar Dialisis (Smartcare) 18 Kota Bharu Medical Centre 19 Kuantan Specialist Centre
20 Lam Wah Ee Hospital
21 Lifeline Dialysis Clinic
22 Loh Guan Lye Specialist Centre
23 Mahkota Medical Centre
24 Mawar Medical Centre
25 Metro Specialist Hospital
26 Normah Medical Specialist Centre 27 Pantai Medical Centre
28 Pantai Mutiara Medical 29 Pathlab Dialysis Centre 30 Penang Adventist Hospital
31 Perdana Dialysis Centre Sdn. Bhd., Ipoh 32 Pusat Dialisis Penawar
41 Renal Link (Kelantan) Sdn. Bhd 42 Renal Link Sdn. Bhd., Penang 43 Renal- Link Sentosa Sdn. Bhd. 44 Renal Medicare Centre Sdn. Bhd.
45 Renal-Care Perubatan (Johor Specialist) 46 S. P. Menon Dialysis Centre, Kelang 47 S. P. Menon Dialysis Centre, KL 48 S. P. Menon Dialysis Centre, PJ 49 Seberang Perai Bagan Specialist 50 Selangor Medical Centre
51 Sri Kota Medical Centre 52 Strand Specialist Hospital 53 Subang Jaya Medical Centre
54 Sunway Medical Centre
55 System Dialysis Centre
56 The Southern Hospital
57 The Straits Hospital
58 Timberland Medical Centre 59 Tung Shin Hospital
The Malaysian Organ Sharing System/National Renal Registry
(MOSS/NRR) Committee
MALAYSIAN SOCIETY OF NEPHROLOGY
Chairman:
Dr. Zaki Morad Mohd Zaher
Secretary:
Dr. Y.N. Lim
Treasurer:
Dr. Anthony Chan
Members:
Professor Dr. Norella Kong
Professor Dr. S.Y. Tan
Dr. T. O Lim
Dr. Ghazali Ahmad
Dr. B.L. Goh
THE WORKING COMMITTEE
MOSS/NRR
MALAYSIAN SOCIETY OF NEPHROLOGY
Chairman: Zaki Morad Mohd Zaher
Treasurer:
Anthony Chan
Editor: T.O. Lim
Assistant Editor
Y.N. Lim
Data Coordinator: Lee Day Guat
Data Entry Clerk: Zudiana bt Zulkafli
CONTENTS
PAGE
INTRODUCTION
1REPORT SUMMARY
2METHOD
111. RENAL REPLACEMENT THERAPY IN MALAYSIA
131.1. Stock and Flow 14
1.2. Treatment Provision Rate 16
2. DIALYSIS IN MALAYSIA
182.1. Dialysis Treatment Provision 19
2.2. Patient Demographics 22
2.3. Method And Location 25
2.4. Primary Renal Disease 26
2.5. Death On Dialysis 27
2.6 Dialysis centre, capacity and treatment provision (centre survey)
293. HAEMODIALYSIS IN MALAYSIA
353.1.HAEMODIALYSIS IN GOVERNMENT CENTRES
363.1.1. Stock and Flow 37
3.1.2. Place of Haemodialysis and its Finance 38 3.1.3. Death on Haemodialysis and transfer to PD 40 3.1.4. Government Haemodialysis Centres 42 3.1.5. Haemodialysis Patient Characteristics 44
3.1.6. Survival Analysis 46
3.2. HAEMODIALYSIS IN NGO CENTRES
783.2.1. Stock and Flow 79
3.2.3. Death on Haemodialysis 80
3.2.4 NGO Haemodialysis Centres 82 3.2.5. Haemodialysis Patient Characteristics 84
3.2.9 Dyslipidaemias in HD Patients 95
3.3. HAEMODIALYSIS IN PRIVATE CENTRES
1183.3.1 Stock and Flow 119
3.3.3 Death on Haemodialysis 120
3.3.5 Haemodialysis Patient Characteristics 122
3.3.6 Survival Analysis 124
4. CHRONIC PERITONEAL DIALYSIS
1404.1. Stock and Flow 141
5. RENAL TRANSPLANTATION
1765.1. Stock and Flow 177
LIST OF TABLES
PAGE
ALL RENAL REPLACEMENT THERAPY
Table 1.01 Stock and Flow of RRT, 1992 - 1999 14 Table 1.02 New Dialysis Acceptance Rate and New Transplant Rate per million
population 1992 - 1999 16
Table 1.03 RRT Prevalence Rate per million population 1992 - 1999 17
ALL DIALYSIS PATIENTS
Table 2.01 Stock and flow – Dialysis Patients 1992 - 1999 19 Table 2.02 Dialysis Treatment Rate per million population 1992 - 1999 19 Table 2.03 Dialysis Treatment Rate by State, per million state population 1999 19 Table 2.04 Dialysis Treatment Rate by Gender, per million male or female population
1996 - 1999 20
Table 2.05 Dialysis Treatment Rate by Age Group 1996 - 1999 21 Table 2.06 Percentage Age Distribution of Dialysis Patients 1996 - 1999 22 Table 2.07 Gender distribution of Dialysis Patients 1996 – 1999 24 Table 2.08 Method and Location of Dialysis 25 Table 2.09 Primary Renal Disease, 1996 – 1999 26 Table 2.10 Deaths on Dialysis 1992 – 1999 27 Table 2.11 Causes of Death on Dialysis 1996 - 1999 28 Table 2.12 Number of dialysis centres, number of HD machines and treatment
capacity, HD capacity to patient ratio by state 2000 29 Table 2.13 Number of dialysis centres, dialysis patients and HD machines and
treatment capacity by sector, 2000 32
HAEMODIALYSIS IN GOVERNMENT CENTRES
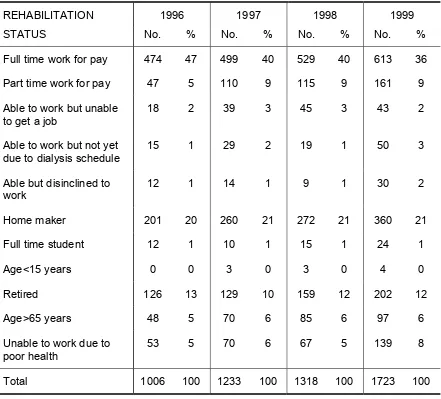
Table 3.1.01 Stock and flow, Government Centres 1992 – 1999 37 Table 3.1.02 Place for HD, Government Centres 1996 - 1999 38 Table 3.1.03 Finance for HD, Government Centres, 1996 – 1999 39 Table 3.1.04 HD Death Rate and Transfer to PD, Government Centres 1992 - 1999 40 Table 3.1.05 Causes of Death on HD, Government Centres 1996 – 1999 41 Table 3.1.07 Centre Distribution of HD patients, Government Centres 1999 42 Table 3.1.08 Age Distribution of HD patients, Government Centres 1996 – 1999 44 Table 3.1.09 HD Patient Characteristics, Government Centres 1996 - 1999 45 Table 3.1.10 HD patient survival related to Year of Entry, 1994 – 1999 46 Table 3.1.11 HD Technique Survival related to Year of Entry, 1994 – 1999 47 Table 3.1.12 Work Related Rehabilitation on HD, Government Centres, 1996 - 1999 48 Table 3.1.13 Quality of Life on Haemodialysis, Government Centres, 1996 - 1999 49 Table 3.1.14 Vascular Access on Haemodialysis, Government Centres, 1996 - 1999 50 Table 3.1.15 Difficulties reported with Vascular Access, Government Centres 1996–
1999 50
Table 3.1.16 Complications reported with Vascular Access, Government Centres 1996
– 1999 51
Table 3.1.22 Dialysate Buffer used in Government HD Units, 1996 – 1999 53
LIST
OF
TABLES
PAGE
Table 3.1.23 Distribution of Prescribed KT/V, Government Centres 1996 – 1999 54 Table 3.1.24 Distribution of Serum Cholesterol Levels, , Government Centres 1996 –
1999 55
Table 3.1.25 Distribution of Serum Triglyceride, HD patients, Government Centres
1996 - 1999 56
Table 3.1.26 Distribution of serum LDL, HD patients Government Centres 1996 – 1999
57 Table 3.1.27: Distribution of serum HDL, HD patients, Government Centres 1996 –
1999 58
Table 3.1.28: Treatment for Renal Bone Disease, HD patients, Government Centres 1996
– 1999 59
Table 3.1.29 Distribution of serum phosphate concentration, HD patients, Government
Centres 1996 – 1999 59
Table 3.1.30 Distribution of serum Calcium, HD patients, Government Centres 1996 –
1999 60
Table 3.1.31 Distribution of serum iPTH, HD patients, Government Centres 1996 –
1999 61
Table 3.1.32 Treatment for hypertension, HD patients, Government Centres 1996 –
1999 62
Table 3.1.33 Distribution of Systolic BP without anti-hypertensives, HD patients,
Government Centres 1996 – 1999 62 Table 3.1.34 Distribution of Diastolic BP without anti-hypertensives, HD patients,
Government Centres 1996 – 1999 63 Table 3.1.35 Distribution of systolic BP on anti-hypertensives, HD patients,
Government Centres 1996 – 1999 64 Table 3.1.36: Distribution of diastolic BP on anti-hypertensives, HD patients,
Government Centres 1996 – 1999 65 Table 3.1.37 Treatment for Anaemia, HD patients, Government Centres 1996 – 1999 66 Table 3.1.38 Distribution of rHuEpo dose, HD patients, Government Centres 1996 –
1999 66
Table 3.1.39 Distribution of serum Iron without rHuEpo, HD patients, Government
Centres 1996 – 1999 67
Table 3.1.40: Distribution of serum Iron on rHuEpo, HD patients, Government Centres
1996 – 1999 68
Table 3.1.41 Distribution of serum Transferrin Saturation without rHuEpo, HD patients, Government Centres 1996 – 1999 69 Table 3.1.42 Distribution of serum Transferrin Saturation on rHuEpo, HD patients,
Government Centres 1996 – 1999 70 Table 3.1.43 Distribution of serum Ferritin without rHuEpo, HD patients, Government
Table 3.1.48 Distribution of BMI, HD patients, Government Centres 1996 – 1999 76 Table 3.149: Prevalence of positive anti-HCV and HBsAg HD patients, Government
Centres 1996 -1999 77
HAEMODIALSYSIS IN NGO CENTRES
Table 3.2.01 Stock and Flow: NGO Centres 1996 – 1999 79
Table 3.2.04 Death Rate on HD: NGO Centres 1996 – 1999 80 Table 3.2.05 Causes of Death: NGO Centres 1996 – 1999 81 Table 3.2.07 Centre Distribution of HD patients, NGO Centres 82 Table 3.2.08 Age Distribution of Dialysis Patients, NGO Centres 1996 – 1999 84 Table 3.2.09 Patients’ Characteristics , NGO Centres 1996 – 1999 85 Table 3.2.10 HD Patient Survival, NGO Centres 1994-1999 86 Table 3.2.11 HD Technique Survival, NGO Centres 1994-1999 87 Table 3.2.12 Work Related Rehabilitation on HD, NGO Centres, 1997 – 1999 88 Table 3.2.13 Quality of Life on Haemodialysis, NGO Centres, 1997 – 1999 89 Table 3.2.14 Vascular Access on Haemodialysis, NGO Centres, 1997 – 1999 90 Table 3.2.15 Difficulties reported with Vascular Access, NGO Centres 1997 – 1999 90 Table 3.2.16 Complications reported with Vascular Access, NGO Centres 1997 – 1999 91 Table 3.2.17
Blood Flow Rates in NGO HD Units, 1997 – 1999 91 Table 3.2.18 Number of HD sessions/week, NGO HD Units, 1997 – 1999 92 Table 3.2.19 Duration of HD per session, NGO Centres, 1997 – 1999 92 Table 3.2.20 Dialyser membrane types in NGO Centres, 1997 – 1999 92 Table 3.2.21 Dialyser Reuse Frequency in NGO HD Centres, 1997 – 1999 93 Table 3.2.22 Dialysate Buffer used in NGO HD Centres, 1997 – 1999 93 Table 3.2.23 Distribution of Prescribed KT/V, NGO Centres 1996 – 1999 94 Table 3.2.24 Distribution of Serum Cholesterol Levels , HD patients, NGO Centres
1996 – 1999 95
Table 3.2.25 Distribution of Serum Triglyceride concentration, HD patients, NGO
Centres 1996 – 1999 96
Table 3.2.26 Distribution of serum LDL, HD patients, NGO Centres 1996 – 1999 97 Table 3.2.27 Distribution of serum HDL, HD patients, NGO Centres 1996 – 1999 98 Table 3.2.28 Treatment for Renal Bone Disease, HD patients, NGO Centres 1996 –
1999 99
Table 3.2.29: Distribution of serum Phosphate, HD patients, NGO Centres 1996 – 1999 99 Table 3.2.30 Distribution of serum Calcium, HD patients, NGO Centres 1996 – 1999 100 Table 3.2.31 Distribution of serum iPTH, HD patients, NGO Centres 1996 – 1999 101 Table 3.2.32 Treatment for hypertension, HD patients, NGO Centres 1996 – 1999 102 Table 3.2.33 Distribution of Systolic BP without anti-hypertensives, HD patients, NGO
Centres 1996 – 1999 102
Table 3.2.34 Distribution of Diastolic BP without anti-hypertensives, HD patients, NGO
Centres 1996 – 1999 103
Table 3.2.35 Distribution of systolic BP on anti-hypertensives, HD patients, NGO
Centres 1996 – 1999 104
Table 3.2.36 Distribution of diastolic BP on anti-hypertensives, HD patients, NGO
Centres 1996 – 1999 105
Table 3.2.40 Distribution of serum Iron on rHuEpo,HD patients, NGO Centres 1996 –
1999 108
Table 3.2.41 Distribution of serum Transferrin Saturation without rHuEpo, HD patients,
NGO Centres 1996 – 1999 109
Table 3.2.42 Distribution of serum Transferrin Saturation on rHuEpo, HD patients,
NGO Centres 1996 – 1999 110
Table 3.2.43 Distribution of serum Ferritin without rHuEpo, HD patients, NGO Centres
1996 – 1999 111
Table 3.2.44 Distribution of serum Ferritin on rHuEpo, HD patients, NGO Centres 1996
– 1999 112
Table 3.2.45 Distribution of Haemoglobin without rHuEpo HD patients, NGO Centres
1996 – 1999 113
Table 3.2.46 Distribution of Haemoglobin on rHuEpo HD patients, NGO Centres 1996
– 1999 114
Table 3.2.47 Distribution of serum Albumin HD patients, NGO Centres 1996–1999 115 Table 3.2.48 Distribution of Body Mass Index, HD patients, NGO Centres 1996 –
1999 116
Table 3.2.49 Prevalence of positive anti-HCV and HBsAg 117
HEAMODIALYSIS IN PRIVATE CENTRES
Table 3.3.33 Distribution of Systolic BP without anti-hypertensives, HD patients,
Private Centres, 1999 134
Table 3.3.34 Distribution of Diastolic BP without anti-hypertensives, HD patients,
Private Centres, 1999 134
Table 3.3.35 Distribution of systolic BP on anti-hypertensives, HD patients, Private
Centres, 1999 134
Table 3.3.36 Distribution of diastolic BP on anti-hypertensives, HD patients, Private
Centres, 1999 134
Table 3.3.37 Treatment for Anaemia, HD patients, Private Centres, 1999 135 Table 3.3.38 Distribution of rHuEpo dose, HD patients, Private Centres, 1999 135 Table 3.3.39 Distribution of serum Iron without rHuEpo, HD patients, Private Centres,
1999 135
Table 3.3.40: Distribution of serum Iron on rHuEpo, HD patients, Private Centres, 1999 135 Table 3.3.41 Distribution of serum Transferrin Saturation without rHuEpo, HD patients,
Private Centres, 1999 136
Table 3.3.42 Distribution of serum Transferrin Saturation on rHuEpo, HD patients,
Private Centres, 1999 136
Table 3.3.43 Distribution of serum Ferritin without rHuEpo, HD patients, Private
Centres, 1999 136
Table 3.3.44 Distribution of serum Ferritin on rHuEpo, HD patients, Private Centres,
1999 136
Table 3.3.45 Distribution of Haemoglobin without rHuEpo HD patients, Private Centres,
1999 136
Table 3.3.46 Distribution of Haemoglobin on rHuEpo HD patients, Private Centres,
1999 137
Table 3.3.47 Distribution of serum Albumin, HD patients, Private Centres, 1999 138 Table 3.3.48 Distribution of BMI, HD patients, Private Centres, 1999 138 Table 3.3.49: Prevalence of positive anti-HCV and HBsAg HD patients, Private Centres,
1999 139
CAPD, GOVERNMEMT CENTRES
Table 4.01
Table 4.26 Distribution of serum LDL, CAPD patients 1996 – 1999 155 Table 4.27 Distribution of serum HDL, CAPD patients 1996 – 1999 156 Table 4.28 Treatment for Renal Bone Disease CAPD patients 1996 – 1999 157 Table 4.29 Distribution of serum Phosphate , CAPD patients 1996 – 1999 157 Table 4.30 Distribution of serum Calcium , CAPD patients 1996 – 1999 158 Table 4.31 Distribution of serum iPTH, CAPD patients, 1996 – 1999 159 Table 4.32 Treatment for hypertension, CAPD patients, 1996 – 1999 160 Table 4.33 Distribution of Systolic BP without anti-hypertensives, CAPD patients,
1996 – 1999 160
Table 4.34 Distribution of Diastolic BP without anti-hypertensives, CAPD patients,
1996 – 1999 161
Table 4.35 Distribution of systolic BP on anti-hypertensives, CAPD patients, 1996 –
1999 162
Table 4.36 Distribution of diastolic BP on anti-hypertensives, CAPD patients, 1996 –
1999 163
Table 4.37 Treatment for Anaemia, CAPD patients, 1996 – 1999 164 Table 4.38 Distribution of rHuEpo dose, CAPD patients 1996 – 1999 164 Table 4.39 Distribution of serum Iron without rHuEpo, CAPD patients 1996 – 1999 165 Table 4.40 Distribution of serum Iron on rHuEpo, CAPD patients, 1996 – 1999 166 Table 4.41 Distribution of serum Transferrin Saturation without rHuEpo, CAPD
patients, 1996 – 1999 167
Table 4.42 Distribution of serum Transferrin Saturation on rHuEpo, CAPD patients,
1996 – 1999 168
Table 4.43 Distribution of serum Ferritin without rHuEpo,CAPD patients, 1996 –
1999 169
Table 4.44 Distribution of serum Ferritin on rHuEpo, ,CAPD patients, 1996 – 1999 170 Table 4.45 Distribution of Haemoglobin without rHuEpo, CAPD patients, 1996 –
1999 171
Table 4.46 Distribution of Haemoglobin on rHuEpo, CAPD patients, 1996 – 1999 172 Table 4.47 Distribution of serum Albumin, CAPD patients, 1996 – 1999 173 Table 4.48 Distribution of BMI CAPD patients, 1996 – 1999 174 Table 4.49 Prevalence of positive anti-HCV and HBsAg, CAPD patients, 1996 – 1999
175
RENAL TRANSPLANTATION
LIST OF FIGURES PAGE
ALL RENAL REPLACEMENT THERAPY
Figure 1.01(a) Stock and Flow-of RRT: New dialysis and transplants 1992-1999
15
Figure 1.01(b) Stock and Flow-of RRT: Patients dialysing and with functioning
transplants 1992-1999
15
Figure 1.02
New Dialysis Acceptance and New Transplant Rate 1992 - 1999
16
Figure 1.03
Dialysis and Transplant Prevalence Rate per million population
1992 - 1999
17
DIALYSIS IN MALAYSIA
Figure 2.04
Dialysis Treatment by Gender 1996 - 1999
20
Figure 2.05
Dialysis Acceptance Rate by Age Group, 1996 - 1999
21
Figure 2.06
Age Distribution of New Dialysis patients, 1996 – 1999
23
Figure 2.07
Gender Distribution of New Dialysis patients, 1996 – 1999
24
Figure 2.08
Method and Location of New Dialysis Patients
25
Figure 2.10
Death Rates on Dialysis, 1992 – 1999
27
Figure 2.12(a) Distribution of dialysis centres by state, 2000
30
Figure 2.12(b) Distribution of dialysis patients by state, 2000
30
Figure 2.12(c) Distribution of patients per million population by state, 2000
31
Figure 2.12(d) HD capacity to patient ratio by state, 2000
31
Figure 2.13(a) Distribution of dialysis by Sector. 2000
32
Figure 2.13(b) Distribution of HD capacity by Sector. 2000
33
Figure 2.13(c) Distribution of dialysis patients by Sector. 2000
33
Figure 2.13(d) HD capacity: patient ratio by Sector. 2000
34
HAEMODIALYSIS IN MALAYSIA
HAEMODIALYSIS IN GOVERNMENT CENTRES
Figure 3.1.01
Stock and Flow HD patients, Government Centres 1992 - 1999
37
Figure 3.1.02
Place of HD, Government Centres 1996 - 1999
38
Figure 3.1.03
Finance for new HD, Government Centres, 1996 – 1999
39
Figure 3.1.04
Death Rate on HD, Government Centres 1992 – 1999
40
Figure 3.1.10
HD Patient Survival related to Year of Entry, 1995– 1999
46
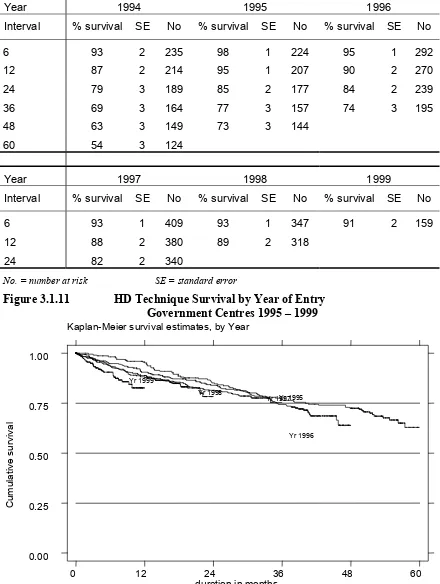
Figure 3.1.11
HD Technique Survival related to Year of Entry, 1995 – 1999
47
Figure 3.1.23
Cumulative Distribution of Prescribed KT/V by Year
54
Figure 3.1.24
Cumulative distribution of serum cholesterol by year
55
Figure 3.1.25
Cumulative distribution of serum triglyceride by year
56
Figure 3.1.26
Cumulative distribution of serum LDL by year
57
Figure 3.1.27
Cumulative distribution of serum HDL by year
58
Figure 3.1.29
Cumulative Distribution of serum Phosphate by year
59
Figure 3.1.30
Cumulative distribution of Serum Calcium by year
60
Figure 3.1.34
Cumulative Distribution of Diastolic BP without
anti-hypertensives by year
63
Figure 3.1.35
Cumulative Distribution of systolic BP on anti-hypertensives, by
year 64
Figure 3.1.36
Cumulative Distribution of diastolic BP on anti-hypertensives by
year 65
Figure 3.1.39
Cumulative Distribution of serum Iron without rHuEpo by year
67
Figure 3.1.40
Cumulative Distribution of serum Iron on rHuEpo,by year.
68
Figure 3.1.41
Cumulative Distribution of serum Transferrin Saturation without
rHuEpo by year
69
Figure 3.1.42
Cumulative Distribution of serum Transferrin Saturation on
rHuEpo by year
70
Figure 3.1.43 Cumulative Distribution of serum Ferritin without rHuEpo by
year 71
Figure 3.1.44
Cumulative Distribution of serum Ferritin on rHuEpo, by year
72
Figure 3.1.45
Cumulative Distribution of Haemoglobin without rHuEpo by year
73
Figure 3.1.46
Cumulative Distribution of Haemoglobin on rHuEpo, by year
74
Figure 3.1.47
Cumulative Distribution of serum Albumin by year
75
Figure 3.1.48
Cumulative Distribution of BMI by year
76
Figure 3.1.49
Prevalence of positive anti-HCV and HBsAg, HD patients,
Government Centres 1996 – 1999
77
HAEMODIALYSIS IN NGO CENTRES
Figure 3.2.01
Stock and Flow, HD patients, NGO Centres 1992 - 1999
79
Figure 3.2.04
Death Rate on HD: NGO Centres to 1999
80
Figure 3.2.10
HD Patient Survival related to Year of Entry 1995 – 1999
86
Figure 3.2.11
HD Technique Survival related to Year of Entry 1996 – 1999
87
Figure 3.2.23
Cumulative Distribution of Prescribed KT/V by Year
94
Figure 3.2.24
Cumulative distribution of serum cholesterol by year
95
Figure 3.2.25
Cumulative distribution of serum triglyceride by year
96
Figure 3.2.26
Cumulative distribution of serum LDL by year
97
Figure 3.2.27
Cumulative distribution of serum HDL by year
98
Figure 3.2.29
Cumulative Distribution of serum Phosphate by year
99
Figure 3.2.30
Cumulative distribution of Serum Calcium by year
100
Figure 3.2.31
Cumulative Distribution of serum iPTH by year,
101
Figure 3.2.33
Cumulative Distribution of Systolic BP without
anti-hypertensives by year
102
Figure 3.2.34
Cumulative Distribution of Diastolic BP without
anti-hypertensives by year
103
Figure 3.2.42
Cumulative Distribution of serum Transferrin Saturation on
rHuEpo by year
110
Figure 3.2.43 Cumulative Distribution of serum Ferritin without rHuEpo by
year
111
Figure 3.2.44
Cumulative Distribution of serum Ferritin on rHuEpo, by year
112
Figure 3.2.45
Cumulative Distribution of Haemoglobin without rHuEpo by year
113
Figure 3.2.46
Cumulative Distribution of Haemoglobin on rHuEpo, by year
114
Figure 3.2.47
Cumulative Distribution of serum Albumin by year
115
Figure 3.2.48
Cumulative Distribution of BMI by year
116
Figure
3.2.49
Prevalence of positive anti-HCV and HD patients, NGO Centres
1996 – 1999
117
HAEMODIALYSIS IN PRIVATE CENTRES
Figure 3.3.01
Stock and Flow: Private HD Centres 1992 – 1999
119
Figure 3.3.04
Death rate on HD, Private Centres, 1993- 1999
124
Figure 3.3.10
HD Patient Survival related to Year of Entry Private Centres
120
Figure 3.3.11
HD Technique Survival related to Year of Entry Private centres
125
CAPD IN GOVERNMENT CENTRES
Figure 4.01
Stock and Flow CAPD patients, Government Centres 1992 –
1999 141
Figure 4.03
Funding for new CAPD, Government Centres, 1996 – 1999
142
Figure 4.04
Death Rates on CAPD, Government Centres 1992 - 1999
143
Figure 4.10
CAPD Patient Survival related to Year of Entry 1994 – 1999
148
Figure 4.11
CAPD Technique Survival related to Year of Entry 1994 – 1999
149
Figure 4.24
Cumulative distribution of serum cholesterol by year
153
Figure 4.25
Cumulative distribution of serum triglyceride by year
154
Figure 4.26
Cumulative distribution of serum LDL by year
155
Figure 4.27
Cumulative distribution of serum HDL by year
156
Figure 4.29
Cumulative Distribution of serum Phosphate by year
157
Figure 4.30
Cumulative distribution of Serum Calcium by year
158
Figure 4.31
Cumulative Distribution of serum iPTH by year,
159
Figure 4.33
Cumulative Distribution of Systolic BP without
anti-hypertensives by year
160
Figure 4.34
Cumulative Distribution of Diastolic BP without
anti-hypertensives by year
161
Figure 4.35
Cumulative Distribution of systolic BP on anti-hypertensives, by
year 162
Figure 4.36
Cumulative Distribution of diastolic BP on anti-hypertensives by
year 163
Figure 4.39
Cumulative Distribution of serum Iron without rHuEpo by year
165
Figure 4.40
Cumulative Distribution of serum Iron on rHuEpo,by year.
166
Figure 4.41
Cumulative Distribution of serum Transferrin Saturation without
Figure 4.43
Cumulative Distribution of serum Ferritin without rHuEpo by
year
169
Figure 4.44
Cumulative Distribution of serum Ferritin on rHuEpo, by year
170
Figure 4.45
Cumulative Distribution of Haemoglobin without rHuEpo by year
171
Figure 4.46
Cumulative Distribution of Haemoglobin on rHuEpo, by year
172
Figure 4.47
Cumulative Distribution of serum Albumin by year
173
Figure 4.48
Cumulative Distribution of Body Mass Index by year
174
Figure 4.49
Prevalence of Positive Anti-HCV Antibody and HBsAg
175
RENAL TRANSPLANTATION
Figure 5.01
Stock and Flow Renal Transplant Patients, 1992 – 1999
177
Figure 5.04
Transplant Recipient Death Rate 1992– 1999
180
Figure 5.10
Transplant Patient Survival by Year of Transplant 1993 – 1999
185
INTRODUCTION
The 1999 report of the National Renal Registry marks another step forward in our efforts
to provide comprehensive and timely reports to our participating centres. The report is
released within the ensuing year. It is the aim of the committee to provide the report as
early as possible. The committee is seriously considering plans to go for online reporting
which will undoubtedly improve the timeliness of reporting. With electronic data
reporting we will be able to provide more services. Apart from its early release the 1999
report also recorded an increase in participation by the private sector providers of
dialysis. There has however been a decline in the reporting of transplant results. We hope
to improve on this with the employment of more staff.
The data for 1999 showed resumption in the growth of dialysis treatment rate reflecting
the nation's recovery from the Asian financial crisis. The dialysis acceptance rate
increased to 60 per million population while the new renal transplant rate showed a
modest increase to 4 per million population up from 3 the year before. Hemodialysis was
still the main form of renal replacement therapy. CAPD constituted 14% of new dialysis
patients. Dialysis practices in the government centres remain similar to that in previous
years. In this report it was possible to analyse the data from private dialysis centres in a
manner similar to data from the government dialysis centres. There were some
differences in the practice of dialysis treatment between private and public funded
program.
The year 2000 budget announced by the Finance Minister recently offers hope and
reprieve for many dialysis patients. In the proposal the government will subsidise
RM50.00 for the cost of every dialysis the patient undergoes. This applies only to centres
run by non-profit non- governmental organisation. Further subsidies will also be given to
any NGO developing a new dialysis facility. This generous act by the government will
potentially increase significantly the number of new patients on dialysis. It will also
increase the work for the registry as one of the conditions proposed for the subsidy is data
submission to the registry. The registry will have to take steps to respond to this new
demand. I am confident that with the experience gained so far we shall be able to meet
this challenge.
Dr. Zaki Morad Mohd Zaher
Chairman
REPORT SUMMARY
Malaysia was still suffering from the effects of Asian financial crisis in 1999. Although there was some growth of dialysis treatment rate, it did not reach pre-crisis levels.
Participation from private dialysis centres had increased in 1999 and thus a more detailed report of haemodialysis treatment in the private centres is included in this report.
A new sub-section based on centre survey data rather than individual patient data for the year 2000 is included in chapter two to provide up-to-date information on patient and centre census in Malaysia.
1
ALL RENAL REPLACEMENT THERAPIES
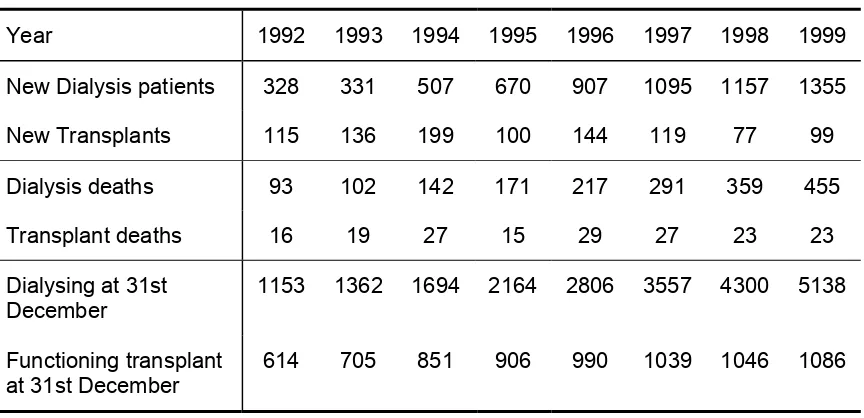
1.1 At 31st December 1999, 6224 patients were on renal replacement therapy, comprising 5138 on dialysis and 1086 with functioning transplants. 1355 new dialysis patients were accepted in 1999 compared to 1157 in 1997.
1.2 The new renal transplant rate was 4 per million population – a small increase compared to the rate in 1998. The overall dialysis acceptance rate had increased to 60 per million population and dialysis prevalence rate 227 per million population.
2 DIALYSIS
IN
MALAYSIA
2.1 Dialysis acceptance rate by state varied between 111 per million state population for Pulau Pinang to 25 per million per state population in Kelantan.
By age group, dialysis acceptance rate varied between a low of 3 per million child population to a high of 328 per million population for age group 55 to 64 years. Dialysis provision rate for patients older than 65 years was 261 per million population for age. A dramatic increase in dialysis treatment rate was seen in those more than 44 years of age.
2.2 Males made up 58% of all new dialysis patients
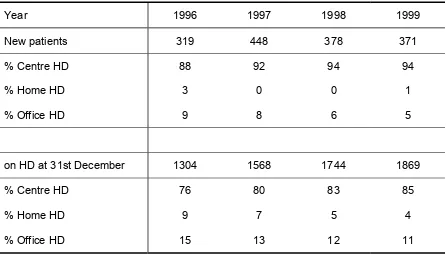
2.3 Haemodialysis (HD) accounted for 86% of new dialysis acceptance in1999 of which 84% were accepted in centre HD, and 2% in office HD. No new patients had been accepted into home HD programme from 1997. 14% of new dialysis patients were accepted into the CAPD programme.
2.6 Centre survey 2000: In a new dialysis centre survey for year 2000, there were a total of 7355 dialysis patients in Malaysia giving dialysis treatment rate was 316 per million population(pmp). There was a total of 196 dialysis centres with a total of 1989 dialysis machines.
By state, dialysis treatment rate ranged from 78 pmp in Kelantan to 605 pmp in Selangor and Wilayah Persekutuan. Centre HD capacity ranged from 790 pmp for Pulau Pinang to 108 in Sabah. HD capacity to patient ratio ranged from a low of 1.27 in Pahang to 2.37 in Kelantan.
3 HAEMODIALYSIS
3.1
Haemodialysis in Government Centres
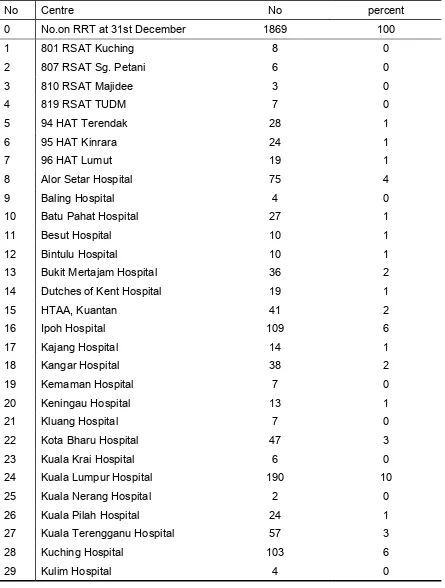
3.1.1 At 31st December 1999, 1869 patients were on HD in government centres - 85% were in centre HD, 4% in home HD and 11% in office HD.
3.1.2 94% of new patients were accepted into centre HD. 99% of new patients were financed by the government.
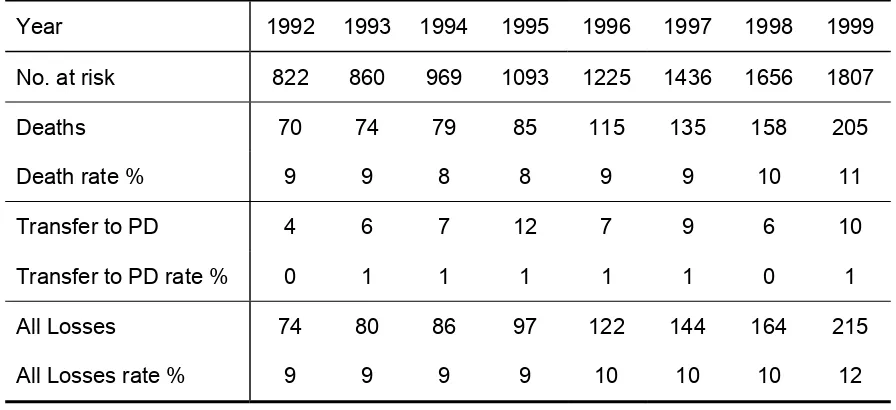
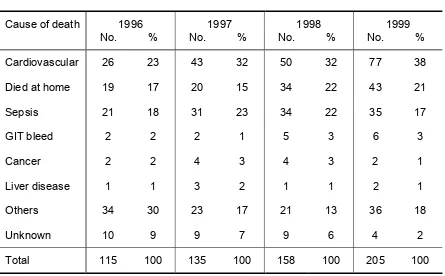
3.1.3 Death rate was 11% per year, highest for 10 years. Cardiovascular disorders, infections and deaths at home were the 3 commonest causes of death at 38%, 17% and 21% respectively
3.1.4 In 1999, there was a total of 55 government HD centres, 8 run by Ministry of Defence, 3 university hospital centres and the rest under the Ministry of Health.
3.1.5 New HD patients in 1999: Modal age-group 45 – 54 years; 64% males, 32% were diabetics, 7% had HBsAg, and 4% had anti-HCV antibodies.
3.1.6 Both HD patient and technique survival in government centres at 6 months for 1999 were similar at 91%.
3.1.7 Overall, 45% of HD patients were able to work part or full time. 66% had normal quality of life index.
3.1.8 Haemodialysis Practices: In 1999, 80% were dialysed via wrist AVF, 16% via brachiocephalic fistula. 90% reported no difficulties with their vascular access; only 19% had vascular access complications. 75% had blood flow rates between 200 –299 ml/min. The proportion with blood flow rate >299 ml increased to 22% in 1999. Almost all were on thrice-weekly dialysis, 93% on 4 hours per session. Use of cellulosic membrane dialysers decreased further to 37% and synthetic membrane dialyser usage increased to 40%; 99% reused their dialysers three times or more, 52% reused 6 times. Usage of bicarbonate buffer increased to 76%. Median prescribed KT/V increased to 1.5; and a higher proportion of patients (77%) achieved a KT/V of more than 1.3.
3.1.11 Blood pressure control: In 1999, 67% required anti-hypertensive therapy. Of these, 62% achieved systolic blood pressure(BP) < 160 mmHg, and 55% a diastolic blood pressure (BP)< 90 mmHg. Of the 33% not on anti-hypertensive therapy, 88% had systolic BP < 160 mmHg and 80% diastolic BP < 90 mmHg.
3.1.12 Management of anaemia: In 1999, 94% of patients were on oral iron supplements, IV iron use was very low at 5%. 48% of HD patients were on recombinant erythropoietin with 60% on 2000-4000 units weekly. 72% of those without erythropoietin and 74% on erythropoietin injections had serum iron > 10 umol/l. 70% of patients without erythropoietin and 77 % of those on erythropoietin supplements had serum ferritin > 100 ng/l. 10% and 8% of patients respectively without and with erythropoietin injections had haemoglobin concentration >12 g/dl.
3.1.13 Nutritional status: 60% of HD patients had serum albumin > 40 g/l with 61% with body mass index of between 18.5 and 25kg/m2. 20% had BMI <18.5 kg/m2.
3.1.14 Anti-HCV and HBsAg status: In 1999, 25% and 6% were positive for anti-HCV antibody and HBsAg respectively
3.2
Haemodialysis in Non-Governmental Organisation (NGO) Centres
3.2.1 At 31st December 1999, 1579 patients were haemodialysing in centres managed by NGOs. 445 new patients were accepted into the programme.
3.2.3 Death rate in NGO HD centres was 7% in 1999. Cardiovascular disorders, infections and deaths at home were the 3 commonest causes of death at 27%, 9% and 13% respectively.
3.2.4 In 1999, there was a total of 51 NGO dialysis centres; of which 9 were run by the National Kidney Foundation, 8 by MAA Medicare Charity and 7 by various Rotary Clubs.
3.2.5 New HD patients in 1999: Modal age-group 45-54 years; 58% were males, 41% were diabetics, 5% had HBsAg and 6% had anti-HCV antibodies.
3.2.6 HD patient and technique survival in NGO centres at 6 months for 1999 were similar at 97%
3.2.7 Overall, 33% of HD patients were able to work part or full time, 28% were homemakers. 55% had normal quality of life index.
3.2.8 Haemodialysis Practices: In 1999, 85% were dialysed via wrist
KT/V was 1.5; 73% had KT/V more than 1.3.
3.2.9 Dyslipidaemia in haemodialysis patients: In 1999, 67% of HD patients had serum cholesterol concentration < 5.3 mmol/l with median at 4.9 mmol/l. 88% had serum triglyceride concentration <3.5 mmol/l with median at 1.7 mmol/l.
3.2.10 Renal bone disease: In 1999, 92% of HD patients were on oral calcium carbonate, only 6% were on aluminium hydroxide and 30% on active vitamin D supplements. 31% achieved serum phosphate concentration <1.6 mmol/l; 57% had serum calcium concentration between 2.2 and 2.6 mmol/l and 19% with iPTH between 100 – 250 ng/l.
3.2.11 Blood pressure control: In 1999, 69% required anti-hypertensive therapy. Of these, 49% achieved systolic BP < 160 mmHg, and 58% diastolic BP < 90 mmHg. Of the 31% not on any anti-hypertensive therapy, 74% had systolic BP <160 mmHg and 73% diastolic BP < 90 mmHg.
3.2.12 Management of anaemia: In 1999, 54% were on recombinant erythropoietin with 70% on 2000 units weekly and 24% on 2000 – 4000 units weekly. 81% without erythropoietin and 80% on erythropoietin injections had serum iron > 10 umol/l. 7% of patients without erythropoietin and only 3% of those on erythropoietin had haemoglobin concentration >12 g/dl and 25% and 21% respectively had haemoglobin concentration between 10 and 12 g/dL..
3.2.13 Nutritional status: Proportion of patients with serum albumin concentration of >40 g/l was 42% in 1999. 60% had body mass index of between 18.5 and 25 kg/m2 with 15% with BMI <18.5 kg/m2.
3.2.14 Anti-HCV and HBsAg status: In 1999, 18% and 8% were positive for anti-HCV antibody and HBsAg respectively.
3.3
Haemodialysis In Private Centres
3.3.1 At 31st December 1999, 1118 patients were dialysing in private dialysis centres. 408 new patients were accepted for HD in private centres.
3.3.3 Death rate in private centres was 5% in 1999. Cardiovascular disorders, deaths at home and infections were the 3 commonest causes of death at 20%, 28% and 10% each respectively.
3.3.5 New HD patients in 1999: Modal age-group > 54 years; 55% were males, 45% were diabetics, 4% had HBsAg, 7% had anti-HCV antibody
access; only 11% had vascular access complications. 90% had blood flow rates between 200 and 299 ml/min. Only 66% were on thrice-weekly dialysis, 33% only had twice weekly dialysis. 74% had 4 hours for session, 13% 4.5 hours. The majority – 80% used cellulosic membrane dialysers; only 14% used synthetic membrane dialysers. 12% did not reuse dialysers, 80% reused their dialysers at least three times. Usage of bicarbonate buffer was 84%. Median prescribed KT/V was 1.5; 68% had KT/V more than 1.3.
3.3.9 Dyslipidaemia in haemodialysis patients: In 1999, 70% of HD patients had serum cholesterol concentration < 5.3 mmol/l with median at 5.0 mmol/l. 88% had serum triglyceride concentration <3.5 mmol/l with median at 1.7 mmol/l.
3.3.10 Renal bone disease: In 1999, 80% of HD patients were on oral calcium carbonate, only 6% were on aluminium hydroxide and 27% on active vitamin D supplements. 27% achieved serum phosphate concentration <1.6 mmol/l; 52% had serum calcium concentration between 2.2 and 2.6 mmol/l and 24% with iPTH between 100 – 250 ng/l.
3.3.11 Blood pressure control: In 1999, 62% required anti-hypertensive therapy. Of these, 51% achieved systolic BP < 160 mmHg, and 54% diastolic BP < 90 mmHg. Of the 38% not on any anti-hypertensive therapy, 69% had systolic BP <160 mmHg and 66% diastolic BP < 90 mmHg.
3.3.12 Management of anaemia: In 1999, 60% were on recombinant erythropoietin with 28% on 2000 units weekly and 65% on 2000 – 4000 units weekly. 27% of patients without erythropoietin and 34% on erythropoietin had haemoglobin concentration >10 g/dl. 23% still received blood transfusion.
3.3.13 Nutritional status: Proportion of patients with serum albumin concentration of >40 g/l was 24% in 1999. 60% had body mass index of between 18.5 and 25 kg/m2 with 15% with BMI <18.5 kg/m2.
4.
CONTINUOUS AMBULATORY PERITONEAL DIALYSIS (CAPD)
4.1 At 31st December 1999, 572 patients were on CAPD. There were 201 new CAPD patients of which 85% were funded by the government.
4.3 In 1999, death rate on CAPD was 18%; transfer to HD 7%. Death at home, cardiovascular disorders and sepsis were the main causes of death accounting for 33%, 27% and 15% respectively. The main cause of transfer was peritonitis at 62% followed by membrane failure and patient preference.
4.4 There were 12 CAPD centres all within the government sector.
4.5 New CAPD patients in 1999: Modal age-group 55-64 years; 53% males, 43% were diabetics, Only 1% had HBsAg, 4% were anti-HCV antibody positive.
4.6 CAPD patient and technique survival at 6 months for 1999 were 94% and 89% respectively.
4.7 Overall, 28% of CAPD patients were able to work part or full time. 28% were homemakers and 13% full time students. 66% had normal quality of life index.
4.8 CAPD Practices: In 1999, 96% were on standard CAPD dialysis regime; 58%
used the usual Baxter disconnect system; 42% were converted or started on a new disconnect system by Braun. 97% had 4 exchanges per day and 96% were on 2-litre exchanges
4.9 Dyslipidaemia in CAPD patients: In 1999, 48% of CAPD patients had serum
cholesterol concentration < 5.3 mmol/l with median at 5.5 mmol/l. 82% had serum triglyceride concentration <3.5 mmol/l with median at 1.9 mmol/l. 82% had LDL concentration <5 mmol/l with median at 3.4 mmol/l; and 96% had HDL concentration < 2 mmol/l with median at 1.1 mmol/l.
4.10 Renal bone disease: In 1999, 74% of CAPD patients were on oral calcium carbonate, only 6% were on aluminium hydroxide and 12% on active vitamin D supplements. 51% achieved serum phosphate concentration < 1.6 mmol/l; 55% had serum calcium concentration between 2.2 and 2.6 mmol/l and 17% with iPTH between 100 – 250 ng/l.
>10 g/l and 7% had haemoglobin concentration of >12% compared to 25% and 6% respectively for those on erythropoietin.
4.13 Nutritional status: 18% of CAPD patients had serum albumin > 40 g/l with 56% with body mass index of between 18.5 and 25 kg/m2. 22% had body mass index <18.5 kg/m2.
4.14 Anti-HCV and HBsAg status: In 1999, only 5% of CAPD had anti-HCV
5. RENAL
TRANSPLANTATION
5.1 At 31st December 1999, there were 1086 functioning renal transplants
5.2 Of 99 new transplant transplants in 1999, 37 were from living related donors, 10 from cadaveric donors; 3 from commercial living non-related donors; and 46 from commercial cadaveric donors.
5.3 In 1999, 2% of transplant recipients died and 4% lost their grafts. Sepsis was the commonest cause of death. Rejection accounted for 65% of graft loss.
5.4 91% of transplant recipients were followed up in government centres.
5.5 Modal age group for new transplant recipients was 35-44 years; 61% were males, 12% diabetics; 4% were HBsAg positive and 10% had anti-HCV antibodies at the time of transplantation.
5.6 Six month patient survival in 1999 was 99% and graft survival was 95%.
METHODS
1. COVERAGE
There were 198 dialysis centres in Malaysia as at 15th November 2000, of which 173
reported data to the Registry. Thus, centre coverage by the Registry is now 88%. This is
largely because the Registry database is now also used to generate the transplant waiting
list. We assessed patient ascertainment by comparing the Registry patient database and
data obtained from the annual independent centre survey. The survey was primarily
intended to update information on dialysis centres in the country for publication in the
“Directory of Dialysis Centres in Malaysia” but data on number of patients were also
sought to provide an up to date census of patient population in the country. Based on the
patient prevalence estimates calculated from these 2 independent sources of data (227
versus 253 patients/million population), we estimated the coverage of patient by the
Registry to be 90%.
2. STATISTICAL
ANALYSIS
Kaplan Meier method
1was used to estimate probability of survival and log rank test used
to compare survival function. Technique failure is defined as occurrence of death or
transfer to another modality of dialysis. Similarly, graft failure is defined as occurrence of
death or returned to dialysis.
Annual death rates were calculated by dividing the number of deaths in a year by the
estimated mid-year patient population.
For summarising continuous laboratory data, we have moved away from calculating
summary statistics like mean, standard deviation and instead plot the cumulative
frequency distribution graph. We are following the approach used by the UK Renal
Registry
2. Cumulative distribution plot shows a listing of the sample values of a variable
on the X axis and the proportion of the observations less than or greater than each value
on the Y axis. An accompanying table gives the Median (50% of values are above or
below it), upper quartile (UQ, 25% of values above and 75% below it) and lower quartile
(LQ, 75% of values above and 25% below it). Other percentiles can be read directly off
the cumulative distribution plot. The table also shows percent of observations above or
below a target value, or with an interval of values; the target value or interval obviously
vary with the type of laboratory data.. For example, target value for prescribed KT/V is
>1.3 and that for haemoglobin is >10 and <12 g/l. The choice of target value is arbitrary.
We await guidelines from the dialysis community for appropriate choice of target values
to set.
20
thDecember 2000. Centre response rate to the survey was 99.5% ( 197/198 responded).
Standard error estimates are not reported because no sample was taken. Results on
distribution by state are also expressed in per million-population since states obviously
vary in their population sizes. State population data are based on 2000 census population
projection. It is very difficult to estimate the amount of cross boundary patient flow; this
source of error is therefore not accounted for in computing state estimates. However, we
minimise the bias by combining states (Selangor and Wilayah Persekutuan, Kedah and
Perlis) based on geographical considerations. HD treatment capacity is derived by
assuming on average patients underwent 3 HD sessions per week and a centre can
maximally operate 2.5 shifts per day. A single HD machine can therefore support 5
patients’ treatment. Obviously HD treatment capacity is calculated only for centre HD.
The ratio of the number of centre HD capacity to number of centre HD patients is a
useful measure of utilisation of available capacity. Only 1 centre did not respond. As the
objective of this analysis is to estimate the total amount of dialysis provision in the
country, we obviously cannot simply ignore the missing data and confine the analysis to
available data. We therefore imputed the missing data based on regression imputation
model and guided by the imputation principles described by Little
3. The imputation
model included sector (public, NGO or private), state, year of operation, number of
dialysis personnel. These are well known correlates of level of dialysis provision in a
centre. The imputations are then drawn by predictive mean matching
3. Each centre with
missing data was match with each respondent on its predicted values. We then use the
data of the centre with the closest match to impute the missing data.
References
:
1. Kaplan EL, Meier P. Non-parametric estimation from incomplete observations.
J Am
Stat Assoc
1958; 53:457-81
2. UKRENALREG 1998 UK Renal Registry, Bristol, UK.
3. Little RJ. Missing data adjustments in large surveys. J Business Econ statistics
1988;6:287-301
RENAL REPLACEMENT THERAPY
IN
MALAYSIA
Stock and Flow
I. RENAL REPLACEMENT THERAPY IN MALAYSIA
1.1 STOCK AND FLOW
Table 1.01
Stock and Flow of RRT, 1992 - 1999
Year 1992 1993 1994 1995 1996 1997 1998 1999
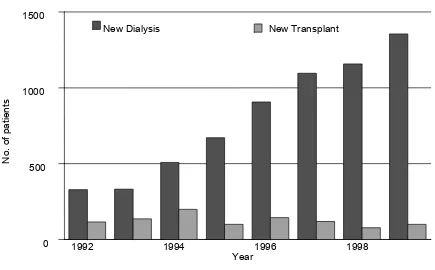
New Dialysis patients 328 331 507 670 907 1095 1157 1355
New Transplants 115 136 199 100 144 119 77 99
Dialysis deaths 93 102 142 171 217 291 359 455
Transplant deaths 16 19 27 15 29 27 23 23
Dialysing at 31st December
1153 1362 1694 2164 2806 3557 4300 5138
Functioning transplant at 31st December
(a) New Dialysis and Transplant patients
New Dialysis New Transplant
1992 1994 1996 1998
(b) Patients Dialysing and with Functioning Transplants
at 31
stDecember 1992 – 1999
Dialysing at 31st December
Functioning transplant at 31st December
1992 1994 1996 1998
1.2 TREATMENT PROVISION RATE
Table 1.02
New Dialysis Acceptance Rate and New Transplant Rate per million
population 1992 - 1999
_
Acceptance rate 1992 1993 1994 1995 1996 1997 1998 1999
New Dialysis 18 17 26 32 43 51 52 60
New Transplant 6 7 10 5 7 5 3 4
Figure 1.02 New Dialysis Acceptance and New Transplant Rate 1993 - 1999
R
Dialysis Transplant
Table 1.03 RRT Prevalence Rate per million population 1992 – 1999
Prevalence rate 1992 1993 1994 1995 1996 1997 1998 1999
Dialysis 62 71 86 105 133 164 195 227
Transplant 33 37 43 44 47 48 47 48
Figure 1.03
Dialysis and Transplant Prevalence Rate per million population
1993 - 1999
Dialysis Transplant
DIALYSIS IN MALAYSIA
Dialysis Treatment Provision
Patient Demographics
Method and Location
Primary Renal Disease
Death on Dialysis
2. DIALYSIS IN MALAYSIA
2.1 DIALYSIS TREATMENT PROVISION
Table 2.01
Stock and flow – Dialysis Patients 1992 – 1999
Year 1992 1993 1994 1995 1996 1997 1998 1999
New Dialysis
Dialysing at 31st December
1153 1362 1694 2164 2806 3557 4300 5138
Table 2.02
Dialysis Treatment Rate per million population 1992 – 1999
Year 1992 1993 1994 1995 1996 1997 1998 1999
Acceptance rate 18 17 26 32 43 51 52 60
Prevalence rate 62 71 86 105 133 164 195 227
Table 2.03 Dialysis Treatment Rate by State, per million state population 1999
STATE ACCEPTANCE RATE
Pulau Pinang 111
Negeri Sembilan Darul Khusus 93
Johor Darul Takzim 88
Selangor & W.Persekutuan 83
Negeri Melaka 79
Perak Darul Redzuan 69
Kedah & Perlis 55
Pahang Darul Makmur 45
Sarawak 43
Trengganu Darul Iman 33
Table 2.04
Dialysis Treatment Rate by Gender,
per million male or female population 1996– 1999
Gender 1996 1997 1998 1999
Male 50 61 58 72
Female 43 48 52 54
Figure 2.04
Dialysis Treatment by Gender 1996 - 1999
Table 2.05
Dialysis Treatment Rate by Age Group,
2.2
PATIEN
T
DEMOGRAPHICS
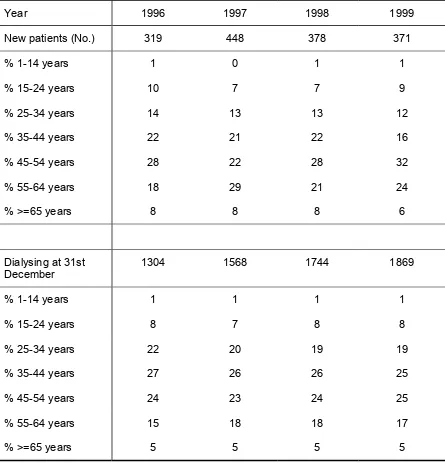
Table 2.06
Percentage Age Distribution of Dialysis Patients 1996 – 1999
Year 1996 1997 1998 1999
New dialysis
patients 907 1095 1157 1355
% 1-14 years 3 1 2 2
% 15-24 years 5 5 5 4
% 25-34 years 12 11 11 9
% 35-44 years 17 18 17 15
% 45-54 years 26 24 25 27
% 55-64 years 24 26 26 26
% > 65 years 13 15 14 16
Dialysing at 31st
December 2806 3557 4300 5138
% 1-14 years 2 2 2 2
% 15-24 years 6 5 5 5
% 25-34 years 18 17 16 15
% 35-44 years 24 23 22 21
% 45-54 years 24 24 24 25
% 55-64 years 18 20 21 21
Figure 2.06
Age Distribution of New Dialysis patients, 1996 – 1999
Pr
o
p
o
rt
io
n
o
f
p
a
ti
e
n
ts
Age group, years 0
10 20 30
1996 1997
1998 1999
Table 2.07
Gender distribution of Dialysis Patients 1996 – 1999
Year 1996 1997 1998 1999
New Dialysis patients 907 1095 1157 1355
% Male 54 57 54 58
% Female 46 43 46 42
Dialysing at 31st December
2806 3557 4300 5138
% Male 57 57 56 56
% Female 43 43 44 44
Figure 2.07
Gender Distribution of New Dialysis patients, 1996 – 1999
2.3
METHOD AND LOCATION
Table 2.08:
Method and Location of Dialysis
Year 1996 1997 1998 1999
Dialysing at 31st December
2806 3557 4300 5138
% Centre HD 72 76 80 82
% Home HD 5 3 2 2
% Office HD 7 6 5 5
% CAPD 16 14 12 11
Figure 2.08:
Method and Location of New Dialysis Patients
Pr
2.4 PRIMARY RENAL DISEASE
Table 2.09:
Primary Renal Disease, 1996 – 1999
Year 1996 1997 1998 1999
New Dialysis patients (No.) 907 1095 1157 1355
% Unknown cause 37 34 33 30
% Diabetic Nephropathy 29 36 40 40
% Glomerulonephritis 14 14 12 11
% Polycystic kidney 2 2 1 1
% Obstructive Uropathy 6 4 4 4
% Gouty Nephropathy 0 1 1 1
% Toxic Nephropathy 1 0 0 1
2.5.
DEATH ON DIALYSIS
Table 2.10:
Deaths on Dialysis 1992 – 1999
Year 1992 1993 1994 1995 1996 1997 1998 1999
No. of dialysis patients at risk
1053 1258 1528 1929 2485 3182 3929 4719
Dialysis deaths 93 102 142 171 217 291 359 455
Dialysis death rate % 9 8 9 9 9 9 9 10
No. of HD patients at risk
916 1081 1310 1643 2103 2715 3420 4172
HD deaths 70 79 100 113 157 220 285 357
HD death rate % 8 7 8 7 7 8 8 9
No. of CAPD patients at risk
Annual death rate on HD Annual death rate on CAPD
1992 1993 1994 1995 1996 1997 1998 1999
Table 2.11:
Causes of Death on Dialysis 1996 - 1999
Year 1996 1997 1998 1999
No. % No. % No. % No. %
Cardiovascular 44 26 53 24 73 26 108 32
Died at home 23 14 39 18 52 18 56 17
Sepsis 33 19 42 19 49 17 59 17
CAPD peritonitis 0 0 1 0 4 1 1 0
GIT bleed 1 1 2 1 2 1 6 2
Cancer 2 1 2 1 5 2 6 2
Liver disease 1 1 1 0 4 1 2 1
Others 52 24 64 22 79 22 96 21
Unknown 24 11 30 10 25 7 18 4
2.6. DIALYSIS CENTRE, CAPACITY AND TREATMENT PROVISION
(Up-To- Date Results From Year 2000 Centre Survey, as at 20
thDecember 2000)
Table 2.12: Number of dialysis centres, number of HD machines and treatment capacity, HD capacity to patient ratio
By State, as at 20
thDecember 2000
Figure 2.12(a): Distribution of dialysis centres by State, as at 20
thDecember 2000
Figure 2.12 c): Distribution of patients per million population by State, as at 20
thFigure 2.12 (d): HD capacity to patient ratio by State, as at 20
thDecember 2000
Table 2.13: Number of dialysis centres, dialysis patients and HD machines and
treatment capacity, by sector as at 20
thDecember 2000
Sector Centre
Figure 2.13 (a): Distribution of dialysis centres by Sector, as at 20
thDecember 2000
.
Figure 2.13 (b): Distribution of HD capacity by Sector, as at 20
thDecember 2000
Armed Forces MOH NGO Private University
Figure 2.13 (c): Distribution of dialysis patients by Sector, as at 20
thDecember 2000
.
Figure 2.13 (d): HD capacity : patient ratio by Sector, as at 20
thDecember 2000
. .
H
D
c
a
p
a
c
it
y
:
p
a
ti
e
n
t
ra
ti
o
1 1.5 2
HAEMODIALYSIS
IN
MALAYSIA
HAEMODIALYSIS IN GOVERNMENT CENTRES
HAEMODIALYSIS IN NON-GOVERNMENTAL
ORGANISATION (NGO) CENTRES
HAEMODIALYSIS IN GOVERNMENT CENTRES
Stock and Flow
Place of Haemodialysis and its Finance
Death on Haemodialysis and Transfer to PD
Government Haemodialysis Centres
Haemodialysis Patient Characteristics
Survival Analysis
Work related rehabilitation and quality of life
Haemodialysis practices
Dyslipidaemia in HD patients
Treatment of Renal Bone Disease
Management of Blood Pressure
Management of Anaemia
Nutritional status
3. HAEMODIALYSIS IN MALAYSIA
3.1
HAEMODIALYSIS IN GOVERNMENT CENTRES,
3.1.1 STOCK AND FLOW
Table 3.1.01
Stock and flow of Haemodialysis Patients,
Government Centres 1992 – 1999
Year 1992 1993 1994 1995 1996 1997 1998 1999
New patients 218 188 257 236 319 448 378 371
Figure 3.1.01: Stock and Flow HD patients, Government Centres 1992 - 1999
N
2000 New patients on HD at 31st December
3.1.2 PLACE OF HAEMODIALYSIS AND ITS FINANCE
Figure 3.1.02:
Place of HD, Government Centres 1996 - 1999
Table 3.1.03:
Finance for HD, Government Centres, 1996 – 1999
Figure 3.1.03:
Finance for new HD, Government Centres, 1996 – 1999
Pr
3.1.3 DEATH ON HAEMODIALYSIS AND TRANSFER TO PERITONEAL
DIALYSIS
Table 3.1.04: HD Death Rate and Transfer to PD, Government Centres 1992 - 1999
Year 1992 1993 1994 1995 1996 1997 1998 1999
No. at risk 822 860 969 1093 1225 1436 1656 1807
Deaths 70 74 79 85 115 135 158 205
Death rate % 9 9 8 8 9 9 10 11
Transfer to PD 4 6 7 12 7 9 6 10
Transfer to PD rate % 0 1 1 1 1 1 0 1
All Losses 74 80 86 97 122 144 164 215
All Losses rate % 9 9 9 9 10 10 10 12
Figure 3.1.04:
Death Rate on HD, Government Centres 1992 - 1999
D
e
a
th
r
a
te
%
Table 3.1.05:
Causes of Death on HD, Government Centres 1996 – 1999
Cause of death 1996 1997 1998 1999
No. % No. % No. % No. %
Cardiovascular 26 23 43 32 50 32 77 38
Died at home 19 17 20 15 34 22 43 21
Sepsis 21 18 31 23 34 22 35 17
GIT bleed 2 2 2 1 5 3 6 3
Cancer 2 2 4 3 4 3 2 1
Liver disease 1 1 3 2 1 1 2 1
Others 34 30 23 17 21 13 36 18
Unknown 10 9 9 7 9 6 4 2
3.1.4 GOVERNMENT HAEMODIALYSIS CENTRES
Table 3.1.07: Centre Distribution of HD patients, Government Centres 1999
No Centre No percent
0 No.on RRT at 31st December 1869 100
1 801 RSAT Kuching 8 0
2 807 RSAT Sg. Petani 6 0
3 810 RSAT Majidee 3 0
4 819 RSAT TUDM 7 0
5 94 HAT Terendak 28 1
6 95 HAT Kinrara 24 1
7 96 HAT Lumut 19 1
8 Alor Setar Hospital 75 4
9 Baling Hospital 4 0
10 Batu Pahat Hospital 27 1
11 Besut Hospital 10 1
12 Bintulu Hospital 10 1
13 Bukit Mertajam Hospital 36 2
14 Dutches of Kent Hospital 19 1
15 HTAA, Kuantan 41 2
16 Ipoh Hospital 109 6
17 Kajang Hospital 14 1
18 Kangar Hospital 38 2
19 Kemaman Hospital 7 0
20 Keningau Hospital 13 1
21 Kluang Hospital 7 0
22 Kota Bharu Hospital 47 3
23 Kuala Krai Hospital 6 0
No Centre No percent
37 Pusat Hemodialisis KEMENTAH 15 1