RENAL TRANSPLANTATION
Editor: Dr Goh Bak Leong
Expert Panel: Dr Goh Bak Leong (Chair) Dato’ Dr (Mr) Rohan Malek
Dr Wong Hin Seng Dr Fan Kin Sing Dr Rosnawati Yahya
Dr S Prasad Menon Dr Tan Si Yen
Contents
5.1 Stock and Flow of Renal Transplantation • Stock and Flow
• Transplant Rates
• Places of Transplant
5.2 Recipients’ Characteristics
• Demographics, Clinical and Serology Status
• Primary Causes of ESRF
5.3 Transplant Practices • Type of Transplant
• Immunosuppressive Therapy and Other Medications
5.4 Transplant Outcomes
• Post Transplantation Complications
• Death and Graft Loss
5.5 Patient and Graft Survival
5.6 Cardiovascular Risk in Renal Transplant Recipients
List of Tables
Table 5.1.1: Stock and Flow of Renal Transplantation, 2001-2010………..……4
Table 5.1.2: New transplant rate per million population (pmp), 2001-2010………..5
Table 5.1.3: Transplant prevalence rate per million population (pmp), 2001-2010…………..6
Table 5.1.4: Place of transplantation, 2001-2010………..7
Table 5.2.1: Renal Transplant Recipients’ Characteristics, 2001-2010……….8
Table 5.2.2: Primary causes of end stage renal failure, 2001-2010………...8
Table 5.3.1: Type of Renal Transplantation, 2001-2010………...9
Table 5.3.2: Biochemical data, 2006-2010………....9
Table 5.3.3: Medication data, 2006-2010………12
Table 5.4.1: Post-transplant complications, 2006-2010………...13
Table 5.4.2: Transplant Patients Death Rate and Graft Loss, 2001-2010………14
Table 5.4.3: Causes of Death in Transplant Recipients, 2001-2010………15
Table 5.4.4: Causes of Graft Failure, 2001-2010………...16
Table 5.5.1(a): Patient survival, 2001-2010………...17
Table 5.5.1(b): Risk factors for transplant patient survival 2001-2010………...18
Table 5.5.2(a): Graft survival, 2001-2010………..19
Table 5.5.2(b): Risk factors for transplant graft survival 2001-2010………..20
Table 5.5.3: Unadjusted Patient survival by type of transplant, 2001-2010………....21
Table 5.5.4: Graft survival by type of transplant, 2001-2010………..22
Table 5.5.5: Patient survival by year of transplant (Living related transplant, 2001-2010)…23 Table 5.5.6: Graft survival by year of transplant (Living related transplant, 2001-2010)…...24
Table 5.5.7: Patient survival by year of transplant (Commercial cadaver transplant, 2001-2010)……….25
Table 5.5.8: Graft survival by year of transplant (Commercial cadaver transplant, 2001-2010)………26
Table 5.6.1: Risk factors for IHD in renal transplant recipients at year 2006-2010…………27
Table 5.6.2(a): Systolic BP, 2006-2010………...29
Table 5.6.2(b): Diastolic BP, 2006-2010……….30
Table 5.6.3: CKD stages, 2006-2010………...30
Table 5.6.4: BMI, 2006-2010………...31
Table 5.6.5(a): LDL, 2006-2010………..32
Table 5.6.5(b): Total Cholesterol, 2006-2010………..32
Table 5.6.5(c): HDL, 2006-2010………..33
Table 5.6.6(a): Treatment for hypertension, 2006-2010……….34
Table 5.6.6(b): Distribution of Systolic BP without anti-hypertensives, 2006-2010………..34
Table 5.6.6(c): Distribution of Diastolic BP without anti-hypertensives, 2006-2010……….34
Table 5.6.6(d): Distribution of Systolic BP on anti-hypertensives, 2006-2010………..34
Table 5.6.6(e): Distribution of Diastolic BP on anti-hypertensives, 2006-2010……….34
Table 5.7.1: Cumulative distribution of QoL-Index score in relation to Dialysis Modality, Transplant recipient patients 2001-2010……….35
Table 5.7.2: Cumulative distribution of QoL-Index score in relation to Diabetes mellitus, Transplant recipient patients 2001-2010……….36
Table 5.7.3: Cumulative distribution of QoL-Index score in relation to Gender, Transplant recipient patients 2001-2010………...37
Table 5.7.4: Cumulative distribution of QoL-Index score in relation to Age, Transplant recipient patients 2001-2010………...38
3
List of Figures
Figure 5.1.1: Stock and Flow of Renal Transplantation, 2001-2010………...…..4
Figure 5.1.2: New transplant rate, 2001-2010………..…….5
Figure 5.1.3: Transplant prevalence rate, 2001-2010………..……..6
Figure 5.4.2(a): Transplant Recipient Death Rate, 2001-2010………..…..14
Figure 5.4.2(b): Transplant Recipient Graft Loss Rate, 2001-2010………..…..15
Figure 5.5.1(a): Patient survival, 2001-2010………..……17
Figure 5.5.1(b): Adjusted Transplant Patient Survival related to Year of Transplant, 2001-2010 (adjusted for age, gender, primary diagnosis, type of transplant, HBsAg and Anti-HCV status)………..……..18
Figure 5.5.2(a): Graft survival, 2001-2010………..……19
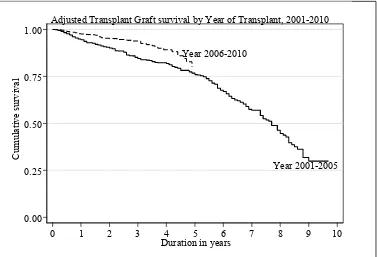
Figure 5.5.2(b): Adjusted Transplant Graft Survival related to Year of Transplant, 2001- 2010 (adjusted for age, gender, primary diagnosis, type of transplant, HBsAg and Anti-HCV status)………...…….20
Figure 5.5.3: Patient survival by type of transplant, 2001-2010………..……21
Figure 5.5.4: Graft survival by type of transplant, 2001-2010……….….…...22
Figure 5.5.5: Patient survival by year of transplant (Living related transplant, 2001-2010)...23
Figure 5.5.6: Graft survival by year of transplant (Living related transplant, 2001-2010)…..24
Figure 5.5.7: Patient survival by year of transplant (Commercial cadaver transplant, 2001-2010)………25
Figure 5.5.8: Graft survival by year of transplant (Commercial cadaver transplant, 2001-2010)…...……….26
Figure 5.6.1(a): Venn Diagram for Pre and Post Transplant Complications (in %) at year 2006………27
Figure 5.6.1(b): Venn Diagram for Pre and Post Transplant Complications (in %) at year 2007………27
Figure 5.6.1(c): Venn Diagram for Pre and Post Transplant Complications (in %) at year 2008………28
Figure 5.6.1(d): Venn Diagram for Pre and Post Transplant Complications (in %) at year 2009………28
Figure 5.6.1(e): Venn Diagram for Pre and Post Transplant Complications (in %) at year 2010………28
Figure 5.6.2(a): Systolic BP, 2006-2010………..29
Figure 5.6.2(b): Diastolic BP, 2006-2010………30
Figure 5.6.3: CKD stages, 2006-2010………..31
Figure 5.6.4: BMI, 2006-2010………..31
Figure 5.6.5(a): LDL, 2006-2010……….32
Figure 5.6.5(b): Total Cholesterol, 2006-2010………....33
Figure 5.6.5(c): HDL, 2006-2010………33
Figure 5.7.1: Cumulative distribution of QoL-Index score in relation to Dialysis Modality, Transplant recipient patients 2001-2010……….35
Figure 5.7.2: Cumulative distribution of QoL-Index score in relation to Diabetes mellitus, Transplant recipient patients 2001-2010……….36
Figure 5.7.3: Cumulative distribution of QoL-Index score in relation to Gender, Transplant recipient patients 2001-2010………...37
Figure 5.7.4: Cumulative distribution of QoL-Index score in relation to Age, Transplant recipient patients 2001-2010………...38
SECTION 5.1: STOCK AND FLOW
The number of new renal transplant patients shows an initial rise from 163 transplants per year in 2001 to a peak of 192 transplants in 2004. This is a rise of nearly 18% but the number declined subsequently to only 102 in 2010 (Table 5.1.1). This is due to reduction in the number of transplantations done overseas. As renal transplantation in the country is still dependant on the availability of commercial cadaveric transplantation done abroad, this drop is partially explained by the implementation of restriction of commercial organ transplantation by the Chinese Ministry of Health. The number of functioning renal transplants had increased from 1343 in 2001 to 1841 in 2010 (Table 5.1.1).
Table 5.1.1: Stock and Flow of Renal Transplantation, 2001-2010
Year 2001 2002 2003 2004 2005 2006 2007 2008 2009 2010 New transplant patients 163 172 160 192 170 149 111 128 135 102
Died 40 38 42 44 47 58 46 60 49 33 Graft failure 39 33 41 43 21 36 36 39 35 45 Lost to Follow up 2 4 4 6 6 4 16 14 16 4 Functioning graft at 31st December 1343 1440 1513 1612 1708 1759 1772 1787 1822 1841
Figure 5.1.1: Stock and Flow of Renal Transplantation, 2001-2010
0 200 400 600 800 1,000 1,200 1,400 1,600 1,800
N
o
. of pa
ti
ent
s
01 02 03 04 05 06 07 08 09 10 Year
5 The incidence of renal transplantation shows a modest decline of 6 to 7 per million population in the early 2000’s to 4-5 per million population in the last 3 years (Table 5.1.2) while transplant prevalence rate has grown slowly from 56 per million in 2001 to 65 per million population in 2005, an increase of 16% over the 2001 figures, and subsequently has remained static over the last five years. However, compared to growth in the prevalence rate of dialysis patients (which has increased by 325 from 326 per million population in 2001 to 812 in 2010) the transplant prevalence rate has not kept up. In fact, the incidence rate has reduced over the last ten years and the prevalence rate has remained static over the last 5 years (4 and 65 per million population respectively) (Table 5.1.2 and 5.1.3).
Table 5.1.2: New transplant rate per million population (pmp), 2001-2010
Year 2001 2002 2003 2004 2005 2006 2007 2008 2009 2010
New transplant patients 163 172 160 192 170 149 111 128 135 102
New transplant rate, pmp 7 7 6 7 6 6 4 5 5 4
Figure 5.1.2: New transplant rate, 2001-2010
0 1 2 3 4 5 6 7 8
N
ew
T
ra
n
sp
la
nt
Ra
te
, p
m
p
01 02 03 04 05 06 07 08 09 10 Year
Table 5.1.3: Transplant prevalence rate per million population (pmp), 2001-2010
Year 2001 2002 2003 2004 2005 2006 2007 2008 2009 2010
Functioning graft at 31st December 1343 1440 1513 1612 1708 1759 1772 1787 1822 1841
Transplant prevalence rate, pmp 56 58 60 62 65 66 65 65 65 65
Figure 5.1.3: Transplant prevalence rate, 2001-2010
0 5 10 15 20 25 30 35 40 45 50 55 60 65 70
T
ra
ns
pl
ant
P
re
v
al
enc
e Ra
te
, pm
p
01 02 03 04 05 06 07 08 09 10 Year
7 Transplantation within local centres has fluctuated in the last decade with 67 cases in 2001, gradually decreasing and was at its lowest in 2004 with only 40 cases and slowly increasing in the last 5 years. Unfortunately, the number of transplants has decreased again in 2010. This is disturbing data as it underscores our failure to improve the rate of transplantation within the country, which is mainly due to the lack of both living as well as cadaveric donors. Transplantation in China continues to drop from 139 cases (69%) at its peak in 2004 down to 35 cases (34%) in 2010 (Table 5.1.4).
Table 5.1.4: Place of transplantation, 2001-2010
2001 2002 2003 2004 2005
Year n % n % n % n % n % HKL 33 20 30 17 26 16 20 10 31 18 UMMC 23 14 15 9 6 4 7 4 8 5 Selayang Hospital 11 7 11 6 11 7 11 6 5 3 Other local 4 3 1 1 1 1 2 1 4 2 China 83 51 103 60 111 69 139 72 110 65 India 8 5 12 7 4 3 11 6 7 4 Other overseas 1 1 0 0 1 1 2 1 4 2 Unknown 0 0 0 0 0 0 0 0 1 1 Total 163 100 172 100 160 100 192 100 170 100
2006 2007 2008 2009 2010 TOTAL
SECTION 5.2: RECIPIENTS’ CHARACTERISTICS
In terms of renal transplant recipients’ characteristics, age at transplant has remained unchanged, with a mean between 37 to 42 years old. Between 58% and 70% of recipients were males over the last 10 years.
The proportion of diabetic patients undergoing renal transplantation increased during the first half of the decade from 14% in 2001 to 18% in 2005 (Table 5.2.1). However, there is a drop in the number of diabetic patients who underwent transplantation in 2007 and dropped further to 12% in 2010. This coincided with the drop in China transplants where the majority of diabetic patients underwent their transplantation.
Patients with hepatitis B have decreased from 5-8% earlier to 2% in the last 2 years. The proportion of patients with hepatitis C fluctuated in the last ten years. In terms of cause of end stage renal failure (Table 5.2.2), the major causes were glomerulonephritis followed by hypertension and diabetes. 34% of transplant recipients had end stage renal disease due to unknown causes, belying the fact that majority of these patients presented late.
Table 5.2.1: Renal Transplant Recipients’ Characteristics, 2001-2010
Year 2001 2002 2003 2004 2005 2006 2007 2008 2009 2010 New Transplant Patients 163 172 160 192 170 149 111 128 135 102 Age at transplant (years), Mean 41 40 41 42 38 37 37 37 38 40 Age at transplant (years), SD 13 12 13 13 14 15 16 15 14 14 % Male 63 58 66 63 69 66 64 59 64 63 % Diabetic (co-morbid/ primary renal disease) 18 15 23 21 21 20 14 19 17 12 % HBsAg positive 5 7 8 5 4 7 7 3 2 2 % Anti-HCV positive 15 9 10 8 2 8 9 3 7 2
Table 5.2.2: Primary causes of end stage renal failure, 2001-2010
2001 2002 2003 2004 2005
Year n % n % n % n % n % New transplant patients 163 100 172 100 160 100 192 100 170 100 Glomerulonephritis 44 27 54 31 55 34 64 33 47 28
2006 2007 2008 2009 2010 Year
9
SECTION 5.3: TRANSPLANT PRACTICES
The proportion of commercial transplantation has gradually reduced from 79% at its peak in 2004 to 34% in 2010. This is predominantly due to the marked decline in commercial cadaveric transplantation (76% in 2004 to 10% in 2010), which is in keeping with the implementation of restriction of cadaveric organ transplantation by the Chinese Ministry of Health. However, the number of commercial live donation has increased in 2010.
Live donor transplantation made up 29% of transplants (25 recipients) in 2010, which was down from 41 cases (32%) in 2009 and 40 cases (32%) in 2008. The number of live donors has remained low.
Local cadaveric donation made up 18% of transplants (24 recipients) in 2006 and showed a promising rise to 37 recipients in 2010. 2010 also marked the first time in 10 years where there were more local transplantations (66%) compared to commercial transplantations done overseas (34%).
Table 5.3.1: Type of Renal Transplantation, 2001-2010
2001 2002 2003 2004 2005
Year n % n % n % n % n % Commercial cadaver 83 51 103 60 112 70 145 76 107 64 Commercial live donor 7 4 11 6 3 2 6 3 9 5 Live donor (genetically related) 31 19 32 19 24 15 21 11 36 22 Live donor (emotionally related) 5 3 4 2 6 4 2 1 4 2 Cadaver 37 23 22 13 15 9 17 9 10 6 Total 163 100 172 100 160 100 191 100 166 100
2006 2007 2008 2009 2010
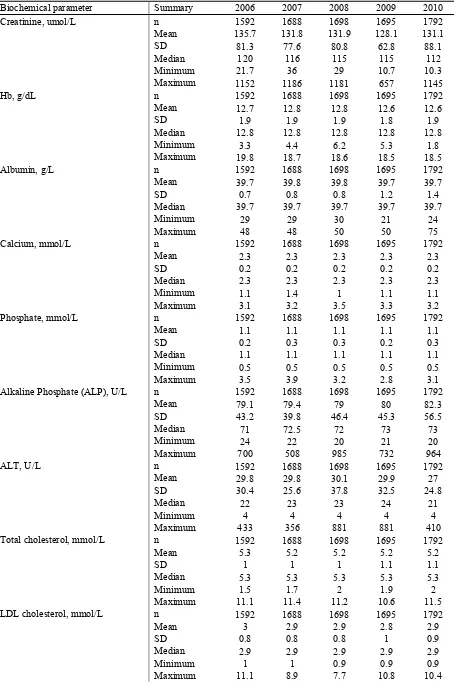
Table 5.3.2: Biochemical data, 2006-2010
Biochemical parameter Summary 2006 2007 2008 2009 2010 Creatinine, umol/L n 1592 1688 1698 1695 1792 Mean 135.7 131.8 131.9 128.1 131.1 Calcium, mmol/L n 1592 1688 1698 1695 1792 Mean 2.3 2.3 2.3 2.3 2.3 SD 0.2 0.2 0.2 0.2 0.2 Median 2.3 2.3 2.3 2.3 2.3 Minimum 1.1 1.4 1 1.1 1.1 Maximum 3.1 3.2 3.5 3.3 3.2 Phosphate, mmol/L n 1592 1688 1698 1695 1792 Mean 1.1 1.1 1.1 1.1 1.1 SD 0.2 0.3 0.3 0.2 0.3 Median 1.1 1.1 1.1 1.1 1.1 Minimum 0.5 0.5 0.5 0.5 0.5 Maximum 3.5 3.9 3.2 2.8 3.1 Alkaline Phosphate (ALP), U/L n 1592 1688 1698 1695 1792 Mean 79.1 79.4 79 80 82.3 Total cholesterol, mmol/L n 1592 1688 1698 1695 1792 Mean 5.3 5.2 5.2 5.2 5.2
SD 1 1 1 1.1 1.1
11 Biochemical parameter Summary 2006 2007 2008 2009 2010 HDL cholesterol, mmol/L n 1592 1688 1698 1695 1792 Mean 1.6 1.5 1.6 1.5 1.5 SD 0.5 0.4 0.5 0.5 0.5 Median 1.6 1.6 1.6 1.6 1.6 Minimum 0.4 0.4 0.5 0.4 0.4 Maximum 5.8 7.5 7.5 6.9 6.8 Systolic Blood Pressure, mmHg n 1592 1688 1698 1695 1792 Mean 130.7 131.6 129.4 130.1 129.8 SD 15.9 15.7 15.3 14.7 14.8 Median 130 130 130 130 130 Minimum 66 80 80 65 70 Maximum 210 210 245 210 192 Diastolic Blood Pressure, mmHg n 1592 1688 1698 1695 1792 Mean 78.9 78.8 77.5 78.2 77.5 SD 9.8 9.4 9.2 8.7 9.4 Median 80 80 78.8 79 78.8 Minimum 30 20 20 40 10 Maximum 120 116 133 120 124
In 2010, Cyclosporine based regimes remained the mainstay of immunosuppressive therapy with 61% of patients receiving it. This showed a gradual declining trend from 76% of all immunosuppression used since 2006, which coincided with increasing trend in Tacrolimus usage. Tacrolimus based regimes has increased from 17% in 2006 to 30% in 2010. There has been continuous increase in the use of Mycophenolate Mofetil as the second immunosuppressive agent in 59% of patients in 2010 compared to 48% of patients in 2006. During the same period, the use of Azathioprine declined from 34% in 2006 to 27% in 2010. Monotherapy of immunosuppresion is mostly not noted except in a small number of patients. Sirolimus was used in 1% of all transplant recipients in 2010.
Table 5.3.3: Medication data, 2006-2010
Single drug treatment
2006 2007 2008 2009 2010
Medication data
n % n % n % n % n % All 1482 100 1666 100 1429 100 1747 100 1432 100
(i) Immunosuppressive drug(s) treatment
Prednisolone 8 1 9 1 6 0 6 0 11 1 Azathioprine 0 0 0 0 0 0 1 0 0 0 Cyclosporin A 5 0 8 0 2 0 15 1 5 0 Tacrolimus (FK506) 0 0 4 0 3 0 14 1 2 0 Mycophenolate Mofetil (MMF) 0 0 1 0 2 0 0 0 1 0 Rapamycin 0 0 0 0 1 0 0 0 0 0 Others 0 0 0 0 0 0 1 0 0 0
(ii) Non-Immunosuppressive drug(s) treatment
Beta blocker 77 5 90 5 88 6 118 7 130 9 Calcium channel blocker 199 13 184 11 138 10 161 9 185 13 ACE inhibitor 39 3 38 2 29 2 41 2 35 2 AIIRB 27 2 19 1 17 1 21 1 31 2
Anti-lipid 156 11 95 6 89 6 117 7 109 8 Other anti-hypertensive 11 1 6 0 25 2 26 1 21 1
Combined drug treatment
2006 2007 2008 2009 2010
Medication data
n % n % n % n % n % All 1482 100 1666 100 1429 100 1747 100 1432 100
i) Immunosuppressive drug(s) treatment
Prednisolone 1444 97 1612 97 1385 97 1645 94 1356 95 Azathioprine 497 34 479 29 382 27 385 22 388 27 Cyclosporin A 1119 76 1191 71 983 69 1122 64 873 61 Tacrolimus (FK506) 254 17 349 21 345 24 475 27 434 30 Mycophenolate Mofetil (MMF) 708 48 908 55 776 54 1048 60 852 59 Rapamycin 7 0 33 2 30 2 32 2 20 1 Others 18 1 4 0 1 0 26 1 41 3
(ii) Non-Immunosuppressive drug(s) treatment
Beta blocker 597 40 735 44 615 43 681 39 540 38
Calcium channel blocker 787 53 905 54 687 48 736 42 573 40
ACE inhibitor 292 20 384 23 287 20 311 18 215 15
AIIRB 141 10 211 13 141 10 146 8 153 11
Anti-lipid 679 46 732 44 627 44 710 41 513 36
13
SECTION 5.4: TRANSPLANT OUTCOMES
5.4.1: Post-transplant complications
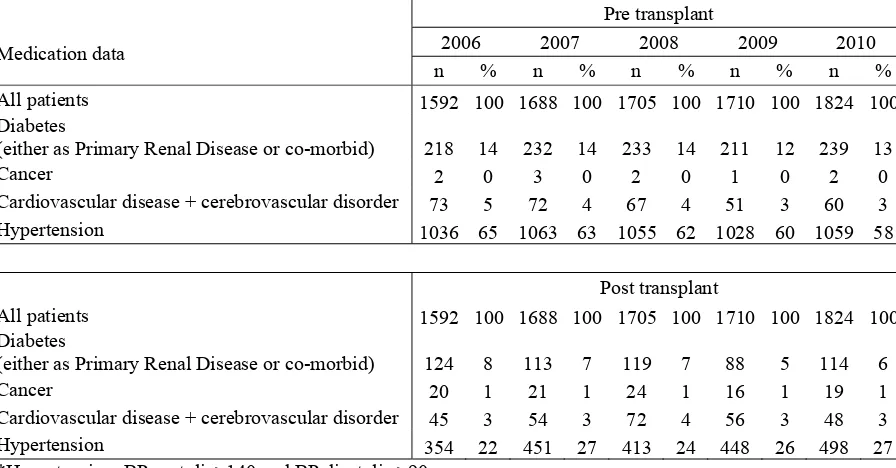
In the year 2010, 58% of patients were hypertensive prior to transplantation whereas 27% developed hypertension post transplantation. Thirteen percent of patients had diabetes mellitus prior to transplant whereas only 6% of patients developed post transplant diabetes mellitus. These trends have been quite the same since 2006. In terms of cardiovascular and cerebrovascular disease 3% had either or both prior to transplant and another 3% developed these post transplantation.
Table 5.4.1: Post-transplant complications, 2006-2010
Pre transplant
2006 2007 2008 2009 2010
Medication data
n % n % n % n % n % All patients 1592 100 1688 100 1705 100 1710 100 1824 100 Diabetes
(either as Primary Renal Disease or co-morbid) 218 14 232 14 233 14 211 12 239 13 Cancer 2 0 3 0 2 0 1 0 2 0 Cardiovascular disease + cerebrovascular disorder 73 5 72 4 67 4 51 3 60 3 Hypertension 1036 65 1063 63 1055 62 1028 60 1059 58
Post transplant
All patients 1592 100 1688 100 1705 100 1710 100 1824 100 Diabetes
(either as Primary Renal Disease or co-morbid) 124 8 113 7 119 7 88 5 114 6 Cancer 20 1 21 1 24 1 16 1 19 1 Cardiovascular disease + cerebrovascular disorder 45 3 54 3 72 4 56 3 48 3 Hypertension 354 22 451 27 413 24 448 26 498 27 *Hypertension: BP systolic>140 and BP diastolic >90
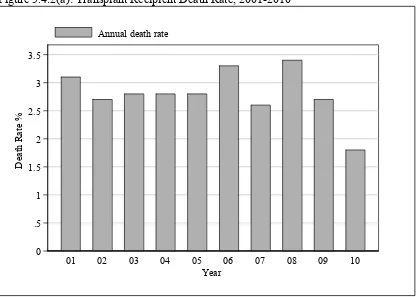
5.4.2: Deaths and Graft loss
In 2010, 33 transplant recipients died and 45 lost their grafts. The rates of transplant death and graft loss have remained static for the past 10 years (Table 5.4.2). The main known causes of death have been infection and cardiovascular disease with 37% and 18% respectively. Another 18% of patients died at home, which is usually presumed to be cardiovascular death as well.
Cancer death rates have been significantly high since 2001 contributing to 13% of all deaths in 2001, 18% in 2008 and 8% in 2010. Death due to liver disease has remained relatively static at 3% and 4% in 2009 and 2010 respectively.
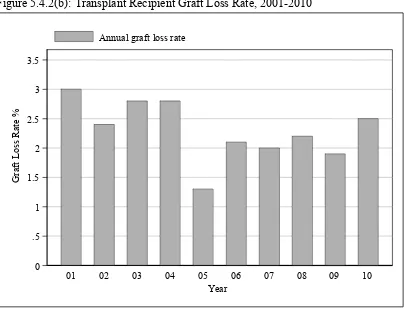
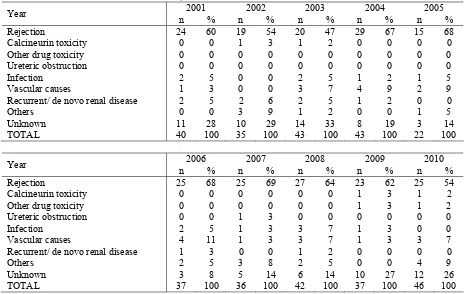
In terms of graft loss, majority were due to rejection.
Table 5.4.2: Transplant Patients Death Rate and Graft Loss, 2001-2010
Year 2001 2002 2003 2004 2005 2006 2007 2008 2009 2010 Number at risk 1302 1392 1477 1563 1660 1734 1766 1780 1805 1832 Transplant death 40 38 42 44 47 58 46 60 49 33 Transplant death rate % 3.1 2.7 2.8 2.8 2.8 3.3 2.6 3.4 2.7 1.8 Graft loss 39 33 41 43 21 36 36 39 35 45 Graft loss rate % 3 2.4 2.8 2.8 1.3 2.1 2 2.2 1.9 2.5 Acute rejection 0 0 4 19 14 19 14 23 31 70 Acute rejection rate % 0 0 0.3 1.2 0.8 1.1 0.8 1.3 1.7 3.8 All losses 79 71 83 87 68 94 82 99 84 78 All losses rate % 6.1 5.1 5.6 5.6 4.1 5.4 4.6 5.6 4.7 4.3 *Graft loss=graft failure
*All losses=death / graft loss (acute rejection happens concurrently with graft failure / death)
Figure 5.4.2(a): Transplant Recipient Death Rate, 2001-2010
0 .5 1 1.5 2 2.5 3 3.5
D
ea
th Ra
te
%
01 02 03 04 05 06 07 08 09 10 Year
15 Figure 5.4.2(b): Transplant Recipient Graft Loss Rate, 2001-2010
Table 5.4.3: Causes of Death in Transplant Recipients, 2001-2010
Table 5.4.4: Causes of Graft Failure, 2001-2010
2001 2002 2003 2004 2005 Year
n % n % n % n % n % Rejection 24 60 19 54 20 47 29 67 15 68 Calcineurin toxicity 0 0 1 3 1 2 0 0 0 0 Other drug toxicity 0 0 0 0 0 0 0 0 0 0 Ureteric obstruction 0 0 0 0 0 0 0 0 0 0 Infection 2 5 0 0 2 5 1 2 1 5 Vascular causes 1 3 0 0 3 7 4 9 2 9 Recurrent/ de novo renal disease 2 5 2 6 2 5 1 2 0 0 Others 0 0 3 9 1 2 0 0 1 5 Unknown 11 28 10 29 14 33 8 19 3 14 TOTAL 40 100 35 100 43 100 43 100 22 100
2006 2007 2008 2009 2010 Year
n % n % n % n % n % Rejection 25 68 25 69 27 64 23 62 25 54 Calcineurin toxicity 0 0 0 0 0 0 1 3 1 2 Other drug toxicity 0 0 0 0 0 0 1 3 1 2 Ureteric obstruction 0 0 1 3 0 0 0 0 0 0 Infection 2 5 1 3 3 7 1 3 0 0 Vascular causes 4 11 1 3 3 7 1 3 3 7 Recurrent/ de novo renal disease 1 3 0 0 1 2 0 0 0 0 Others 2 5 3 8 2 5 0 0 4 9
17
SECTION 5.5: PATIENT AND GRAFT SURVIVAL
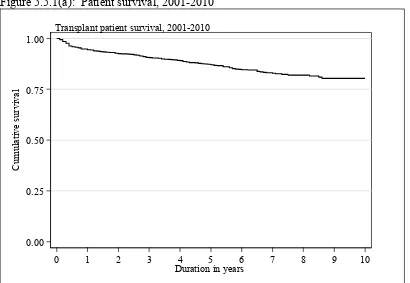
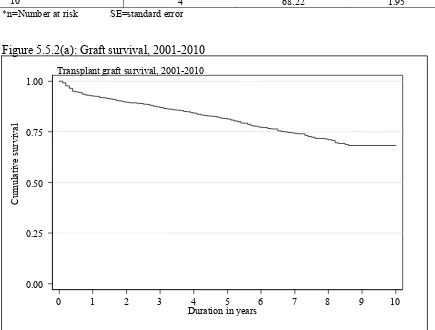
Overall patient survival rates from 2001 to 2010 have been 94%, 91%, 87% and 80% at year 1, 3, 5 and 10 respectively. Overall graft survival rate has been 93%, 87%, 81% and 68% at year 1, 3, 5 and 10 respectively.
Table 5.5.1(a): Patient survival, 2001-2010
Interval (years) n % Survival SE
0 1482 100
1 1263 94 1
2 1097 93 1
3 952 91 1
4 818 89 1
5 670 87 1
6 494 85 1
7 337 83 1
8 209 82 1
9 95 80 2
10 4 80 2
*n=Number at risk SE=standard error
Figure 5.5.1(a): Patient survival, 2001-2010
0.00 0.25 0.50 0.75 1.00
Cu
m
u
la
ti
v
e s
u
rv
iv
al
0 1 2 3 4 5 6 7 8 9 10 Duration in years
Table 5.5.1(b): Risk factors for transplant patient survival 2001-2010
Figure 5.5.1(b): Adjusted Transplant Patient Survival related to Year of Transplant, 2001-2010 (adjusted for age, gender, primary diagnosis, type of transplant, HBsAg and Anti-HCV status)
19 Table 5.5.2(a): Graft survival, 2001-2010
Interval (years) n % Survival SE
0 1482 100 -
1 1263 92.61 0.69
2 1097 89.55 0.83
3 952 87.07 0.93
4 818 84.21 1.04
5 670 81.31 1.15
6 494 77.12 1.32
7 337 74.28 1.46
8 209 71.11 1.69
9 95 68.22 1.95
10 4 68.22 1.95
*n=Number at risk SE=standard error
Figure 5.5.2(a): Graft survival, 2001-2010
0.00 0.25 0.50 0.75 1.00
Cu
m
u
la
ti
v
e s
u
rv
iv
al
0 1 2 3 4 5 6 7 8 9 10 Duration in years
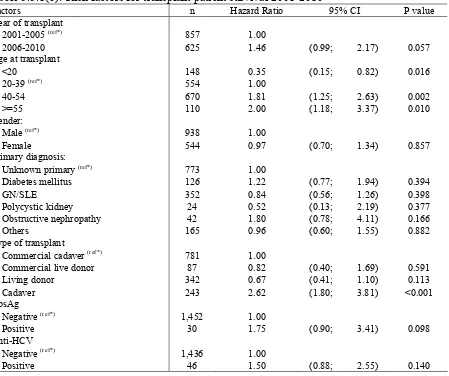
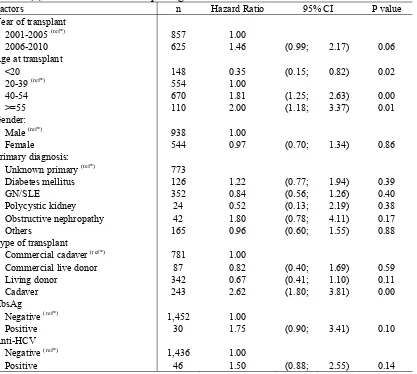
Table 5.5.2(b): Risk factors for transplant graft survival 2001-2010
Factors n Hazard Ratio 95% CI P value Year of transplant
• 2001-2005 (ref*) 857 1.00
• 2006-2010 625 1.46 (0.99; 2.17) 0.06 Age at transplant
• <20 148 0.35 (0.15; 0.82) 0.02
• 20-39 (ref*) 554 1.00
• 40-54 670 1.81 (1.25; 2.63) 0.00
• >=55 110 2.00 (1.18; 3.37) 0.01 Gender:
• Male (ref*) 938 1.00
• Female 544 0.97 (0.70; 1.34) 0.86 Primary diagnosis:
• Unknown primary (ref*) 773
• Diabetes mellitus 126 1.22 (0.77; 1.94) 0.39
• GN/SLE 352 0.84 (0.56; 1.26) 0.40
• Polycystic kidney 24 0.52 (0.13; 2.19) 0.38
• Obstructive nephropathy 42 1.80 (0.78; 4.11) 0.17
• Others 165 0.96 (0.60; 1.55) 0.88 Type of transplant
• Commercial cadaver (ref*) 781 1.00
• Commercial live donor 87 0.82 (0.40; 1.69) 0.59
• Living donor 342 0.67 (0.41; 1.10) 0.11
• Cadaver 243 2.62 (1.80; 3.81) 0.00 HbsAg
• Negative (ref*) 1,452 1.00
• Positive 30 1.75 (0.90; 3.41) 0.10 Anti-HCV
• Negative (ref*) 1,436 1.00
• Positive 46 1.50 (0.88; 2.55) 0.14
21 Outcomes of renal transplantation from the 4 donor groups are shown in Figures 13.5.3 and 13.5.4. In terms of patient survival, live donor grafts maintained good survival rates with 96%, 95%, 94% and 90% at years 1, 3, 5 and 10 respectively. In terms of graft survival, commercial cadaver grafts performed similarly well with a survival of 94%, 89%, 82% and 72% at year 1, 3, 5 and 10 compared to 95%, 92%, 90% and 72% for the same intervals for live donor grafts.
Table 5.5.3: Unadjusted Patient survival by type of transplant, 2001-2010 Type of
Transplant
Commercial Cadaver
Commercial
Live Donor Live Donor Cadaver
Interval (years) n % *n=Number at risk SE=standard error
Figure 5.5.3: Patient survival by type of transplant, 2001-2010 Year 2006-2010
Commercial cadaver
Commercial live donor Live donor
Cadaver
0.00 0.25 0.50 0.75 1.00
Cu
m
u
la
ti
v
e s
u
rv
iv
al
0 1 2 3 4 5 6 7 8 9 10
Duration in years
23 Table 5.5.4: Graft survival by type of transplant, 2001-2010
Type of Transplant
Commercial Cadaver
Commercial
Live Donor Live Donor Cadaver
Interval (years) n % *n=Number at risk SE=standard error
Figure 5.5.4: Graft survival by type of transplant, 2001-2010
Commercial cadaver
Patient and graft survival for living related transplants were compared between two cohorts. The patient survival for 2001-2005 cohort and the 2006-2010 cohort were comparable (Figures 5.5.5).
However, graft survival for living related transplants (Figure 5.5.6) was better in patients in the 2006-2010 cohort even from the outset probably due to increased usage of newer immunosuppressive agents.
Table 5.5.5: Patient survival by year of transplant (Living related transplant, 2001-2010) Year of Transplant 2001-2005 2006-2010
Interval (years) n % Survival SE n % Survival SE 0 144 100 - 123 100 -
1 136 95 2 102 97 1 2 131 94 2 73 96 2 3 129 94 2 45 96 2 4 127 93 2 26 94 3 5 124 93 2 2 94 3 6 82 91 2 - - - 7 64 91 2 - - - 8 45 91 2 - - - 9 21 91 2 - - - 10 1 91 2 - - - *n=Number at risk SE=standard error
Figure 5.5.5: Patient survival by year of transplant (Living related transplant, 2001-2010)
Year 2006-2010
Year 2001-2005
0.00 0.25 0.50 0.75 1.00
Cu
m
u
la
ti
v
e s
u
rvi
va
l
0 1 2 3 4 5 6 7 8 9 10 Duration in years
25 Table 5.5.6: Graft survival by year of transplant (Living related transplant, 2001-2010)
Year of Transplant 2001-2005 2006-2010
Interval (years) n % Survival SE n % Survival SE 0 144 100 - 123 100 - 1 136 94 2 102 97 2 2 131 92 2 73 96 2 3 129 91 2 45 96 2 4 127 89 3 26 93 3
5 124 88 3 - - -
6 82 82 3 - - -
7 64 79 4 - - -
8 45 78 4 - - -
9 21 72 5 - - -
10 1 72 5 - - -
*n=Number at risk SE=standard error
Figure 5.5.6: Graft survival by year of transplant (Living related transplant, 2001-2010)
Year 2006-2010
Year 2001-2005
0.00 0.25 0.50 0.75 1.00
Cu
m
u
la
ti
v
e s
u
rv
iv
al
0 1 2 3 4 5 6 7 8 9 10 Duration in years
Patient and graft survival for commercial transplants were comparable between the 2001-2005 cohort and the 2006-2010 cohort (Figures 5.5.7). This result was also comparable to the living related renal transplant done in the country.
Table 5.5.7: Patient survival by year of transplant (Commercial cadaver transplant, 2001-2010)
Year of Transplant 2001-2005 2006-2010
Interval (years) n % Survival SE n % Survival SE
0 550 100 - 231 100 - 1 512 95 1 212 96 1
2 491 93 1 176 95 1
3 476 90 1 116 93 2
4 455 89 1 73 91 2
5 434 86 2 2 90 3
6 334 84 2 - -
-7 210 81 2 - -
-8 122 81 2 - -
-9 51 80 2 - -
-10 1 80 2 - -
-*n=Number at risk SE=standard error
Figure 5.5.7: Patient survival by year of transplant (Commercial cadaver transplant, 2001-2010)
Year 2006-2010
Year 2001-2005
0.00 0.25 0.50 0.75 1.00
Cu
m
u
la
ti
v
e s
u
rv
iv
al
0 1 2 3 4 5 6 7 8 9 10 Duration in years
27 Table 5.5.8: Graft survival by year of transplant (Commercial cadaver transplant, 2001-2010) Year of Transplant 2001-2005 2006-2010
Interval (years) n % Survival SE n % Survival SE
0 550 100 - 231 100 -
1 512 94 1 212 95 1
2 491 90 1 176 93 2
3 476 88 1 116 90 2
4 455 85 2 73 88 3
5 434 81 2 2 86 3
6 334 78 2 - - -
7 210 75 2 - - -
8 122 72 2 - - -
9 51 71 2 - - -
10 1 71 2 - - -
*n=Number at risk SE=standard error
Figure 5.5.8: Graft survival by year of transplant (Commercial cadaver transplant, 2001-2010)
Year 2006-2010
Year 2001-2005
0.00 0.25 0.50 0.75 1.00
Cu
m
u
la
ti
v
e s
u
rv
iv
al
0 1 2 3 4 5 6 7 8 9 10 Duration in years
SECTION 5.6: CARDIOVASCULAR RISK IN RENAL TRANSPLANT RECIPIENTS
5.6.1: Risk Factors for Ischaemic Heart Disease
In 2010, 86.8% of patients were hypertensive, 21.2% were diabetic and 48.3% had renal insufficiency fulfilling CKD III and above. Forty-three percent of patients had 2 cardiovascular risk factors while 6.5% had all 3 major risk factors.
Table 5.6.1: Risk factors for IHD in renal transplant recipients at year 2006-2010
2006 2007 2008 2009 2010 **Hypertension: BP systolic > 140 and BP diastolic > 90
OR have either Beta blocker / Calcium channel blocker / ACE inhibitor / AIIRB / Other anti-hypertensive drugs GFR (mL/min/1.73m2) = 1.2*(140-age(year))*weight(kg) / creatinine (µmol/L) if male
GFR (mL/min/1.73m2) = 0.85*(1.2*(140-age(year))*weight(kg) / creatinine (µmol/L) if female CKD stage III-GFR, 30-60
CKD stage IV-GFR, 15-30 CKD stage V-GFR, <15
Figure 5.6.1(a): Venn Diagram for Pre and Post Transplant Complications (in %) at year 2006
29 Figure 5.6.1(c): Venn Diagram for Pre and
Post Transplant Complications (in %) at year 2008
Figure 5.6.1(d): Venn Diagram for Pre and Post Transplant Complications (in %) at year 2009
Figure 5.6.1(e): Venn Diagram for Pre and Post Transplant Complications (in %) at year 2010
CKD
DM HPT
9.9
2.0 38.3
1.3 30.6
11.4 6.5 CKD
DM HPT
7.4
1.1 41.7
1.4 28.8
12.8 6.9
CKD
DM HPT
9.9
1.8 41.1
1.1 30.2
5.6.2: Blood Pressure Classification According to JNC VI Criteria, 2006-2009
In 2010, 18% of renal transplant recipients had stage I hypertension whereas 5% had stage II hypertension and 0.6% had stage III hypertension despite being on treatment (Table 5.6.2 (a)). In terms of diastolic hypertension 11% had stage I hypertension, 1.1% of patients had stage II diastolic hypertension and 0.22% of patients had stage III diastolic hypertension despite being on treatment (Table 5.6.2 (b)).
Table 5.6.2(a): Systolic BP, 2006-2010
Systolic BP 2006 2007 2008 2009 2010 (mmHg) n % n % n % n % n % <120 249 15.64 240 14.22 289 17.02 269 15.87 331 18.47 120-129 395 24.81 392 23.22 377 22.20 376 22.18 390 21.76 130-139 483 30.34 531 31.46 612 36.04 638 37.64 661 36.89 140-159 353 22.17 409 24.23 335 19.73 340 20.06 314 17.52 160-179 93 5.84 99 5.86 75 4.42 62 3.66 86 4.80 ≥180 19 1.19 17 1.01 10 0.59 10 0.59 10 0.56
Figure 5.6.2(a): Systolic BP, 2006-2010
0 20 40 60 80 100
P
erc
en
t
2006 2007 2008 2009 2010 Year
Systolic BP <120 Systolic BP 120-129
Systolic BP 130-139 Systolic BP 140-159
31 Table 5.6.2(b): Diastolic BP, 2006-2010
Diastolic BP 2006 2007 2008 2009 2010
(mmHg) n % n % n % n % n % <80 624 39.20 699 41.41 898 52.89 856 50.50 932 52.01 80-84 586 36.81 610 36.14 525 30.92 528 31.15 533 29.74 85-89 73 4.59 74 4.38 50 2.94 84 4.96 108 6.03 90-99 244 15.33 261 15.46 198 11.66 195 11.50 196 10.94 100-109 61 3.83 39 2.31 22 1.30 27 1.59 19 1.06 ≥110 4 0.25 5 0.30 5 0.29 5 0.29 4 0.22
Figure 5.6.2(b): Diastolic BP, 2006-2010
5.6.3: Level of Allograft Function
Table and Figure 13.6.3 shows the CKD Stage classification by year and in 2010, 41.9% of renal transplant recipients had CKD Stage III whilst another 7.1% had CKD Stage IV. CKD Stage V (impending renal replacement therapy) was found in 2.2% of renal transplant recipients.
Table 5.6.3: CKD stages, 2006-2010
Year 2006 2007 2008 2009 2010
n % n % n % n % n % Stage 1 116 7.33 180 10.78 164 9.80 165 9.92 231 13.08 Stage 2 535 33.80 592 35.45 628 37.51 604 36.30 630 35.67 Stage 3 803 50.73 762 45.63 738 44.09 771 46.33 740 41.90 Stage 4 107 6.76 113 6.77 118 7.05 106 6.37 126 7.13 Stage 5 22 1.39 23 1.38 26 1.55 18 1.08 39 2.21
0 20 40 60 80 100
P
erc
en
t
2006 2007 2008 2009 2010
Year
Diastolic BP <80 Diastolic BP <85
Diastolic BP 85-89 Diastolic BP 90-99
Figure 5.6.3: CKD stages, 2006-2010
5.6.4: Body Mass Index
In 2010, 55.1% of renal transplant recipients had BMIs of 25 or below. However 31.1% were overweight and another 14% were obese. There seems to be a slow but steady increase in numbers of obese patients over the last few years.
Table 5.6.4: BMI, 2006-2010
Year 2006 2007 2008 2009 2010
n % n % n % n % n % <20 246 15.45 259 15.34 257 15.14 253 14.93 273 15.23 20-25 647 40.64 660 39.10 725 42.70 723 42.65 715 39.90 25-30 496 31.16 531 31.46 501 29.51 499 29.44 558 31.14 > 30 203 12.75 238 14.10 215 12.66 220 12.98 246 13.73
Figure 5.6.4: BMI, 2006-2010
BMI <20
2006 2007 2008 2009 2010
BMI > 30
33
5.6.5: Lipid Profile
LDL cholesterol has been identified as the primary lipid target for prevention of coronary heart disease by NCEP with a log linear relationship between risk of CHD and level of LDL cholesterol. In terms of renal transplant recipients in 2010, 33.9% have LDL levels below 2.6 mol/l. This has been relatively the same since 2006. Whether or not this translates into less cardiovascular mortality in the transplant population is still questionable. Patients with serum LDL >3.4 also demonstrated downward trend over the last few years.
In terms of other cholesterol parameters for 2010, 44.5% had total cholesterol levels < 5.2 and 7.2% had HDL cholesterol levels <1.0.
Table 5.6.5(a): LDL, 2006-2010
Year 2006 2007 2008 2009 2010
n % n % n % n % n % < 2.6 492 30.90 528 31.28 586 34.51 648 38.23 608 33.93 2.6-3.4 738 46.36 779 46.15 779 45.88 715 42.18 854 47.66 ≥ 3.4 362 22.74 381 22.57 333 19.61 332 19.59 330 18.42
Figure 5.6.5(a): LDL, 2006-2010
Table 5.6.5(b): Total Cholesterol, 2006-2010
Year 2006 2007 2008 2009 2010
n % n % n % n % n % <4.1 160 10.05 210 12.44 208 12.25 233 13.75 259 14.45 4.1-5.1 490 30.78 539 31.93 529 31.15 507 29.91 539 30.08 5.1-6.2 700 43.97 721 42.71 728 42.87 721 42.54 783 43.69 6.2- 7.2 173 10.87 159 9.42 160 9.42 159 9.38 144 8.04 > 7.2 69 4.33 59 3.50 73 4.30 75 4.42 67 3.74
0 20 40 60 80 100
P
erc
en
t
2006 2007 2008 2009 2010 Year
Figure 5.6.5(b): Total Cholesterol, 2006-2010
Table 5.6.5(c): HDL, 2006-2010
Year 2006 2007 2008 2009 2010
n % n % n % n % n %
<1 104 6.53 108 6.40 114 6.71 153 9.03 129 7.20
1-1.3 302 18.97 350 20.73 382 22.50 421 24.84 402 22.43 >1.3 1186 74.50 1230 72.87 1202 70.79 1121 66.14 1261 70.37
Figure 5.6.5(c): HDL, 2006-2010
0 20 40 60 80 100
P
erc
en
t
2006 2007 2008 2009 2010 Year
HDL <1 HDL 1-1.3 HDL > 1.3
0 20 40 60 80 100
P
erc
en
t
2006 2007 2008 2009 2010 Year
Total Cholesterol <4.1 Total Cholesterol 4.1-5.1
Total Cholesterol 5.1-6.2 Total Cholesterol 6.2-7.2
35
5.6.6: Blood Pressure Control
In 2010, 82% percent of patients were on antihypertensives and the majority (34%) were on 1 antihypertensive drug, 27% on 2 antihypertensives and 15% on 3 antihypertensives. Six percent of patients still had systolic BP of > 160 mmHg and 13% had diastolic BP of > 90 mmHg despite being given antihypertensive(s), however, this is an improvement from previous years.
Table 5.6.6(a): Treatment for hypertension, 2006-2010 Year n % on
anti-Table 5.6.6(b): Distribution of Systolic BP without anti-hypertensives, 2006-2010
Year n Mean SD Median LQ UQ % Patients ≥ 160mmHg
Table 5.6.6(c): Distribution of Diastolic BP without anti-hypertensives, 2006-2010
Year n Mean SD Median LQ UQ % patients ≥ 90mmHg
Table 5.6.6(d): Distribution of Systolic BP on anti-hypertensives, 2006-2010
Year n Mean SD Median LQ UQ % Patients ≥ 160mmHg
Table 5.6.6(e): Distribution of Diastolic BP on anti-hypertensives, 2006-2010
SECTION 5.7: QOL INDEX SCORE IN RENAL TRANSPLANT RECIPIENTS
1249 patients who were transplanted between 2001 and 2010 were analysed for QoL index score. They reported median QoL index score of 10 (Table 5.7.1 and Figure 5.7.1). It was interesting to note that for those who underwent renal transplantation between this period, diabetics and non-diabetics had the same median QoL index score of 10 (Table 5.7.2 and Figure 5.7.2), and this is in contrast to HD and CAPD patients where diabetics reported lower QoL index score than non-diabetics. There was also no difference seen between gender (Table 5.7.3 and Figure 5.7.3) and age (Table 5.7.4 and Figure 5.7.4). It is worthwhile to note that those above 60 year-old also enjoyed the same QoL index score (10) as their younger counterpart (Table 5.7.4 and Figure 5.7.4). This trend of high QoL index score among renal transplant patients was maintained over the last 10 years (Table 5.7.5 and Figure 5.7.5). Table 5.7.1: Cumulative distribution of QoL-Index score in relation to Dialysis Modality, Transplant recipient patients 2001-2010
Dialysis modality QoL score Number of patients 1249 Centile
Figure 5.7.1: Cumulative distribution of QoL-Index score in relation to Dialysis Modality, Transplant recipient patients 2001-2010
0
37 Table 5.7.2: Cumulative distribution of QoL-Index score in relation to Diabetes mellitus, Transplant recipient patients 2001-2010
Diabetes mellitus No Yes Number of patients 1194 55
Centile
0 0 0
0.05 9 7
0.1 10 8
0.25 (LQ) 10 9 0.5 (median) 10 10 0.75 (UQ) 10 10
0.9 10 10
0.95 10 10
1 10 10
Figure 5.7.2: Cumulative distribution of QoL-Index score in relation to Diabetes mellitus, Transplant recipient patients 2001-2010
0 .2 .4 .6 .8 1
Cu
m
u
la
ti
v
e D
is
tri
b
u
ti
on
0 1 2 3 4 5 6 7 8 9 10 QL-Index Score
No Yes
Table 5.7.3: Cumulative distribution of QoL-Index score in relation to Gender, Transplant recipient patients 2001-2010
Gender Male Female
Number of patients 783 466
Centile
0 0 0
0.05 9 9
0.1 10 9
0.25 (LQ) 10 10 0.5 (median) 10 10 0.75 (UQ) 10 10
0.9 10 10
0.95 10 10
1 10 10
Figure 5.7.3: Cumulative distribution of QoL-Index score in relation to Gender, Transplant recipient patients2001-2010
0 .2 .4 .6 .8 1
Cu
m
u
la
ti
v
e D
is
tri
b
u
ti
on
0 1 2 3 4 5 6 7 8 9 10 QL-Index Score
Male Female
39 Table 5.7.4: Cumulative distribution of QoL-Index score in relation to Age, Transplant
recipient patients 2001-2010
Age group (years) <20 20-39 40-59 ≥60
Number of patients 132 480 549 88
Centile
0 0 0 0 0
0.05 10 9 9 7
0.1 10 10 9 8
0.25 (LQ) 10 10 10 9 0.5 (median) 10 10 10 10 0.75 (UQ) 10 10 10 10
0.9 10 10 10 10
0.95 10 10 10 10
1 10 10 10 10
Figure 5.7.4: Cumulative distribution of QoL-Index score in relation to Age, Transplant recipient patients 2001-2010
0 .2 .4 .6 .8 1
Cu
m
u
la
ti
v
e D
is
tri
b
u
ti
on
0 1 2 3 4 5 6 7 8 9 10 QL-Index Score
Age <20 Age 20-39 Age 40-59 Age ≥60
Table 5.7.5: Cumulative distribution of QoL-Index score in relation to Year of entry, Transplant recipient patients 2001-2010
Year of Entry 2001 2002 2003 2004 2005 2006 2007 2008 2009 2010 Number of patients 127 145 136 168 154 137 95 106 112 69
Centile
0 0 0 0 0 0 0 0 0 0 0 0.05 9 9 8 9 9 9 8 8 9 7 0.1 9 10 9 9 10 10 9 9 10 9 0.25 (LQ) 10 10 10 10 10 10 10 10 10 10 0.5 (median) 10 10 10 10 10 10 10 10 10 10 0.75 (UQ) 10 10 10 10 10 10 10 10 10 10 0.9 10 10 10 10 10 10 10 10 10 10 0.95 10 10 10 10 10 10 10 10 10 10 1 10 10 10 10 10 10 10 10 10 10
Figure 5.7.5: Cumulative distribution of QoL-Index score in relation to Year of entry, Transplant recipient patients 2001-2010
0 .2 .4 .6 .8 1
Cu
m
u
la
ti
v
e D
is
tri
b
u
ti
on
0 1 2 3 4 5 6 7 8 9 10 QL-Index Score
Year 2001 Year 2002 Year 2003 Year 2004 Year 2005 Year 2006 Year 2007 Year 2008 Year 2009 Year 2010