Eirikta Jeisen Lala
545THE INFLUENCE OF CONSUMER RETENTION AND ANALYSIS OF
SERVICE QUALITY TOWARDS ONLINE SHOPPING AT
ENTERKOMPUTER.COM
PENGARUH KESAN PELANGGAN DAN ANALISA KUALITAS PELAYANAN
TERHADAP PEMBELANJAAN ONLINE DI ENTERKOMPUTER.COM
Eirikta Jeisen
Lala , Prof. Dr. S.L.H.V. Joyce Lapian, SE,MEc
2,
1,2 Faculty of Economics and BusinessInternational Business Administration (IBA) Program Sam Ratulangi University, Manado 95115, Indonesia
Email: 1 [email protected] 2[email protected]
ABSTRACT
Online buying and selling has become an important part of many people's lives. Students and parents rely on the internet to acquire and sell textbooks at affordable prices, virtual stores allow people to shop from the comfort of their homes without the pressure of a salesperson, and online marketplaces provide a new and more convenient venue for the exchange of virtually all types of goods and services. Both businesses and customers have embraced online sales as a cheaper and more convenient way to shop, but just like anything associated with the internet, there are benefits and dangers associated with shopping online. In the other words, society need to learn more about the technology especially the internet and always be aware to surf it as well. So as the first step, people should afford electronic devices such as smartphone, laptop, or a personal computer in order to be able to do an online buying or selling activity. Therefore this Thesis has been made to analyze and give explanations about how well Consumer Retention and Service Quality influencing an Online shopping behavior towards one of the well-known and most trusted online webstore Enterkomputer.com that provides many electronic devices especially computer stuffs and peripherals that located at Mangga 2 Mall, second floor, C block No 101-106, Jakarta Pusat.
Keywords: online shopping/ purchasing, online shopping behavior, e-business, consumer retention, service quality
ABSTRAK:
Penjualan dan pembelian barang secara online sudah menjadi bagian hidup banyak orang. Pelajar dan orang tua mempercayai internet untuk mendapatkan dan menjual buku dengan harga yang terjangkau, toko di dunia maya telah menyediakan kenyamanan berbelanja dari rumah tanpa ada tekanan apapun, dan pasar online juga memberikan sesuatu yang baru dan mudah untuk berbelanja segala jenis produk yang ada. Perusahaan-perusahaan maupun para pembeli telah mengakui bahwa pembelanjaan online lebih mudah dan menguntungkan, namun tak lepas dari dunia internet, banyak sekali keuntungan sekaligus bahaya dalam melakukan pembelanjaan online. Dengan kata lain, masyarakat harus belajar lebih mengenai teknologi khususnya internet dan harus selalu berhati-hati. Sebagai langkah awal, masyrakat memerlukan alat elektronik seperti smartphone, laptop, atau komputer pribadi untuk melakukan segala jenis aktivitas jual beli online. Oleh karena itu dibuatlah thesis ini guna menganalisa dan memberikan penjelasan tentang bagaimana kesan pelanggan dan kualitas pelayanan yang mempengaruhi jalannya tingkah laku atau kebiasaan pembelanjaan online yang terjadi di salah satu toko online popular dan terpercaya yaitu Enterkomputer.com yang menyediakan alat-alat elektronik khususnya perangkat keras computer yang bertempat di Mangga 2 Mall, Lantai dua, blok C nomor 101-106, Jakarta Pusat
Eirikta Jeisen Lala
5461.
INTRODUCTION
Research Background
The Internet has played a significant role in our daily life, people can talk through the internet one to another where is actually on the other side of the Earth, can send email around the clock, can search information, can play game with others, and even can buy things online. Meanwhile, Internet shopping has been widely accepted as a way of purchasing products and services. It has become a more popular means in the Internet world.
Furthermore, online shopping is the process whereby consumers directly buy goods or services from a seller in real-time, without an intermediary service, over the Internet. It is a form of electronic commerce. An online shop, e-shop, e-store, Internet shop, webshop, webstore, online store, or virtual store evokes the physical analogy of buying products or services at a bricks-and-mortar retailer or in a shopping center. Moreover, the use of loyalty programs as a technique for companies to enlarge customer loyalty is extremely popular as it is believed that both consumers and companies can reap benefits from it. For many products, there has been the tendency to shift from mass marketing of a homogenous product to anonymous buyers towards customization of product to meet the needs of known individuals whose needs have become observable through some form of dialogue based relationship. Customers tend to keep using current service as the level of the customer satisfaction is high. In other word, the customer satisfaction is the first factor for the customer retention.
Generally speaking, the customer with higher satisfaction tends to use that service continuously. However, the necessity for the analysis on the other factors as other studies shows that the customer satisfaction is not always significant to explain the customer retention even it is an important factor having positive effect on the customer retention.
Customer retention is an effort carried out by companies to ensure that its customers do not switch over to competitors products and services. It is of paramount importance to retain highly profitable ones. A good loyal customer base that persists for a long time is one of the best advertisements for a business, creating an image of high quality. This helps in attracting other customers who value long term relationship and high quality products and services.
Thus, a Service Quality is an assessment of how well a delivered service conforms to the client's expectations. Service business operators often assess the service quality provided to their customers in order to improve their service, to quickly identify problems, and to better assess client satisfaction. Service Quality has 5 dimensions, they are tangibles, reliability, responsiveness, assurance, and empathy.
One of the best online shop in Indonesia is Enterkomputer. Enterkomputer is the Most trusted online shop in Indonesia that provides computer stuffs & peripherals, located at Mangga 2 Mall, second floor, C block No.101-106, Jakarta Pusat.
Eirikta Jeisen Lala
547 Research ObjectiveTo Examines the influence of both consumer retention and service quality towards online shopping that occurred at Enterkomputer webstore.
Theoretical Framework
TheoriesMarketing
Marketing is the action or business of promoting and selling products or services, including market research and advertising. According to Amstrong and Kotler (2008), it is important for firms to implement the right marketing strategies in order to succeed. Traditionally, firms have focused their marketing strategies around attracting new customer and increasing their market share. However, due to globalization, most industries and markets are becoming more and more competitive forcing significant changes in the way firms do business.
Consumer Behavior
Consumer behavior is the study of the processes involved when individuals or groups select, purchase, use or dispose of products, services, ideas or experiences to satisfy needs and desires (Solomon, 2006). In a further development of this issue, models of consumer behavior have been created. For example a model of rational, sociological, or frame model (Koudelka, 2006). Consumer decision making has long been of interest to researchers. Beginning about 300 years ago early economists, led by Nicholas Bernoulli, John von Neumann and Oskar Morgenstern, started to examine the basis of consumer decision making (Richarme 2007).
Online Purchasing
Online Purchasing/Shopping is a form of electronic commerce which allows consumers to directly buy goods or services from a seller over the Internet using a web browser. Online purchasing is reported to be strongly associated with the factors of personal characteristics, vendor/service/product characteristics, website quality, attitudes toward online shopping, intention to shop online, and decision making (Andrade, 2000; Bellman, 1999; Bhatnagar, 2000; Cho, 2001; Grandon and Ranganathan, 2001; Jarvenpaa, 2000; Lee, 2000; Sukpanich and Chen 1999).
Consumer Retention
Consumer Retention is the way in which organizations focus their efforts on existing customers in an effort to continue doing business with them (Mostert, 2009:120). Customer retention is an effort carried out by companies to ensure that its customers do not switch over to competitors products and services. It is of paramount importance to retain highly profitable ones. A good loyal customer base that persists for a long time is one of the best advertisements for a business, creating an image of high quality. This helps in attracting other customers who value long term relationship and high quality products and services.
Service Quality
Eirikta Jeisen Lala
548 client satisfaction. Service quality is widely recognised as a critical business requirement (Voss, 2004; Vilares & Coehlo, 2003; Van der Weile, 2002). It is ‘not just a corporate offering, but a competitive weapon’ (Rosen, 2003).2.
RESEARCH METHODOLOGY
Type of Research
This research is quantitative research and uses causal type of research where it is designed to determine whether one or more variables (e.g., a program or treatment variable) causes or affects one or more outcome variables.
Place and Time of Research
This study was conducted directly to 100 respondents, started from February to march 2015.
Population and Sample
The population in this research is the customer of Enterkomputer webstore in Manado. The sample of this research is the customer of Enterkomputer in Manado as many as 100 customers or respondents.
Data Collection Method
There are two types of data that are used to make an appropriate result, which is Primary and Secondary data. In this research the type of data that will be used are both of that have been mentioned before.
Primary Data
According to Driscoll (2011):
Primary data is particularly useful when you want to learn about a problem that does not have a wealth of published information. This may be because the problem is a recent event or it is something not commonly studied. Primary data is data originated by the researcher specifically to address the research problem.
Self-administered Survey.
The researcher also gets primary data from the result of questionnaires. Questionnaires are distributed to respondents so they can respond directly on the questionnaire. There were two sections in the questioner in the questioner that should be filled in by the respondents. The first section asked about respondent’s identities and the second section asked about things that related with the variables.
Secondary Data.
Eirikta Jeisen Lala
549 Operational Definition and Measurement of Research VariablesTable 3.1
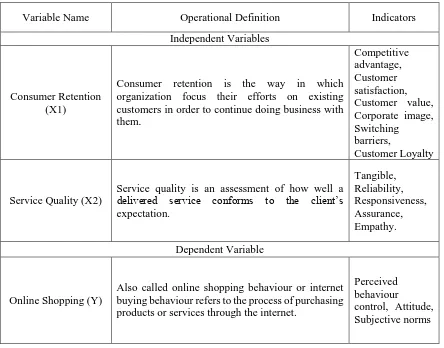
Variable Name Operational Definition Indicators
Independent Variables
Consumer Retention (X1)
Consumer retention is the way in which organization focus their efforts on existing customers in order to continue doing business with them.
Competitive advantage, Customer satisfaction, Customer value, Corporate image, Switching
barriers,
Customer Loyalty
Service Quality (X2)
Service quality is an assessment of how well a delivered service conforms to the client’s expectation.
Tangible, Reliability, Responsiveness, Assurance, Empathy.
Dependent Variable
Online Shopping (Y)
Also called online shopping behaviour or internet buying behaviour refers to the process of purchasing products or services through the internet.
Perceived behaviour
control, Attitude, Subjective norms
Data Analysis Method Validity and Reliability Test
In this research, the general explanation about variable sin this current research that will be analyzed, are stated as follows:
Validity and Reliability Test.
Scale validity assesses whether a scale measures what it is supposed to measure. Thus, validity is a measure of accuracy in measurement. Validity in general, involves
determining the suitability
of the questions (statement) chosen to represent the construct. One approach to assess
scale validity involves examining content validity (Hair 2010, 157). Scale reliability refers to the extent to which a scale can reproduce the same or similar measurement result in repeated trials. Thus, reliability is a measure of consistency in measurement. Hair (2010:156).
Eirikta Jeisen Lala
550 Alpha Cronbach. If Alpha is less than 0.6 then it is unreliable. The interpretation of Alpha Cronbach (Sekaran, 2003; 311) is as follows:1. < 0.6 indicates unsatisfactory internal consistency or consider that the data is unreliable. 2. 0.7 indicates that the data is acceptable.
3. 0.8 indicates good internal consistency or consider that the data resulted is reliable.
Multiple Regression Analysis Method.
Multiple regression is a statistical technique that simultaneously develops a mathematical relationship between two or more independent variables and an interval-scaled dependent variable. The formula of multiple regression models in this research is shown as follows:
= + + + �
Description:
: Beta
: Alfa or constant
: Error
Y : Online Shopping X1 : Consumer Retention X2 : Relationship Quality
Classical Assumption.
In this section will be explained about the tests that will be used in finding the result of this research.
Multicollinearity.
Multicollinearity shows the intercorrelation of independent variables. R2’s near 1 violate the assumption of no perfect collinearity, while high R2 increases the standard error of beta coefficient and makes assessment of the unique role of each independent difficult or impossible. To assess multicollinearity, researchers can use tolerance or VIF, which build in the regressing of each independent on all the others. Even when multicollinarity is present, note that estimates of the importance of other variables in the equation (variable which are not collinear with others) are not affected.
Tolerance is 1 – R2 for the regression of those independent variables on all the other independents, ignoring the dependent. There will be as many tolerance coefficients as there are independent. The higher the intercorrelation of the independents, the more the tolerance will approach to zero. As a rule of thumb, if tolerance is less than .20, a problem with multicollinearity is indicated. Variance-inflation factor or VIF which is simply the reciprocal of tolerance. Therefore, when VIF is high, it shows multicollinearity and instability of the b and beta coefficient. These two variables are provided in the SPSS output.
Heteroscedasticity.
Eirikta Jeisen Lala
5511. Sulaiman (2004:88) said that “Scatter plot is the residuals against an independent variable. A model can be concluded not apparent of heteroscedasticity if the scatter plot does not form any pattern.
2. Spearman correlation, highly recommended for a small samples model, is usually less than 30 samples. A model is said to be infected by heteroscedasticity if the spearman coefficient or correlation has significant value (Sig.<0.05) toward the residual.
Normality.
In multiple linear regression models, the residual is assumed to be normally distributed. A residual is the difference between the observed and model-predicted values of the dependent variable. The residual for a given product is the observed value of the error term for that product.
A histogram or P-P plot of the residuals can help researchers to check the assumption of normality of the error term. The requirements are as follows:
1. The shape of the histogram should approximately follow the shape of the normal curve 2. The P-P plotted residuals should follow the 45-degree line.
Autocorrelation.
Autocorrelation is the correlation between some observed data that is organized based on time series or data in a certain time or is cross-sectional. It is attempt to test is there any correlation between errors in t period and t-1 period in a linear regression model. Autocorrelation appears because if there continues observation in a time series, this problem emerges of the residual from one observation to another. Autocorrelation could be identified by computing the critical value of Durbin-Watson Statistic (d-test).
Test partially (t-test).
This test is intended to determinewhether eachindependent variablespartially influence dependent variableor not, by assuming a constant valueof independent variables.
Simultaneously (F-test).
This test is intended to determine whether the independent variables simultaneously influence dependent variable or not.
3.
RESULT AND DISCUSSION
Result Validity and Reliability
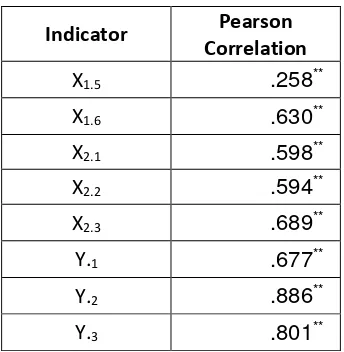
Validity Test Table 4.1
Validity Test Table
Indicator Pearson
Correlation
X1.1 .762**
X1.2 .836**
X1.3 .132
Eirikta Jeisen Lala
552Indicator Pearson
Correlation
X1.5 .258**
X1.6 .630**
X2.1 .598**
X2.2 .594**
X2.3 .689**
Y.1 .677**
Y.2 .886**
Y.3 .801**
Source: SPSS Data Analysis, 2015
From the table above shows the validity test of variable X1– Y and dependent variable are bigger than r value. The table shows the total number for X1 - Y are above 0.3, means that all the indicators are valid, except the indicator of X1.3 is below 0.3. Means that the indicator is not valid and should be excluded from the calculation.
[image:8.595.212.384.82.258.2]Reliability Test
Table 4.2 Reliability Test Table
Variable Cronbach's Alpha
X1 .657
X2 .620
Y .823
Source: SPSS Data Analysis, 2015
From the table above shows the Cronbach’s Alpha > 0.6, indicated that all research instrument indicator of variable are reliable.
Classic Assumption Heteroscedasticity Test.
Eirikta Jeisen Lala
553 Figure 4.4Source: SPSS Data Analysis, 2015
Based on the figure above it can be seen that there is no established pattern, in other words the graph describing the plot spread above and below the number 0 (zero) on the Y-axis. This proves that the independent variable X1 and X2 on Y are free of Heteroscedasticity.
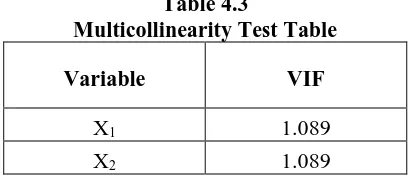
Multicollinearity Test.
The purpose was to test the assumption of multicollinearity in the regression model to test whether there is a correlation between the independent variables. A good regression model should be free from the problem of Multicollinearity and there is no correlation between the independent variables.
Table 4.3
Multicollinearity Test Table
Variable VIF
X1 1.089
X2 1.089
Source: SPSS Data Analysis, 2015
Table above shows the calculation of Multicollinearity. Moreover, it can be known through the VIF and tolerance, whereby if the value of VIF and tolerance to be around the number < 10 then the regression model above are free from multicollinearity. Based on the results in the table above can be seen by SPSS output does not occur because the symptoms of multicollinearity VIF value of X1 and X2 is below numbers < 10, this means that there is no connection between the independent variables. Thus, multicollinearity assumptions are met (free of multicollinearity).
Normality Test.
[image:9.595.195.402.462.551.2]Eirikta Jeisen Lala
554 Figure 4.5Source: SPSS Data Analysis, 2015
From the figure above it can be seen that the points spread and spread around the diagonal line in the direction diagonal lines. This proves that the regression model of the influence of X1 and X2 on Y in test normality assumption was met.
Coefficient Regression.
As has been pointed out in the previous section that the objective of this study to know the effect of X1 and X2 on Y and to test the truth of the hypothesis used quantitative analysis with linear regression methods.
In calculating the regression between independent variables on dependent variable, with the help of a computer program package Based on the statistical software SPSS Version 19.0, of the data processing on the attachment is as follows:
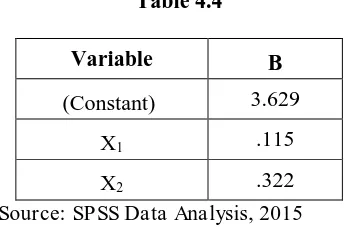
Unstandardized Coefficient Beta Table
Table 4.4
Variable B
(Constant) 3.629
X1 .115
X2 .322
Source: SPSS Data Analysis, 2015
From the analysis, obtained by linear regression equation as follows: Y = α + b1X1 + b2X2 + e
Y = 3.629 + 0,115 X1 + 0,322 X2 +e. From the multiple linear regression equation above, it can
inform the interpretation as follows:
- Constant value of 3.629 means that if the variables in this research of Variable X1 and X2 are equal to zero or constant than the Y will increase at 3.629 point.
[image:10.595.208.383.522.636.2]Eirikta Jeisen Lala
555 - Coefficient value of 0.322 means that if the variables in this research of X2 increased byone scale or one unit, it will improve and increase Y at 0.322.
Thus, if there is any change in factors measuring of X1 and X2 will change dependent variable Y.
Coefficient Correlation and Determination
The correlation coefficient is used to measure the The Influence of X1, X2, X3 and X4 on Y. The correlation coefficient values can be seen in the table below:
Coefficient Correlation (R) and (R2) table
Table 4.5
R R Square
.789a .623
Source: SPSS Data Analysis, 2015
Based on the analysis of correlation (R) is equal to 0.789 indicating that the Correlation of The Influence of X1 and X2 on Y has a strong relationship.
To determine the contribution The Influence of X1 and X2 on Y can be seen that the determinant of the coefficient (R2) in the table above. R2 value of 0.623 in this study may imply that the contribution of independent variable on dependent variable of 62.3 % while the remaining 37.7% is affected by other variables not examined in this study.
Hypothesis Test
Simultaneously Test
Simultaneous testing conducted to determine the The Influence of X
1and X
2on Y
hypothesis test is carried out simultaneously by using F numbers in the table below.
Testing is done by comparing the number of significant level of calculation results
with significance level 0.05 (5%) with the following criteria:
-
If F
count(sig)
>
0.05 then Ho is accepted and Ha rejected
-
If F
count(sig)
<
0,05 then Ho is rejected and Ha accepted
[image:11.595.94.501.580.728.2]-Simultaneously Test Table (F
–
test)
Table 4.6
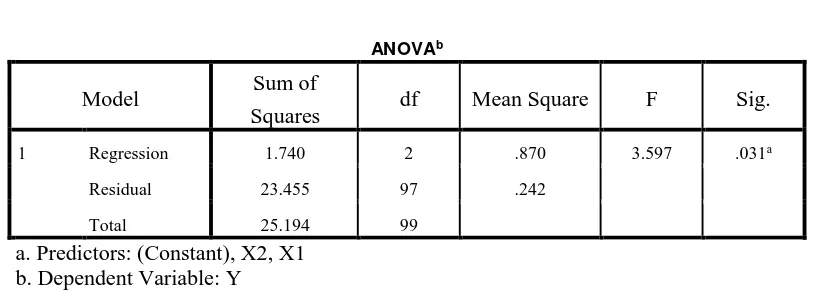
ANOVAb
Model Sum of
Squares df Mean Square F Sig.
1 Regression 1.740 2 .870 3.597 .031a
Residual 23.455 97 .242
Total 25.194 99
a. Predictors: (Constant), X2, X1 b. Dependent Variable: Y
Eirikta Jeisen Lala
556 Value of 3.597 of FCount significant 0.031a. Because the sig < 0.05 means the confidence of this prediction is above 95% and the probability of this prediction error is below 5% which is 0.031. Therefore H0 is rejected and accepting Ha. Thus, the formulation of the hypothesis that The Influence of X1 and X2 on Y Simultaneously, accepted.Partially Test.
Partial test is used to test the effect of each independent variable X1 and X2 in Partial influence on Y by performing comparisons between the tcount values with ttablevalue at α = 0.05 or compare the probability of the real level 95% of the partial coefficient (r) so that it can be seen the influence of the independent variables individually. Using the criteria of hypothesis testing by t test as follows:
- tcount < ttabel (0,05), then H0 is accepted and rejecting Ha. - tcount > ttabel (0,05), then H0 is rejected and accepting Ha. The data table below shows the t-test partially result:
Partial Test Analysis Table (t-test)
Table 4.7
Model t Sig.
X1 2.238 .040
X2 2.681 .009
Source: SPSS Data Analysis, 2015
Based on the calculations in the table above, the interpretation as follows:
- tcount for X1 2.238 bigger than the value of 1.984 ttable means X1 has significant influence partially on Y. The sig. value at 0.040 means that prediction of X1 influence on Y doing errors is more than 5% which is 4%, thus the confidence of this prediction is above 95%. Therefore, Ha accepted.
- tcount for X2 2.681 greater than the value of 1.984 ttable means X2 has significant influence partially on Y. The sig. value at 0.009 means that prediction of X2 influence on Y doing errors is 0.9%, thus the confidence of this prediction is above 95%. Therefore, Ha received.
Discussion
Eirikta Jeisen Lala
557 of tcount and fcount is bigger than its value on table. The coefficient correlation and coefficient determination also show the same result supported the significant influence.Consumer Retention has a significant influence on online shopping partially is because the switching barrier such as the continuous cost, the contractual cost, the interpersonal relationship and the attractiveness of the alternatives to maintain current growth and profitability in the mature market. Influencing the customer retention are reviewed in this paper, and other variables such as customer characteristics seem to have important influence on respondents of the customer retention in Enterkomputer.com website. Consumer retention is an effort carried out by Enterkomputer.com website to ensure that its customers do not switch over to competitors products and services. It is of paramount importance to retain highly profitable ones. A good loyal customer base that persists for a long time is one of the best advertisements for a business, creating an image of high quality. This helps in attracting other customers who value long term relationship and high quality products and services.
4.
CONCLUSION AND RECOMMENDATION
Conclusion
From the chapter 4 about the data analysis and discussion, this research concludes findings as follows:
1. Consumer Retention has significant influences on online shopping at Enterkomputer.com to make sure that the costumer will not change their perception and keep purchasing computer stuff at Enterkomputer.com rather than any other online shop.
2. Service quality also has significant influences on online shopping at Enterkomputer.com to give a good impression and satisfaction to the new customer as well as the old customer.
3. Both consumer retention and service quality have significant influence on online shopping at Enterkomputer.com because it has several factors that worked together in order to give customer the best product with affordable price all compared to the other online webstore all over Indonesia along with the best services as well.
Recommendation
1. Enterkomputer.com should pay attention on Consumer Retention and Service Quality since this several factors are the key and has a significant influence on Online Shopping.
Eirikta Jeisen Lala
558 REFERENCESArticle on Internet
[1] http://www.enterkomputer.com
[2]
www.firstpost.com/business/2015-the-era-of-the-internet-of-everything-begins-2188955.html
[3] www.the-future-of-commerce.com/2016/02/08/internet-of-things-personalization
[4] https://en.wikipedia.org/wiki/Information_Age
[5] http://www.investopedia.com/articles/pf/08/buy-sell-online.asp
[6] http://articles.economictimes.indiatimes.com/keyword/online-shopping
[7] http://papers.ssrn.com/sol3/papers.cfm?abstract_id=2345198
[8] https://researcharchive.lincoln.ac.nz/handle/10182/324
[9] https://www.researchgate.net/publication/264420045_An_empirical_assessment_of_the
_deterrents_of_online_shopping_acceptance_in_Nigeria
[10] https://ideas.repec.org/a/eee/telpol/v28y2004i2p145-159.html
[11] http://citeseerx.ist.psu.edu/viewdoc/summary?doi=10.1.1.12.3757
[12] http://journals.ama.org/doi/abs/10.1509/jmkg.67.4.30.18685?journalCode=jmkg
[13] http://www.ijsrp.org/research_paper_jun2012/rp40.html
[14] https://www.researchgate.net/publication/222701636_Predicting_customer_loyalty_usi
ng_the_internal_transactional_database
[15] https://en.wikipedia.org/wiki/Switching_barriers
[16] http://www.hbs.edu/faculty/Pages/profile.aspx?facId=6464
[17] http://job.sagepub.com/content/43/2/138.abstract
[18] https://en.wikipedia.org/wiki/Corporate_identity
[19] http://www.worldlibrary.org/articles/eng/Corporate_image
[20] https://en.wikipedia.org/wiki/Competitive_advantage
[21] https://www.researchgate.net/publication/235280324_Competitive_factors_and_their_r
elative_importance_in_the_US_electronics_and_computer_industries
[22] http://www.emeraldinsight.com/doi/abs/10.1108/01443570210412105
[23] https://scholar.google.com/scholar?q=The+Effect+of+Switching+Barriers+on+Custome
r+Retention+in+Korean+Mobile+Telecommunication+Services&hl=en&as_sdt=0&as_
vis=1&oi=scholart&sa=X&ved=0ahUKEwj1h-68vtLPAhWKNiYKHUgqDjsQgQMIHDAA
[24]
https://www.google.com/search?q=sampling+techniques&ie=utf-8&oe=utf-8&client=firefox-b