Gadjah Mada International Journal of Business January-April 2009, Vol. 11, No. 1, pp. 37–72
A LONGITUDINAL EXAMINATION
OF ENVIRONMENTAL REPORTING
PRACTICES IN MALAYSIA
Bakhtiar Alrazi
Maliah Sulaiman
Nik Nazli Nik Ahmad
A content analysis of the annual reports of 96 Malaysian companies in 1999, 2003 and 2006 finds that the number of compa-nies reporting on the environment increased from 47 percent in 1999 to 60 percent in 2003, and further increased to 67 percent in 2006. However, the extent of environmental reporting as measured by the number of environmental sentences and disclosure scores (using a self-constructed disclosure index) indicates a low quality of disclo-sure. Overall, the disclosure is ad-hoc and predisposed towards building a “good corporate citizen” image. The increasing trend, however, is consistent with the prediction of social issue life cycle theory.
Introduction
Research on environmental report-ing in Malaysia has examined the ex-tent of environmental information dis-closed in annual reports (ACCA 2002, 2004; Thompson and Zakaria 2004), the motivation for and determinants of environmental reporting (Ahmad et al. 2003; Buniamin and Jaffar 2004; Nik Ahmad and Sulaiman 2004; Yusoff et al. 2006; Smith et al. 2007; Sumiani et al. 2007; Buniamin et al. 2008), and the reliability of such information (Jaffar et al. 2002). However, these studies are predominantly cross-sec-tional in nature. Thus, their findings tend to be fragmented and incompa-rable.
Murthy and Abeysekera (2008) argue that an examination of disclo-sure practices using a longitudinal ap-proach would reveal possible varia-tions in disclosure practices not evi-dent in a cross-sectional study. We therefore undertake a longitudinal study. Longitudinal studies may also reveal the factors which influence changes in reporting practices over time (Nik Ahmad et al. 2003; Ahmad et al. 2003; Thompson and Zakaria 2004). Although there have been sev-eral longitudinal studies on environ-mental reporting trends in Malaysia (ACCA 2002, 2004) these studies are not based on any theoretical frame-work. The absence of theory is a fun-damental weakness and makes it diffi-cult to explain the findings. Conse-quently, this provides the major moti-vation for the present study.
There is also a paucity in litera-ture which examines the quality of environmental disclosure. Except for studies by Jaffar et al. (2002) and Smith et al. (2007), other studies focus on the quantity of reporting (Nik Ahmad and Sulaiman 2004; Thompson and Zakaria 2004) or whether the companies are reporting or not (Ahmad et al. 2003; Buniamin et al. 2008). Moreover, ACCA (2002, 2004) and Smith et al. (2007) only provide qualitative de-scription of the environmental report-ing. According to Jones and Alabaster (1999), this can be very subjective and they further propose the use of disclo-sure index which is more precise, ac-curate and effective.
The study has two objectives.
Firstly, this research investigates whether there is a significant change in the number of companies reporting environmental disclosures in the an-nual reports in 1999, 2003 and 2006.
amongst Malaysian companies to implement environmental reporting. Subsequently, any attempt to develop environmental reporting standards should consider the current level of reporting practices.
The paper is organized as follows. The second section, describes the de-velopment pertaining to environmen-tal legislation and reporting standards in Malaysia. The third section, reviews the literature. The fourth section, dis-cusses the theoretical framework and the development of hypotheses. The fith section, reports research method. The sixth section, provides the find-ings, and the final section, concludes.
Development of
Environmental Legislation
and Reporting Guidelines in
Malaysia
There are numerous signs of in-creased environmental awareness in Malaysia in recent years. First, envi-ronmental legislation is now more strin-gent, and stiffer penalties have been imposed for non-compliance. The En-vironmental Quality Act of 1974 (EQA 1974) (Act 127) was amended in 1998 and further in 2001 to include the pro-hibition of open burning (EQA 1974). The amendments also saw substantial
increases in penalties for various envi-ronmental offences. Additionally, be-tween 1999 and 2003 only, there were 10 subsidiary legislations introduced (EQA 1974). These developments at-test to the increasing governmental concern about environmental impacts of business operations in Malaysia.
Secondly, there are several au-thoritative guidelines that explicitly make reference to environmental re-porting. These include the publica-tions of FRS 101 and FRS 137 (for-merly known as MASB 1 and MASB 20) by the Malaysian Accounting Stan-dards Board (MASB) in 1999 and 2001, respectively, the Malaysian Code on Corporate Governance (MCCG) in 2000, and the ACCA’s Environmental Reporting Guidelines in 2003 and later the Sustainability Reporting Guide-lines in 2005.1 In the latest develop-ment, Bursa Malaysia (Malaysian Stock Exchange) has come up with its CSR Framework whereby effective year 2007, all public listed companies in Malaysia are required based on Para-graph 29, Appendix 9C, of the Listing Requirements to report their social con-tributions (including environmental issues) in the annual reports. How-ever, the framework only provides a basic guideline to the companies re-garding what areas of social activities
and/or performance that they need to inform the public.
Another development is the intro-duction of two environmental report-ing awards, the National Annual Cor-porate Report Awards (NACRA) that includes a category of environmental reporting in 2000, and the Malaysian Environmental Reporting Awards (MERA) by ACCA in 2002 [This was replaced by the Malaysian Social and Environmental Reporting Awards (MESRA) in 2004 and later, the Ma-laysian Sustainability Reporting Awards (MaSRA) in 2009].
Finally, environmental awareness campaigns have been launched by the DOE as well as non-governmental or-ganizations (NGOs) such as Sahabat Alam Malaysia (SAM), Malaysian Nature Society (MNS), Business Coun-cil for Sustainable Development Ma-laysia (BCSDM) and Environmental Protection Society of Malaysia (EPSM). This constitutes anecdotal evidence of the increased public and governmental concerns over the envi-ronment which may lead to enhanced environmental reporting practices by Malaysian companies.
Review of The Literature
Prior studies on corporate envi-ronmental reporting practices suggest that while there appears to be an in-creasing trend in the number of com-panies reporting environmental infor-mation, the overall level of reporting is still low (Niskala and Pretes 1995; KPMG 1999, 2002; Moneva and Llena
2000). Among corporate social disclo-sure themes, environmental (and en-ergy) disclosure ranks third behind human resources and product or com-munity information in both the num-ber of reporting companies and the amount of reported information (Gray et al. 1995a; Hackston and Milne 1996; Tsang 1998; Abu-Baker and Naser 2000; Imam 2000).
Second, environmental disclo-sures have been predominantly narra-tive in nature. Very few companies disclose quantitative environmental in-formation (Niskala and Pretes 1995; Moneva and Llena 2000; ACCA 2002).
Third, the evidence also suggests that companies are more predisposed towards disclosing good news infor-mation. Fourth, there is limited evi-dence of companies which engage in external verification of environmental reports (Niskala and Pretes 1995; KPMG 1999).
Finally, there appears to be no specific preferred location in the an-nual report for environmental report-ing. Perhaps, most companies tend to disclose information in voluntary sec-tions of the annual reports since these sections are normally not audited (Walden and Schwartz 1997).
Ahmad and Sulaiman 2004; Sumiani et al. 2007). Additionally, there is also evidence that firms’ environmental dis-closures increase with firm size, envi-ronmental performance (Jaffar et al. 2002), leverage, audit firm (Ahmad et al. 2003) and the ISO 14001 certifica-tion (Sumiani et al. 2007). Findings of Smith et al. (2007), on the other hand, suggest that poor financial performance is associated with increased environ-mental disclosure.
Finally, in the absence of any regu-latory requirements, companies tend to focus on the enhancement of their “corporate image” (ACCA 2004; Buniamin and Jaffar 2004), although there is also limited evidence of other motives such as the companies’ self-environmental concerns and opera-tional improvements (Yusoff et al. 2006).
However, most of these studies are cross-sectional. Even though the ACCA (2002, 2004) conducted a lon-gitudinal study covering the period between 1999 and 2003, it lacks a theoretical underpinning which is nec-essary to explain the reporting prac-tices. This study contributes to the literature using social issue life cycle theory as the framework to put the reporting trends in context. Besides, many prior content analysis studies on environmental reporting have used different checklist instruments to ex-amine environmental disclosure. This may lead to different or inconsistent results which would prevent any mean-ingful comparison. Accordingly, this study utilizes checklist instruments that
are well established in the environ-mental reporting literature. This will not only ensure consistency, but more importantly, it will allow for compari-sons with those of similar studies in other countries.
Another contribution of this study is the examination of both the quantity and the quality of environmental dis-closure. Except for Jaffar et al. (2002) and Smith et al. (2007), there has been no published work on the quality of disclosure in Malaysia. Jaffar et al. (2002) however merely look at the location and the degree of quantifica-tion (i.e., monetary, non-monetary, and general) of the environmental infor-mation. Meanwhile, Smith et al. (2007) do not provide any clear description on how they come up with the disclosure items. Besides, it is crucial that studies on environmental disclosure examine both quantity and quality of disclosure as findings from such studies will pro-vide valuable insights for regulatory bodies in setting guidelines or stan-dards to environmental reporting.
Theoretical Framework and
Hypotheses Development
Zyglidopoulos (2003: 71) defines is-sues as “a controversial inconsistency based on one or more expectational gaps of what is considered appropriate behavior within a particular society... with implications for corporate per-formance and behavior.”
Issue evolution may be examined from either macro or micro perspec-tive (Zyglidopoulos 2003). From a macro perspective, changes in societal expectation may indicate that an issue has evolved. One of the prominent models is the public policy perspec-tive, whereby an issue becomes politi-cized before it is made a regulation (Post 1978, as cited in Mahon and
Waddock 1992). The development in the environmental regulations and re-porting recommendations as described earlier is an example of the evolution of issue from the macro perspective.
On the other hand, a micro per-spective of issue evolution looks at the behavior of companies. Thus, changes in the environmental reporting prac-tices of companies over time may sig-nal ‘environment’ as an issue that re-quires managerial attention. Regard-less of the perspective –macro or mi-cro, most social issue theorists agree that an issue progresses from a period of insignificance to a period of in-creased public attention. Subsequently,
Table 1. Stages in Social Issue Life Cycle
Phases Characteristics
Phase 1: Policy z A given social or environmental issue first emerges as a top management concern
z There is no systematic analysis of problem, and the policy statements are followed by little or no organisational action
Phase 2: Learning z Addition to the corporate staff of a specialist (or specialists) who is given the responsibility of imple-menting the company’s social policy
z The specialist’s job is initially very poorly defined, with no clear definition of his or her authority or responsibilities
Phase 3: Commitment z Organisational responsiveness is integrated into on-going business decisions and becomes the responsi-bility of line managers
the public will demand necessary ac-tions from business organizaac-tions in-volved. The actions then gradually become the norms for the organiza-tions in dealing with such issues (Nasi et al. 1997; Zyglidopoulos 2003). This becomes the premise of social issue life cycle theory.
Social issue life cycle-theory pos-its that an issue evolves through three to four predictable stages (Mahon and Waddock 1992; Bigelow et al. 1993; Nasi et al. 1997; Zyglidopoulos 2003). However, an issue may not necessarily evolve according to the “normal” path (i.e., stage by stage) since issue evolu-tion may be affected by factors such as sudden intervention of government or other influential stakeholders or the emergence of other issues that require immediate attention and shift atten-tion away from the existing issue (Bigelow et al. 1993; Nasi et al. 1997). Table 1, suggested by Ackerman (1975) cited from Nasi et al. (1997), summa-rizes the stages in the social issue life cycle.
Several studies have utilized so-cial issue life cycle theory to explain the corporate social responsibility ini-tiatives and reporting. Nasi et al. (1997) examined the annual reports of two major Canadian and Finnish forestry companies over a 16-year period, i.e., 1976-1991. They find that social is-sues played a moderate role in the annual report disclosures of all four companies between 1976 and early 1980s. There was a significant reduc-tion in the attenreduc-tion paid to societal issues in the mid-1980s. Then,
coin-ciding with the general heightened awareness on environmental issues in the late 1980s, there was an increased emphasis on societal issues in the an-nual reports. This trend of increased disclosure on a range of social issues provides some evidence of the appli-cability of social issue life cycle theory. Eweje (2005, 2006a, 2006b) ex-amined inter alia the motives for cor-porate social responsibility initiatives undertaken by companies from the mul-tinational mining and oil industries operating in Nigeria and South Africa. These companies receive mounting pressure from the community due to significant impacts their operations have on the natural environment and the perception that they have not pro-vided enough social and economic in-frastructure/assistance to the commu-nity. The author finds the applicability of social issue life cycle theory in several instances. Firstly, the fatalities rate and injuries rate in the mining industry dropped from 1984 to 1998 by 23.2 percent and 38.05 percent, respectively (Eweje 2005).
Secondly, although in the early phase it seemed that only Shell (one of the oil companies) demonstrated its commitment towards environmental preservation (since 1958), by 1997, all other oil companies began to promote green initiatives and include environ-mental issues in their strategic plan-ning process (Eweje 2006a).
engage their stakeholders, and their commitments towards the environment are explicitly described in the mission statements, statements of business prin-ciples and the Chairman’s statements (Eweje 2006b).
Meanwhile, previous research finds that a firm’s voluntary environ-mental disclosure increases with envi-ronmental incidents or prosecutions (Patten 1992; Deegan and Rankin 1996; Walden and Schwartz 1997; Neu et al. 1998), substantial media expo-sure (Brown and Deegan 1998; Neu et al. 1998; Cormier and Magnan 2003), and the prominent role of the environ-mental lobbying groups (Deegan and Gordon 1996; Campbell 2004). Other studies suggest that heightened envi-ronmental awareness, as in the Malay-sian context described earlier, could also lead to changes in environmental reporting trends over time (Niskala and Pretes 1995; Moneva and Llena 2000).
Thus, if companies in Malaysia perceive the increasing public aware-ness on environmental issues as a po-tential threat, social issue life cycle theory asserts that there will be a change in the environmental reporting prac-tices of these companies. Previous stud-ies on Malaysia find that the number of reporting companies and the quantity of environmental disclosure increase over time (ACCA 2002, 2004; Haniffa and Cooke 2005). Although these stud-ies do not look at quality, studstud-ies in other countries document evidence of the increase in the quality of the re-ported information (Walden and
Schwartz 1997; Buhr and Freedman 2001; Hooks et al. 2004). Therefore, it is reasonable to develop hypotheses in a directional form. These hypotheses, stated in the alternate, are as follows:
HA1: There is a significant increase in the number of companies disclos-ing environmental information in 1999, 2003 and 2006.
HA2: There is a significant increase in the quantity of environmental in-formation disclosed in 1999, 2003 and 2006.
HA3: There is a significant increase in the quality of environmental in-formation in 1999, 2003 and 2006.
Sample Selection and
Research Methods
Sample Selection
This study is an extension of Alrazi (2005), who examined the environ-mental reporting practices between 1999 and 2003. He used the largest 150 companies (by market capitaliza-tion) listed on the Main Board as of 31 December 2003 as the sample for his study due to the following reasons.
Firstly, literature finds a significant association between size and corpo-rate disclosure (Neu et al. 1998; Will-iams 1999; Jaffar et al. 2002; Cormier and Magnan 2003, Ramasamy and Hung 2004).
(Hackston and Milne 1996). More-over, there is a possibility that these companies have more socially and en-vironmentally conscious shareholders (Hackston and Milne 1996). Addition-ally, these companies are believed to have more resources to embark on social and environmental initiatives (Cormier and Magnan 2003; Ramasamy and Hung 2004).
Forty companies were excluded due to new listing status (18 compa-nies), corporate restructuring (19), ceased operations (2) and unavailabil-ity of annual reports (1). These re-duced his final sample to only 110 companies. We further investigate whether these companies were still listed on Bursa Malaysia in year 2006.
We find that only 96 companies were still listed (seven companies were delisted and the remaining underwent other corporate restructurings) and this makes up our sample. We choose year 2006 due to two main reasons. Firstly, effective year 2007, all public listed companies are required to adopt the Bursa Malaysia CSR Framework, which requires the companies to dis-close their environmental performance information (see Second section).
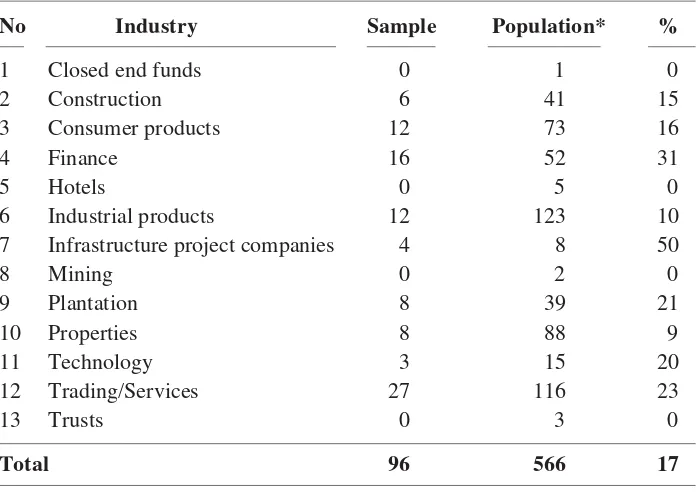
Secondly, this is the most recent data available when the research com-menced. Table 2 provides a descrip-tion of the sample.
Table 2 shows that four sectors: mining, closed end funds, hotels and trusts are not represented.
Neverthe-Table 2. Distribution of Companies According to Industrial Sector
No Industry Sample Population* %
1 Closed end funds 0 1 0
2 Construction 6 41 15
3 Consumer products 12 73 16
4 Finance 16 52 31
5 Hotels 0 5 0
6 Industrial products 12 123 10
7 Infrastructure project companies 4 8 50
8 Mining 0 2 0
9 Plantation 8 39 21
10 Properties 8 88 9
11 Technology 3 15 20
12 Trading/Services 27 116 23
13 Trusts 0 3 0
Total 96 566 17
less, this will not significantly affect the results since these sectors are among the least likely sectors to report environmental information (KPMG 1999, 2002; ACCA 2002, 2004; Ahmad et al. 2003) whereas for min-ing, there are only two companies in the industry.
Content Analysis –
Measurement of Dependent
Variables
Content analysis is a “research technique for making replicable and valid inferences from data to their con-text” (Krippendorf 1980: 21). Content analysis involves specialized proce-dures for processing scientific data (Krippendorf 1980; Weber 1990). The emphasis is on the definition, medium, measurement and construction of the categorization scheme (Gray et al. 1995b; Milne and Adler 1999).
Definition. For this study, envi-ronmental reporting refers to disclo-sure of the impact a company’s activi-ties have on physical or natural envi-ronment (Wilmshurst and Frost 2000). The checklist proposed by Hackston and Milne (1996), Williams (1999) and Deegan et al. (2002) are used in this study. Minor modifications are made. The final checklist provides an improved representation of environ-mental issues that a company may dis-close in its annual report (Appendix A).
Medium. This study only utilizes annual reports as the source of infor-mation due to several reasons. Using
annual reports would be consistent with previous studies (Hackston and Milne 1996; Nik Ahmad and Sulaiman 2004; De Villiers and Van Staden 2006).
Secondly, annual reports are a pri-mary information source of environ-mental performance for investors, creditors, employees, environmental groups and the government (Wiseman 1982; Tilt 1994).
Thirdly, compared to other me-dia, annual reports possess a high de-gree of credibility (Tilt 1994; Gray et al. 1995b; Neu et al. 1998; Unerman 2000).
Fourthly, annual reports are more accessible to researchers (Gray et al. 1995b; Unerman 2000; Wilmshurst and Frost 2000), and it would not be possible to identify all corporate com-munications on social matters over a long period of time (Gray et al. 1995b; Campbell 2004).
Finally, the limited use of stand-alone environmental reports justifies the use of annual reports in this study (ACCA 2002; Thompson and Zakaria 2004).
Data Measurement and Capture
Quantity. The quantity of disclo-sure signifies the importance of an issue (Krippendorf 1980). Previous studies have used words, sentences, proportion of a page, line count and frequency. Consistent with Alrazi (2005), this study uses the number of sentences to measure quantity for sev-eral reasons. Firstly, sentences can be used to depict meaning and thus are likely to provide more reliable mea-sures (Hackston and Milne 1996). The use of sentences also reduces the de-gree of subjectivity in interpreting the environmental information disclosed (Milne and Adler 1999).
Secondly, Hackston and Milne (1996) find high correlations amongst sentences, words and pages. Hence, the results should not be greatly influ-enced by the choice of sentences, in-stead of words, or proportion of a page.
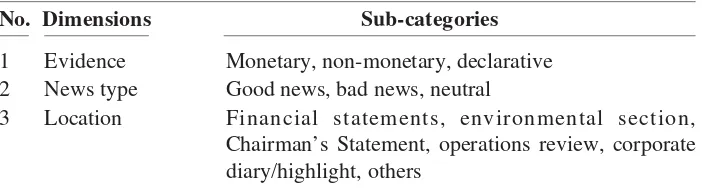
The next step is to develop a cat-egorization scheme classifying each item into several dimensions (Milne and Adler 1999). Previous studies use evidence, amount, location, news type, environment sub-themes and manda-tory/voluntary characteristic (Milne and Adler 1999). This study, however,
adapts the classification scheme used in Nik Ahmad and Sulaiman (2004) and Alrazi (2005). For the “location” dimension, financial statements (in-cluding the director’s report and notes to the accounts) and the environmental section are added as sub-categories. Meanwhile, the “environmental sub-themes” dimension is removed (see Table 3).
Quality of Disclosure. Alrazi (2005) develops a disclosure index to assess the quality of information. The index measures the comprehensive-ness of environmental information in terms of its breadth and depth. Ac-cordingly, this reflects the compre-hensiveness of disclosed items, and thus their quality. In addition, measur-ing quantity in sentences excludes in-formation in the form of photos, graphs, and charts. The quality measure, through the disclosure index, over-comes the limitation of the quantity measure. This definition of quality was also used by authors like Davis-Wall-ing and Batterman (1997), ElkDavis-Wall-ington et al. (1998), Morhardt (2001) and Morhardt et al. (2002).
There are two stages in develop-ing a disclosure index (Owusu-Ansah Table 3. Categorisation Scheme for Environmental Information
No. Dimensions Sub-categories
1 Evidence Monetary, non-monetary, declarative 2 News type Good news, bad news, neutral
1998). The first involves determining the items to be included. The items included are derived from studies by Wiseman (1982), Walden and Schwartz (1997), Davis-Walling and Batterman (1997), Elkington et al.
(1998), Morhardt (2001), Morhardt et al. (2002) and Krut and Munis (1998). Additionally, the disclosure index in-cludes the adjudication criteria used in MERA (currently, MaSRA) and NACRA. Other items are derived from the GRI’s guidelines (Global Report-ing Initiative) as well as the ACCA environmental reporting guidelines (ACCA 2003).
As a result, the index has 100 items grouped into 14 categories: cor-porate context, corcor-porate commitment, environmental policy, targets and achievements, environmental manage-ment systems, environmanage-mental impacts, performance data, research and devel-opment, third party statements, com-pliance/non-compliance, financial data, stakeholders’ engagement and other environmental initiatives, awards, and report designs (see Ap-pendix B).
The second stage involves quanti-fying the items in the index to deter-mine the extent to which a company has disclosed environmental issues. This takes into account several impor-tant considerations. Firstly, a dichoto-mous system awards one point for a company that discloses the item and zero for non-disclosure (i.e., 1= dis-closed; 0= non-disclosed). Secondly, a polychotomous system awards points based on an ascending scale. For
ex-ample, a zero for non-disclosure, a “1” for minimal, a “2” for satisfactory dis-closure and a “3” for comprehensive disclosure.
Alrazi (2005) score the environ-mental reporting on an unweighted and dichotomous basis. The main rea-son for using a dichotomous basis is to avoid unnecessary bias (Banks et al. 1997; Owusu-Ansah 1998). Neverthe-less, the disclosure scores for each company are based on the ratio of what the reporting company discloses to what it is expected to disclose. This ratio is referred to as the relative index (Owusu-Ansah 1998). The relative index is calculated to ensure that the company will not be penalised for non-disclosure of information that is not relevant to it.
Meanwhile, Cooke (1989) sup-ports the unweighted scoring system since the overall effect of subjective evaluation by various groups of re-spondents is minimal. He also finds that firms better at disclosing impor-tant items are also better at disclosing less important items. Finally, previous empirical findings suggest that the re-sults from unweighted and weighted scoring systems are not statistically different (Chow and Boren 1987; Robbins and Austin 1986; Coy et al. 1993; Wallace, Kamal and Mora 1994; Coy and Dixon 2004).
Reliability of the Findings
author conducts a content analysis of the 2002 annual reports of 20 compa-nies from various industries. This is consistent with Milne and Adler (1999)’s argument that at least 20 an-nual reports are needed in a pilot study before the findings can be considered reliable.
We conducted a stability test us-ing the test-retest procedure durus-ing the actual data collection (Krippendorf 1980). The annual reports are
reexam-ined, one month after the first attempt. No significant differences in the re-sults are evident.
Findings and Analysis
Number of Reporting
Companies
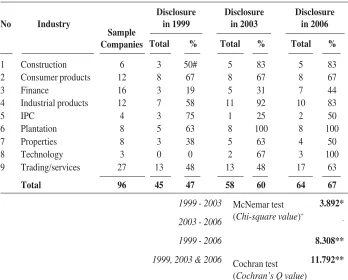
Table 4 provides the distribution of reporting companies by industry. It can be observed that in 1999, only
Table 4. Distribution of Disclosing Companies According to Industrial Classification
Disclosure Disclosure Disclosure
No Industry in 1999 in 2003 in 2006
Total % Total % Total %
1 Construction 6 3 50# 5 83 5 83
2 Consumer products 12 8 67 8 67 8 67
3 Finance 16 3 19 5 31 7 44
4 Industrial products 12 7 58 11 92 10 83
5 IPC 4 3 75 1 25 2 50
6 Plantation 8 5 63 8 100 8 100
7 Properties 8 3 38 5 63 4 50
8 Technology 3 0 0 2 67 3 100
9 Trading/services 27 13 48 13 48 17 63
Total 96 45 47 58 60 64 67
1999 - 2003 3.892*
2003 - 2006
-1999 - 2006 8.308**
1999, 2003 & 2006 11.792**
* Significant at 0.05 level (two-tailed); ** Significant at 0.01 level (two-tailed) # (3/6)*100%
+ The change in the reporting companies between 2003 and 2006 is minor. McNemar test uses binomial distribution and as such no corresponding Chi-squarevalue is provided.
Sample Companies
McNemar test (Chi-square value)+
companies in the Technology sector did not include environmental infor-mation in their annual reports. How-ever, starting in 2003, all sectors have at least one company disclosing such information in annual reports. Also, there was a significant increase in the number of reporting companies from 45 (47%) in 1999 to 64 (67%) in 2006 (p= 0.01).2 While a significant increase is observed from 1999 to 2003, a simi-lar pattern is not evident in the disclo-sure practice between 2003 and 2006. We also find that 34 companies have consistently reported some form of environmental information every year, whereas 25 companies do not report in any year.
Quantity of Reporting
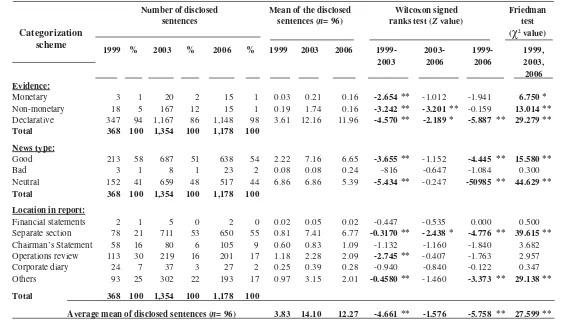
The quantity of environmental reporting is based on the number of sentences (see Appendix C for de-scriptive statistics). Table 5 provides the environmental disclosure catego-ries in terms of evidence, news type and location. The average number of sentences disclosed in 1999 was 3.83, and this increased to 14.10 sentences
in 2003 (p= 0.000) but later dropped to 12.27 sentences in 2006.3 However, the drop is insignificant. Overall, the information is merely declarative. Fur-ther, eventhough there was a signifi-cant increase in the number of compa-nies providing monetary environmen-tal information in 2003, almost 50 percent of them related to sponsorship activities.
Consistent with previous research (Deegan and Gordon 1996; Nik Ahmad and Sulaiman 2004), most companies tend to neglect bad news disclosure. When it is disclosed, it often focuses on contingent liabilities. Some com-panies do disclose environmental ac-cidents but such disclosures lack clar-ity. Furthermore, the information is normally accompanied by sentences indicating that the problem is not very severe.
In one case, no details are pro-vided regarding measures undertaken to ensure such incidents will not recur. Meanwhile, in the case of another com-pany, although it describes preventive measures in the subsequent sentence, no quantitative information is provided
2 We perform McNemar test to see any difference in the number of reporting companies between 1999-2003, 2003-2006 and 1999-2006. This is consistent with Niskala and Pretes (1995). Similarly, we also test any difference between 1999, 2003 and 2006 using Cochran test. We do not use Friedman χ2 test as in Moneva and Llena (2000) since the test is not suitable for categorical data used
in this case where reporting is denoted as “1” and “0” otherwise.
3 We run Kolmogrov Smirnov Z-test to test the data normality, where significance level of less than 5 percent indicates that the distribution of the data is not normal (de Vaus 2002). Since the data are not normally distributed, we run non-parametric tests of Wilcoxon signed rank test to see any difference in the reporting between 1999-2003, 2003-2006 and 1999-2006; and Friedman χ2 test for
51
&
Nik Ahmad—
A longitudinal Examination of Environmental Reporting Practices in Malaysia
Number of disclosed Mean of the disclosed Wilcoxon signed Friedman
sentences sentences (n= 96) ranks test (Z value) test
(χ2 value)
1999 % 2003 % 2006 % 1999 2003 2006 1999- 2003- 1999- 1999,
2003 2006 2006 2003,
2006 Evidence:
Monetary 3 1 20 2 15 1 0.03 0.21 0.16 -2.654 ** -1.012 -1.941 6.750 *
Non-monetary 18 5 167 12 15 1 0.19 1.74 0.16 -3.242 ** -3.201 ** -0.159 13.014 **
Declarative 347 94 1,167 86 1,148 98 3.61 12.16 11.96 -4.570 ** -2.189 * -5.887 ** 29.279 **
Total 368 100 1,354 100 1,178 100
News type:
Good 213 58 687 51 638 54 2.22 7.16 6.65 -3.655 ** -1.152 -4.445 ** 15.580 **
Bad 3 1 8 1 23 2 0.08 0.08 0.24 -816 -0.647 -1.084 0.300
Neutral 152 41 659 48 517 44 6.86 6.86 5.39 -5.434 ** -0.247 -50985 ** 44.629 **
Total 368 100 1,354 100 1,178 100
Location in report:
Financial statements 2 1 5 0 2 0 0.02 0.05 0.02 -0.447 -0.535 0.000 0.500
Separate section 78 21 711 53 650 55 0.81 7.41 6.77 -0.3170 ** -2.438 * -4.776 ** 39.615 **
Chairman’s Statement 58 16 80 6 105 9 0.60 0.83 1.09 -1.132 -1.160 -1.840 3.682
Operations review 113 30 219 16 201 17 1.18 2.28 2.09 -2.745 ** -0.407 -1.763 2.957
Corporate diary 24 7 37 3 27 2 0.25 0.39 0.28 -0.940 -0.840 -0.122 0.347
Others 93 25 302 22 193 17 0.97 3.15 2.01 -0.4580 ** -1.460 -3.373 ** 29.138 **
Total 368 100 1,354 100 1,178 100
Average mean of disclosed sentences (n= 96) 3.83 14.10 12.27 -4.661 ** -1.576 -5.758 ** 27.599 **
* Significant at 0.05 level (two-tailed); ** Significant at 0.01 level (two-tailed)
in terms of the externalities produced. Also, there is no disclosure on the possible impacts on the surrounding habitat.
For 1999, most of the disclosure was located in the Operations Review section (30% of total number of sen-tences). However, in 2003 and 2006, the most preferred location was a sepa-rate section on the environment. Such disclosure accounted for 51 percent and 55 percent of the total number of sentences respectively. This suggests that companies are increasingly put-ting greater importance on environ-mental disclosure. Disclosure of envi-ronmental information in the financial statements is almost non-existent. This is perhaps due the fact that financial statements are under the purview of the auditors.
Quality of Reporting
Table 6 provides the results of the trend in environmental reporting qual-ity (see Appendix C for descriptive statistics). One point is given for each item disclosed in each category, and the disclosure score (DS) is computed by adding all the points in that cat-egory. The total possible scores for each disclosure category are also re-ported to provide a more accurate pic-ture of the quality of information.
Overall, there was a significant increase in the quality of reported in-formation (p= 0.000), between 1999 and 2003, and 1999 and 2006, but not between 2003 and 2006. In 1999, the mean of DS was 4.11, in 2003 was 7.47, and in 2006 was 6.82. This
ap-pears to indicate that, on average, Ma-laysian companies only manage to meet 4 percent to 7 percent of the criteria included in the disclosure index. Thus, even though there is an increase, the quality is still very low. Additionally, it can be observed that most of the disclosures emphasize “environmen-tal policy” (i.e., 30% of disclosure scores in each year). This might be due to the highest number of items allo-cated under this category. Addition-ally, unlike information on targets, performance, compliance and finan-cial which are quantitative and objec-tive in nature, policy is rather subjec-tive and subject to less scrutiny by the public, relevant authorities and other interested parties.
None of the companies has an independent verification of the infor-mation disclosed. This reduces the credibility of the environmental infor-mation disclosed. Furthermore, most companies do not disclose environ-mental achievements against prede-termined targets. Additionally, it ap-pears that companies in Malaysia have made no effort to adopt any reporting guidelines.
53
&
Nik Ahmad—
A longitudinal Examination of Environmental Reporting Practices in Malaysia
Table 6. Descriptive Findings of the Quality of Environmental Reporting
Disclosure Scores (DS) Mean of DS Wilcoxon signed Friedman
(n = 110) ranks test test
Categories (Z value) (χχχχχ2 value)
1999 % 2003 % 2006 % 1999 2003 2006 1999- 2003- 1999- 1999,
2003 2006 2006 2003
2006
1. Context 56 14# 70 10 88 13 3 0.58## 0.73 0.92 -1.593 -2.486 * -3.573 ** 16.133 **
2. Commitment 48 12 76 11 87 13 8 0.50 0.79 0.91 -1.750 -.525 -2.063 * 4.414 3. Policy 128 32 241 34 205 31 11 1.33 2.51 2.14 -4.378 ** -1.634 -2.938 ** 12.091 **
4. Targets 10 2 16 2 7 1 5 0.10 0.17 0.07 -.915 -1.795 -.499 5.032 5. EMS 48 12 104 15 63 10 9 0.50 1.08 0.66 -3.645 ** -2.547 * -1.237 14.014 **
6. Impacts 21 5 40 6 15 2 3 0.22 0.42 0.16 -2.639 ** -3.638 ** -.906 15.557 **
7. Performance 2 1 17 2 19 3 16 0.02 0.18 0.20 -1.625 -.480 -2.219 * 3.152 8. R&D 19 5 25 3 20 3 5 0.20 0.26 0.21 -.936 -.756 -.111 .585 9. Third party 0 0 0 0 0 0 7 0.00 0.00 0.00 .000 .000 .000 -10.Compliance 9 2 36 5 29 4 8 0.09 0.38 0.30 -2.814 ** -.819 -2.638 ** 10.099 **
11.Financial 6 2 14 2 1 0 9 0.06 0.15 0.01 -2.138 * -2.970 ** -1.890 12.634 **
12.Stakeholder 37 9 40 6 60 9 8 0.39 0.42 0.63 -.092 -1.738 -1.520 3.313 13.Awards 4 1 16 2 14 2 2 0.04 0.17 0.15 -2.556 * -.354 -2.140 * 6.939 *
14.Design 7 2 22 3 47 7 6 0.17 0.23 0.49 -2.804 ** -4.106 ** -5.180 ** 42.950 ** Total 395 100 717 100 655 100 100 4.11 7.47 6.82 -3.767 ** -.116 -2.924 ** 14.263 **
** Significant at 0.01 level (two-tailed) ; *Significant at 0.05 level (two-tailed) # (56/395)*100; ## 56/96
Total possible
reported information between 2003 and 2006 suggest that the hypotheses can-not be supported.
A closer look at individual com-panies’ quantity and quality of report-ing reveal that the significant increase in 2003 and the reduction in 2006 could be attributed to the following instances (refer Appendix D). Golden Hope Plantations Berhad and Kumpulan Guthrie Berhad experi-enced an increase by 5.42 times (0.30 times) and 1.64 times (0.60 times), respectively, in the quantity (quality) of reporting in 2003. On the contrary, in 2006, they showed a decrease by 0.77 times (0.41 times) and 0.61 times (0.44 times) in the quantity (quality). This could be due to the proposed merger between these two companies and another company, Permodalan Nasional Berhad, to form Synergy Drive Berhad in 2006 such that report-ing on the environment might be per-ceived as less important than inform-ing the shareholders on the implica-tions of the impending merger.
Coincidently, United Plantations Berhad shows a decrease by 62 per-cent and 25 perper-cent in the quantity and quality of reporting, respectively. Since both Golden Hope and Guthrie are plantation companies, a reduction in the reporting of these companies may have an impact on the reporting of United Plantations as the company may face less pressure to report on the environment to the public. The de-crease in the reporting of Shell Refin-ing Company (FOM) Berhad and Puncak Niaga Holdings Berhad is
rather surprising. Perhaps, the require-ments on environmental reporting by Bursa Malaysia indicate that reporting more information may trigger un-wanted attention from regulators (Gra-ham et al. 2005). Despite this, there are other companies that continuously improve their reporting practices, in-cluding Nestle (M) Berhad, Telekom Malaysia Berhad, Petronas Gas Berhad and IJM Corporation Berhad.
Nasi et al. (1997) do not find a pattern of steady increase in the corpo-rate social reporting of Finnish and Canadian forestry companies, suggest-ing that although the life cycle effect holds over the long term, it is moder-ated by other influences. Similarly, in this study, we find that reporting sig-nificantly increased from 1999 to 2006. However, there was a decrease in the quantity and quality of reporting in 2006 due to several possible reasons presented above. Thus, the findings provide limited supports to the predic-tion of social issuelife cycle theory.
Conclusion
1999 to 6.82 in 2006. All these find-ings provide limited supports for so-cial issue life cycle theory.
This study contributes to the body of knowledge, particularly with the discussion of social issue life cycle theory in the context of environmental reporting practices in Malaysia. Addi-tionally, it provides evidence of the level of readiness amongst Malaysian companies prior to the possible imple-mentation of mandatory reporting.
The results of this study should be interpreted with care. Firstly, environ-mental disclosure is only measured in the annual reports of 1999, 2003 and 2006. Therefore, it does not capture any change in the years between them. As such, it fails to conclude whether environmental information has been reported every year. Future studies may consider including the annual re-ports for these years. Furthermore, a study on an extended period, say 10 to 15 years, may enrich our understand-ing of environmental reportunderstand-ing prac-tices.
Secondly, it focuses on the con-tent analysis of the annual reports, thereby raising some concerns. The
first concern relates to the issue of subjectivity. However, the problem is minimized by using an established checklist instrument and decision rules for the definition of environmental reporting and undertaking a two-stage coding/scoring process. The second concern is that it ignores other media such as environmental reports, news-papers, brochures and company web
sites. Future research may examine environmental reporting in other com-pany publications. The third concern
relates to the assumption that the an-nual reports represent the ultimate per-ception of the company on environ-mental issues. Thus, a low level of disclosure indicates a low level of im-portance attached by the companies towards environmental issues. This might not be necessarily true (Jaggi and Zhao 1996; Nik Ahmad and Abdul Rahim 2005). Therefore, questionnaire surveys or interviews may be used to supplement findings from a content analysis study.
Thirdly, this study focuses only on the top 96 companies (by market capitalization). As such, it may not be able to generalize the findings to small companies. Since it does not consider small companies that may have re-ported environmental information, the quality of their environmental infor-mation —based on the disclosure in-dex— is relatively unknown. In addi-tion, our study examines large compa-nies that have continuously been listed between 1999 and 2006. Accordingly, there may exist a survivor bias.
future studies may modify the disclo-sure index to also capture these other dimensions of quality.
Finally, the study does not exam-ine any corporate characteristics of companies disclosing environmental information. There are several vari-ables that may explain environmental
reporting behavior. These include en-vironmental sensitivity, size of com-pany, profitability, financial leverage, and foreign ownership. Future research in the area may examine the relation-ships amongst these variables and the quantity and quality of environmental reporting.
References
Abu-Baker, N., and K. Naser. 2000. Empirical evidence on corporate social disclosure (CSD) practices in Jordan. International Journal of Commerce and Management 10 (3 and 4): 18-34.
Ackerman, R. W. 1975. The Social Challenge to Business. Cambridge, MA: Harvard University Press.
Ahmad, Z., Hassan, S., and J. Mohammad. 2003. Determinants of environmental reporting in Malaysia. International Journal of Business Studies 11 (1): 69-90.
Alrazi, B. 2005. Comparing environmental reporting practices of public-listed companies in Malaysia in 1999 and 2003: An investigation of quantity and quality. Unpublished Masters’ Thesis. Malaysia: International Islamic University Malaysia.
Banks, W., J. Fisher, and M. Nelson. 1997. University accountability in England, Wales, and Northern Ireland: 1992-1994. Journal of International Accounting, Auditing and Taxation 6 (2): 211-226.
Bigelow, B., L. Fahey, and J. F. Mahon. 1993. A typology of issue evolution. Business and Society 32 (1): 18-29.
Brown, N., and C. Deegan. 1998. The public disclosure of environmental performance information – A dual test of media agency setting theory and legitimacy theory. Accounting and Business Research 29 (1): 21-41.
Buhr, N., and M. Freedman. 2001. Culture, institutional factors and differences in environmental disclosure between Canada and the United States. Critical Perspec-tives on Accounting 12: 293 – 322.
Buniamin, S., B. Alrazi, N. H. Johari, and N. R. Abd Rahman. 2008. An investigation of the association between corporate governance and environmental reporting in Malaysia. Asian Journal of Business and Accounting 1 (2): 65 – 88.
Buniamin, S., and R. Jaffar. 2004. Environmental reporting in Malaysia: Perspective of the management. Management Accounting Review 3 (1): 43-59.
Bursa Malaysia. 2009. Listing Requirements of Bursa Malaysia Securities Berhad. Campbell, D. 2004. A longitudinal and cross-sectional analysis of environmental
disclo-sure in UK companies – a research note. The British Accounting Review 36: 107-117. Choi, J. S. 1999. An investigation of the initial voluntary environmental disclosures made in Korean semi-annual financial reports. Pacific Accounting Review 11 (1): 73-102. Chow, C. W., and A. W. Boren. 1987. Voluntary financial disclosure by Mexican
corporations. The Accounting Review 62 (3): 533-541.
Cooke, T. E. 1989. Disclosure in the corporate annual reports of Swedish companies. Accounting and Business Research 19 (74): 113-124.
Cormier, D., and M. Magnan. 2003. Environmental reporting management: A continental European perspective. Journal of Accounting and Public Policy 22: 43-62. Coy, D., and K. Dixon. 2004. The public accountability index: Crafting a parametric
disclosure index for annual reports. The British Accounting Review 36: 79-106. Coy, D., G. Tower, and K. Dixon. 1993. Quantifying the quality of tertiary education
annual reports. Accounting and Finance 33: 121-129.
Davis-Walling, P. and S. A. Batterman. 1997. Environmental reporting by the Fortune 500 firms. Environmental Management 21 (6): 865-875.
De Vaus, D. 2002. Analyzing Social Science Data (1st ed.). London: SAGE Publications Ltd.
De Villiers, C., and C. J. Van Staden. 2006. Can less environmental disclosures have a legitimizing effect? Evidence from Africa. Accounting, Organizations and Society 31: 763-781.
Deegan, C., and B. Gordon. 1996. A study of the environmental disclosure practices of Australian corporations. Accounting and Business Research 26 (3): 187-199. Deegan, C., and M. Rankin. 1996. Do Australian companies report environmental news
objectively? An analysis of environmental disclosures by firms prosecuted success-fully by the environmental protection authority. Accounting, Auditing and Account-ability Journal 2: 50-67.
Deegan, C., M. Rankin, and J. Tobin. 2002. An examination of the corporate social and environmental disclosures of BHP from 1983-1997 – a test of legitimacy theory. Accounting, Auditing and Accountability Journal 15 (3): 312-343.
Elkington, J., N. Kreander, and H. Stibbard. 1998. The third international survey on company environmental reporting: The 1997 benchmark survey. Greener Manage-ment International 21: 99-112.
Environmental Quality Act. 1974. Act 127.
Eweje, G. 2005. Hazardous employment and regulatory regimes in the South African mining industry: Arguments for corporate ethics at workplace. Journal of Business Ethics 56: 163 – 183.
Eweje, G. 2006b. The role of MNEs in community development initiatives in developing countries – Corporate social responsibility at work in Nigeria and South Africa. Business and Society 45 (2): 93 – 129.
Finance Committee on Corporate Governance. 2000. Malaysian Code on Corporate Governance. Kuala Lumpur.
Global Reporting Initiative. 2002. Sustainability Reporting Guidelines. Boston. Graham, J. R., C. R. Harvey, and S. Rajgopal. 2005. The economic implications of
corporate financial reporting. Journal of Accounting and Economics 40: 3-73. Gray, R., R. Kouhy, and S. Lavers. 1995a. Corporate social and environmental reporting
– a review of the literature and a longitudinal study of UK disclosure. Accounting, Auditing and Accountability Journal 8 (2): 47-77.
Gray, R., R. Kouhy, and S. Lavers. 1995b. Methodological themes – constructing a research database of social and environmental reporting by UK companies. Account-ing, Auditing and Accountability Journal 8 (2): 78-101.
Hackston, D., and M. J. Milne. 1996. Some determinants of social and environmental disclosures in New Zealand companies. Accounting, Auditing and Accountability Journal 9 (1): 77 – 108.
Haniffa, R. M., and T. E. Cooke. 2005. The impact of culture and governance on corporate social reporting. Journal of Accounting and Public Policy 24: 391 – 430.
Hooks, J., K. Kearins, and M. Blake. 2004. Effective environmental disclosure? An evaluation of power generators’ reporting initiatives. New Zealand Applied Business Research 2 (2): 40 - 58.
Imam, S. 2000. Corporate social performance reporting in Bangladesh. Managerial Auditing Journal 15 (3): 133-141.
Jaffar, R., T. Mohd. Iskandar, and I. Muhamad. 2002. Investigation of environmental disclosures: Evidence from selected industries in Malaysia. International Journal of Business and Society 3: 55-68.
Jaggi, B., and R. Zhao. 1996. Environmental performance and reporting: Perceptions of managers and accounting professionals in Hong Kong. The International Journal of Accounting 31 (3): 333 – 346.
Jones, K., and T. Alabaster. 1999. Critical analysis of corporate environmental reporting scoring system. Journal of Environmental Assessment Policy and Management 1 (1): 27-60.
KPMG. 1999. KPMG International Survey of Environmental Reporting 1999. Amsterdam: KPMG Environmental Consulting.
KPMG. 2002. KPMG International Survey of Corporate Sustainability Reporting 2002. Amsterdam: KPMG Global Sustainability Services.
Krippendorf, K. 1980. Content Analysis – An Introduction to its Methodology. California: Sage Publications Inc.
Mahon, J. F., and S. A. Waddock. 1992. Strategic issues management: An integration of issue life cycle perspectives. Business and Society 31 (1): 19-32.
Malaysian Accounting Standards Board. 1999. MASB 1 – Presentation of Financial Statements. Kuala Lumpur.
Malaysian Accounting Standards Board. 2001. MASB 20 – Provisions, Contingent Liabilities and Contingent Assets. Kuala Lumpur.
Milne, M. J., and R. W. Adler. 1999. Exploring the reliability of social and environmental disclosures content analysis. Accounting, Auditing and Accountability Journal 12 (2): 237-256.
Moneva, J. M., and F. Llena. 2000. Environmental disclosures in the annual reports of large companies in Spain. The European Accounting Review 9 (1): 7 – 29. Morhardt, J. E. 2001. Scoring corporate environmental reports for comprehensiveness: A
comparison of three systems. Environmental Management 27 (6): 881-892. Morhardt, J. E., S. Baird, and K. Freeman. 2002. Scoring corporate environmental and
sustainability reports using GRI 2000, ISO 14031 and other criteria. Corporate Social Responsibility and Environmental Management 9: 215-233.
Murthy, V., and I. Abeysekera. 2008. Corporate Social Reporting Practices. The Australasian Accounting Business and Finance Journal 2 (1) (February): 36 - 59. Nasi, J., S. Nasi, N. Phillips, and S. C. Zyglidopoulos. 1997. The evolution of corporate social responsiveness – an exploratory study of Finnish and Canadian forestry companies. Business and Society 36 (3): 296-321.
Neu, D., H. Warsame, and K. Pedwell. 1998. Managing public impressions: environmen-tal disclosures in annual reports. Accounting, Organisations and Society 23 (3): 265-282.
Nik Ahmad, N. N., and M. Sulaiman. 2004. Environmental disclosures in Malaysian annual reports: A legitimacy theory perspective. International Journal of Commerce and Management 14 (1): 44-58.
Nik Ahmad, N. N., and N. L. A. Abdul Rahim. 2005. Awareness of corporate social responsibility among selected companies in Malaysia – an exploratory note. Malay-sian Accounting Review 4 (1): 11-24.
Nik Ahmad, N. N., M. Sulaiman, and D. Siswantoro. 2003. Corporate social responsibility disclosure in Malaysia: An analysis of annual reports of KLSE listed companies. IIUM Journal of Economics and Management 11 (1): 51-86.
Niskala, M., and M. Pretes. 1995. Environmental reporting in Finland: A note on the use of annual reports. Accounting, Organisations and Society 20 (6): 457-466. Owusu-Ansah, S. 1998. The impact of corporate attributes on the extent of mandatory
disclosure and reporting by listed companies in Zimbabwe. The International Journal of Accounting 33 (5): 605-631.
Post, J. E. 1978. Corporate Behavior and Social Change. Virginia: Reston Publishing Co. Ramasamy, B., and W. T. Hung. 2004. A comparative analysis of corporate social responsibility awareness – Malaysian and Singaporean firms. Journal of Corporate Citizenship 13: 109-123.
Robbins, W. A., and K. R. Austin. 1986. Disclosure quality in governmental financial reports: An assessment of the appropriateness of a compound measure. Journal of Accounting Research 24 (2): 412-421.
Smith, M, K. Yahya, and A. M. Amiruddin. 2007. Environmental disclosure and perfor-mance reporting in Malaysia. Asian Review of Accounting 15 (2): 185-199. Sumiani, Y., Y. Haslinda, and G. Lehman. 2007. Environmental reporting in a developing
country: a case study on status and implementation in Malaysia. Journal of Cleaner Production 15: 895 – 901.
The Association of Chartered Certified Accountants. 2002. The State of Corporate Environmental Reporting in Malaysia. London: Certified Accountants Educational Trust.
The Association of Chartered Certified Accountants. 2003. Environmental Reporting Guidelines for Malaysian Companies. London: Certified Accountants Educational Trust.
The Association of Chartered Certified Accountants. 2004. Malaysian Environmental Reporting Awards. http://www.accaglobal.com/sustainability/awards/mera/ (accessed October 31)
The Association of Chartered Certified Accountants. 2004. Report Summary – The State of Corporate Environmental and Social Reporting in Malaysia 2004. London: Certified Accountants Educational Trust.
The Association of Chartered Certified Accountants. 2005. Sustainability Reporting Guidelines for Malaysian Companies. London: Certified Accountants Educational Trust.
Thompson, P., and Z. Zakaria. 2004. Corporate social responsibility reporting in Malaysia – progress and prospects. Journal of Corporate Citizenship 13: 125-136.
Tilt, C. A. 1994. The influence of external pressure groups on corporate social disclosure: Some empirical evidence. Accounting, Auditing and Accountability Journal 7 (4): 56-71.
Tsang, E. W. K. 1998. A longitudinal study of corporate social reporting in Singapore – the case of the banking, food and beverages and hotel Industries. Accounting, Auditing and Accountability Journal 11 (5): 624 – 635.
Unerman, J. 2000. Methodological issues: Reflections on quantification in corporate social reporting content analysis. Accounting, Auditing and Accountability Journal 13 (5): 667-680.
Wallace, R. S., N. Kamal, and A. Mora. 1994. The relationship between the comprehen-siveness of corporate annual reports and firm characteristics in Spain. Accounting and Business Research 25 (97): 41-53.
Weber, R. P. 1990. Basic Content Analysis (2nd ed.). California: Sage Publications Inc. Williams, S. M. 1999. Voluntary environmental and social accounting disclosure practices in the Asia-Pacific region: An international empirical test of political economy theory. The International Journal of Accounting 34 (2): 209–238.
Wilmshurst, T. D., and G. F. Frost. 2000. Corporate environmental reporting: A test of legitimacy theory. Accounting, Auditing and Accountability Journal 13 (1): 10–26. Wiseman, J. 1982. An evaluation of environmental disclosures made in corporate annual
reports. Accounting, Organisations and Society 7 (1): 53-63.
Yusoff, H., G. Lehman, and N. Mohd. Nasir. 2006. Environmental engagements through the lens of disclosure practices – a Malaysian story. Asian Review of Accounting 14 (1/2): 122 – 148.
Appendix A
Checklist instrument
(Note: The italic words/sentences are amendments made after the pilot study)
No Areas Items
1 QStatement of the corporation’s business operations on environmental pollution pertaining to noise, air, water and visual quality
QStatements indicating that the company’s operations are non-polluting or that they are in compliance with pollution laws and regulations§
QRecognition of the need to comply with society standards and regulationsø§ Statement of the capital, operating, and research and development expendi-tures and activities of the environmental pollution produced by the firm with respect to noise, air, water and visual quality
2 Environmental policy QActual statement of policy
QStatement of formal intentions
QStatements indicating that company will undertake certain measures to curb environmental pollution and other such damage or what the company does
3 Environmental audit QReference to environmental review, scoping, audit, assessment including independent attestation
4 Environmental QWaste(s)–including preventing waste; efficiently using material resources in the manufacturing processes§
QPackaging
QRecycling–including using (or researching)ø recycled materials§; conservation of natural resources e.g. recycling glass, metals, oil, water and paper§ QProducts and product development
QLand contamination and mediation – including prevention or repair damage to the environment resulting from processing of natural resources e.g. land reclamation or reforestation§
5 Environmental QReference to financial/economic impact QInvestment and investment appraisal
QDiscussion of areas with financial/economic impact
QDiscussion of environmental-economic interaction
6 Sustainability QAny mention of sustainability
QAny mention of sustainable development
7 Environmental QDesigning facilities harmonious with the environment
Aesthetics QContributions in terms of cash or plants/flowers to beautify the environment QNatural landscaping
General environmental considerations (environmental pollution)ø
–product and process related
Continued from Appendix A
No Areas Items
8 Environmental – Other QInvolvement in schemes
QUndertaking environmental impact studies to monitor the company’s impact on the environment–including conducting review of performance; employing specialist consultantsø
QReceiving awards related to programs or policies of company
QProtection of the environment
QEnvironmental education–including training employees in environmental issues§
QWildlife conservation§
QSupporting environmental campaigns
9 Energy QConservation of energy in the conduct of business operations QUsing energy more efficiently during the manufacturing process
QUtilising waste materials for energy production
QDisclosing energy savings resulting from product recycling
QDiscussing the company’s efforts to reduce energy consumption
QDisclosing increased energy efficiency of products
QResearch aimed at improving energy efficiency of products§ Receiving an award for an energy conservation program QVoicing the company’s concern about the energy shortage
QDisclosing the company’s energy policies
Sources: Williams (1999), Hackston and Milne (1996)§ and Deegan et al. (2002)ø
Decision rules
1. All sponsorship activity is to be included no matter how much it is advertising 2. All disclosures must be specifically stated, they cannot be implied
3. Good/neutral/bad classifications to be determined from the perspective of the stakeholder group involved
Good: statements beyond the minimum which include (for example) specific details where these details have a creditable or neutral reflection on the company; any statements which reflect credit on the company; upbeat analysis/discussion/statements;
Bad: any statement which reflects/might reflect discredit on the company;
Neutral: statement of policy or intent within statutory minimum with no details of what or how; statement of facts whose credit/discredit to the company is not obvious – which are unaccompanied by editorialising (Gray et al., 1995b: 99).
Continued from Appendix A
Qualitative (declarative) information includes all verbal disclosure.
Quantitative (non-monetary) information refers to environmental measures such as emission levels and forest materials consumed in production by volume.
Financial information (monetary) includes all environmental information expressed in monetary terms (Niskala and Pretes 1995:457).
5. Any captions to graphical information will be considered as environmental information if they help in understanding the information provided in the text. In another way, it should be related to the text. 6. Any disclosure which is represented shall be recorded as an environmental sentence each time it is discussed.
Nevertheless, if the information is provided in another language i.e. Malay and/or Chinese, only those in English will be considered.
7. All classifications are undertaken with care so as to ensure that the disclosure is not part of the business (e.g. waste disposal, environmental technology or oil exploration companies)
8. Such information will be excluded (Nik Ahmad and Sulaiman 2004): a. References to industrial concerns about environmental issues b. Statements on changing public perceptions
Appendix B
Disclosure Index
No Categories Points Total
points (%)
1 Corporate context
Description of products and/or services 1
Identification of the boundary of the report
Environmental information is provided for each major 1 business operation
Environmental performance of other related parties is included 1 3
2 Corporate commitment
Vision and missiono
The vision statement of the organization mentions anything
on environment 1
The mission statement of the organisation mentions anything
on environment 1
Chairman/CEO Statemento
Environmental information is included in the statement 1
Mentions, in brief, the organisation’s environmental policy 1
Highlights the commitment by the organisation’s leadership
to environmental issues and objectives 1
Highlights the achievement in the current period–include
both success and failure 1
Identifies issues and challenges facing the organisation
Future environmental strategy 1 8
3 Environmental policy
There is an environmental policy or an indication that
any publicly established charters is being subscribed by the company 1
There is a set of environmental goals and objectives 1
The environmental goals and objectives should, at a minimum, state a commitment to:
Materials, water and energy conservation 1
Waste, emissions and discharges managemen 1
Continuous process improvement and monitoring 1
Supply chain management and/or product stewardship 1
Biodiversity maintenance and preservation 1
Compliance with environmental laws and regulations 1
Stakeholder relation management 1
Environmental performance reporting 1
Continued from Appendix B
No Categories Points Total
points (%)
4 Targets and achievement
There are specific environmental targets to be achieved 1
The target should cover all key environmental issues facing
the organization 1
Achievement (or progress) against targets are indicated 1
Reasons for any non-achievement of those targets 1
Associated remedial or preventive actions 1 5
5 Environmental management systems
The organization has an environmental management system, or planning
(and status) of implementation 1
There are members of the board/division/department responsible for
environmental management 1
The board/division/department is responsible for the whole
environmental issues in the organization 1
Identification of the key managerial responsibilities for the various aspects of the system which includes:
Contingency planning and risk management 1
Internal audit and review 1
Environmental impact assessment 1
The environmental management system is externally certified or
planned (and expected date) to be certified 1
Clear identification on the process/facilities involved in the certification 1
Training programs and related educational activities for staff 1 9
6 Environmental impacts
Identification of significant environmental impacts of the
organization’s activities, products and services 1
The implication should the impacts are not mitigated 1
The hiring of environmental specialists or external auditors to facilitate
the identification of environmental impacts 1 3
7 Performance data
Energy–absolute (joules); normalized; trends over time; comparative
data within sector 4
Materials–absolute (tones, volume or kilograms); normalized;
trends over time; comparative data within sectors 4
Water–absolute (liters or cubic meters); normalized; trends over time;
comparative data within sectors 4
Emissions, effluents and waste–absolute (tones or kilograms);
Continued from Appendix B
No Categories Points Total
points (%)
8 Research and development
There are research and development initiatives undertaken
on environmental improvements 1
Environmental objectives for the improvements are clearly set out 1
Actual and forecasted capital expenditures, liabilities 1
Financial qualification benefits 1
Collaborate on research and development with non-industrial
stakeholders 1 5
9 Third party statement
There is a statement by an external party to verify the information 1
The statement clearly states:
Remit and scope 1
Indication of site visits and site-specific testing 1
Interpretation of data/performance reported 1
Indication of any data/information omitted that could/should have been
included 1
Independent comment on corporate targets set and impacts identified 1
Shortcomings and recommendation 1 7
10 Compliance/non-compliance
The recognition of any pollution or environmental laws and
regulations which the organization’s operations are subject to 1
Statement indicates whether the organization is in compliance with
such laws and regulations 1
List the number of sites or departments that have received
complaints or have been prosecuted 1
Total number of fines paid or volume of fines/complaints 1
Any environmental accidents that resulted in any significant
environmental impact 1
Procedures that have been put in place to prevent such incidents 1
Comparison of the data over time 1
Comparison of the data within sector 1 8
11 Financial data
There is an environmental financial statement 1
The environmental information is integrated within conventional
financial statement 1
Continued from Appendix B
No Categories Points Total
points (%)
Other financial data:
Environmental investments/liabilities 1
Environmental benefits/expenses 1
Any specific accounting policies adopted 1
Contingent liabilities
Any environmental contingent liabilities arise during the period 1
Report on the value of contingent liabilities 1
Investment appraisal consideration 1 9
12 Stakeholder engagement and other environmental initiatives
Stakeholder engagement
Indication of stakeholder engagement in practice 1
Approaches to stakeholder consultation 1
Type of information generated 1
Use of the feedbacks 1
Community outreach program
Indication that an organization has conducted a community
outreach program 1
Details such as date, place and participation 1
Supporting any environmental campaigns/environmental initiatives
by external parties 1
Charitable contributions to or partnership with environmental
organizations 1 8
13 Awards
Any reporting awards received by an organization
Others 11 2
14 Report design
Indication of any relevant reporting guidelines followed 1
Innovative approaches 1
Appropriate graphics 1
Communication and feedback mechanism
Name of the person or department responsible with preparing the reports 1
Telephone number or email address 1
Separate environmental section is devoted in the annual report 1 6
100 (100%) Note:The criteria used under “Performance data” is as follows: absolute (1 mark), normalized (1), trends over time (1) and
Appendix C
Descriptive statistics for interval variables
Sentences Sentences Sentences DS DS DS
1999 2003 2006 1999 2003 2006
Mean 3.83 14.10 12.27 4.11 7.47 6.82
Median .00 1.00 4.00 .00 3.00 4.50
Std. deviation 10.199 39.551 19.385 6.416 10.251 7.631
Minimum 0 0 0 0.00 0.00 0.00
Maximum 61 321 84 30.00 44.38 36.00
Skewness 4.012 5.658 2.080 2.134 1.812 1.661
Std. Error of Skewness .246 .246 .246 .246 .246 .246
Kurtosis 16.881 39.246 3.628 4.740 2.978 3.220
Std. Error of Kurtosis .488 .488 .488 .488 .488 .488