Page 1 of 7
Please see important disclaimer on the last page of this report.
HIDDEN ASSET PLAYGROUND!
We initiate coverage on MNC Land (KPIG) ahead of its wide range corporate action expected to take place in the next 2-3 years. At this juncture, we think KPIG stock is relatively undervalued. Trading at ~1x book value, the market has not put any premium toward KPIG’s existing and new projects potential in our view. The completion of Ciawi – Lido toll road and the development of projects in Lido and Bali should serve as keys to unlock its value. KPIG’s rising cash flow from new projects roll-out and relatively low level of leverage will help finance development in its two signature projects in Lido and Bali. We believe, backed by management with strong talent pool in real estate and entertainment industry, KPIG has the ability to manifest this and transform itself into one-of-a-kind property company in Indonesia.
Unfolding Stories in 2015. In FY14, KPIG’s main driver of revenue was contributed from tourism (hotel & golf) which accounted for Rp663bn or 65.4% of total revenue. Apartment and other properties gave Rp187bn (18.4%) while office and others added Rp128bn (12.6%) and Rp35bn (3.5%) respectively. KPIG have a new office slated to top-off this year (MNC Tower), and another two which KPIG will benefited from management’s fee (MNC News Center, 3TV office). We also note that apartment sales only contributed slightly in FY14, thus we expect bigger bulk of it to account in FY15 and FY16. Our model estimates that apartment and lease office to increase by 36% and 8.3% in FY15. In the pipeline, KPIG has a mixed-use development in Surabaya and Park Hyatt hotel in Central Jakarta to add additional cash in KPIG’s coffers for ensuing years.
Long-Term is the Key. Currently, KPIG owns 1800ha land banks in Lido and 100ha in Bali under development. Over the longer-term horizon, the management expects 70-80% of KPIG’s revenue to stem from Lido and Bali Nirwana Resort. Their vision is to build one-stop destination for entertainment in Lido and Bali which are not expected to start soft-opening until 2018. To achieve this, the management will work together with outside foreignoperator to develop the two projects.
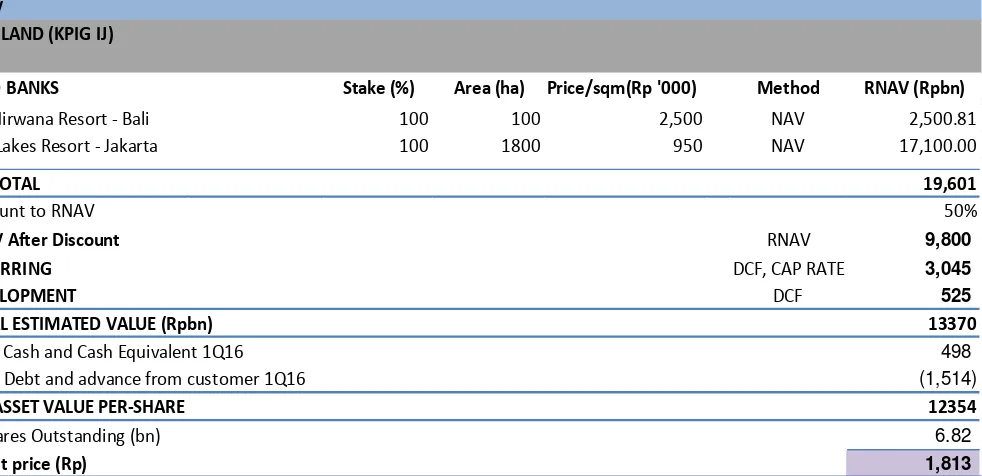
Method of Valuation. We value KPIG’s stock using mix of discounted cash flow and capitalization of income approach for each of its project using 13.8% WACC for development and 11% discount rate for recurring. For land banks, we valued it using RNAV with 50% discount to value. Consequently, we arrive at a price target of Rp1810/share or 35% increase to the upside.
Yudi Ilhamsyah
+62 21 2854 8881
[email protected] Forecast and Valuation (at closing price Rp1,340 per share)
Y/E Dec (Rpbn) 14A 15E 16E 17E
Revenue 1,013 1,114 1,235 1,370
EBITDA 361 413 468 532
Net Profit 385 498 296 353
EPS (Rp) 62 72 43 51
DPS (Rp) 10 13 17 10
Dividend Yield (%) 0.8 1.0 1.2 0.7
BV per Share (Rp) 1,260 1,186 1,213 1,254
EV/EBITDA (x) 26.1 24.5 21.3 18.5
P/E Ratio (x) 21.5 18.5 31.2 26.1
P/BV Ratio (x) 1.06 1.13 1.10 1.07
Target Price Rp 1,810
17 June 2015
Samuel Equity Research
Initiate Coverage
MNC Land
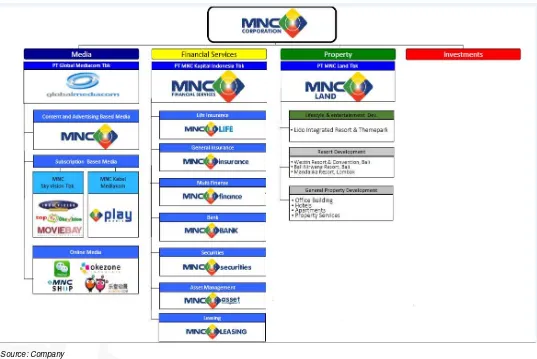
Bloomberg: KPIG.IJ | Reuters: KPIG.JKFigure 1. MNC Corporate Structure
Company Profile
MNC Land which operates full range commercial properties in Jakarta, Surabaya and Bali was established back in 1990 as PT Kridaperdana Indahgraha. It conducted its Initial Public Offering in 2001. During the period of 2007 to 2011, the company experienced a period of consolidation. It rebranded its office buildings from Menara Kebon Sirih and Plaza Kebon Sirih to MNC Tower and MNC Plaza in 2009, and changed its corporate name to PT MNC Land Tbk in 2012. MNC Land focuses going forward is centered on lifestyle and entertainment property in Lido, Bogor-Sukabumi and in Bali as their future key revenue driver.
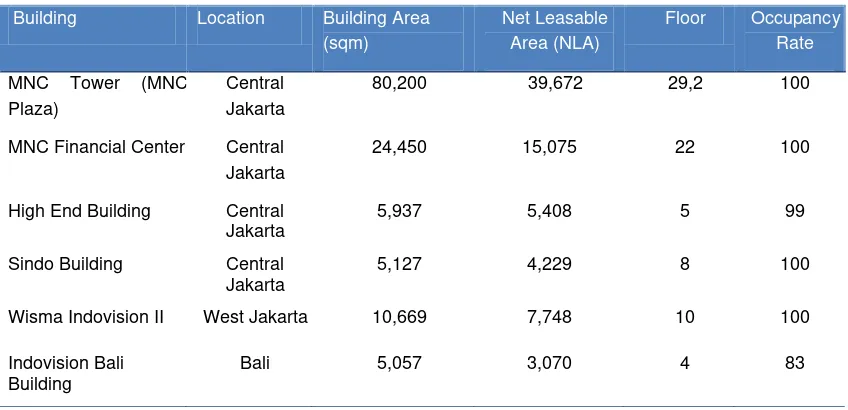
www.samuel.co.id Page 3 of 7 Figure 2. Existing portfolio
Building Location Building Area (sqm)
MNC News Center Central Jakarta 58,507 IDR658bn 16 3Q15
3 TV Stations and studio
West Jakarta 113,062 IDR1.29tn 18,14,18 3Q15
MNC Tower Surabaya 12,039 IDR154bn 12 2Q15
Central Jakarta 102,165 Rp2.35tn 39 4Q17
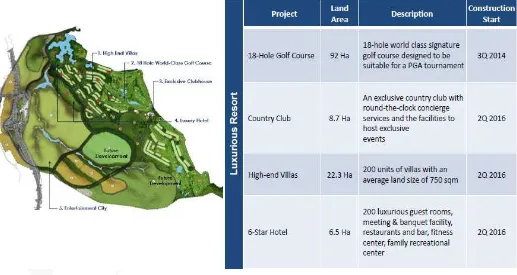
Figure 4. Lido’s 1st Phase Development
Source: Company
Long-Term is the Key
Going forward, we expect key projects in Lido (Bogor, Sukabumi) and Bali (Tanah Lot) to be KPIG’s main revenue drivers. According to the management, 70-80% revenue will stemmed from these two projects.
One stop entertainment and integrated resort in Lido: At this juncture, Lido’s existing properties
only consist of a four star resort and golf course. The management intends to develop these areas to build an integrated property development along with entertainment center. The masterplan includes total 2,000ha land area of which KPIG already owns 1,800ha. The development will be carried out in stages. First phase development will consist of (i) entertainment city (theme park), and (ii) premium resort and luxury hotel. In 4Q16, the management cited a more direct toll road, Ciawi – Cigombong, connecting Jagorawi toll road to Lido, to start operating.
Based on KPIG’s masterplan, the size of Entertainment City covers approximately 425ha or 21% of the total land bank. Roughly 75Ha will be allocated to theme park and its supporting facilities. The first phase development will include theme park, retail and dining entertainment and hotel. On our last meeting with the management, the theme park is slated to soft-open in 2018.
www.samuel.co.id Page 5 of 7 Figure 5. Location Map of Lido
Source: Company
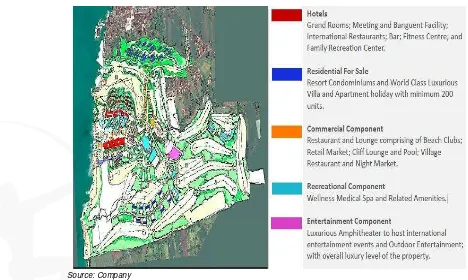
Figure 6. BNR Masterplan
Source: Company
Bali Nirwana Resort. BNR possess a total area of 103 Ha with location in Tanah Lot. Currently, BNR existing portfolio includes a five star resort, managed by Pan Pacific and 18-hole signature golf course. KPIG is in the process of redesigning the whole master plan to include hotel, villa, apartment, recreational and commercial component and entertainment center. Similar with development in Lido, KPIG will work together with outside foreign operator to build this project.
At this juncture, KPIG’s shares is trading at low
–
RNAV
MNC LAND (KPIG IJ)
LAND BANKS Stake (%) Area (ha) Price/sqm(Rp '000) Method RNAV (Rpbn)
Bali Nirwana Resort - Bali 100 100 2,500 NAV 2,500.81
Lido Lakes Resort - Jakarta 100 1800 950 NAV 17,100.00
SUBTOTAL 19,601
Discount to RNAV 50%
RNAV After Discount RNAV 9,800
RECURRING DCF, CAP RATE 3,045
DEVELOPMENT DCF 525
TOTAL ESTIMATED VALUE (Rpbn) 13370
Add: Cash and Cash Equivalent 1Q16 498
Less: Debt and advance from customer 1Q16 (1,514)
NET ASSET VALUE PER-SHARE 12354
# Shares Outstanding (bn) 6.82
Target price (Rp) 1,813
Figure 7. KPIG’s RNAV
Source: Samuel Research, Company
Risks And Concerns
1) Liquidity and Price Volatility. KPIG is a small cap stock with a market capitalization of Rp9,228 billion. Thus, the stock is subject to price volatility and shallow investor base.
2) Project Delays. KPIG Lido project may hinge upon Ciawi – Lido toll road completion. The construction is expected to finish in 4Q16. The theme park in Lido is not expected to soft open in 2018, while the revamp in Bali Nirwana Resort won’t take place until 2016. Any holdup, in particular for toll road construction may spillover to project delay in Lido.
Valuation Assessment and Methodology
www.samuel.co.id Page 7 of 7
Yr-end Dec (Rp bn) 14A 15E 16E 17E Yr-end Dec (Rp bn) 14A 15E 16E 17E
Revenue 1,013 1,114 1,235 1,370 Net income 385 498 296 353
COGS 530 553 588 624 Depreciation & amort. 154 156 158 160
Gross profit 483 561 647 745 Others 761 0 0 0
Gross margin (%) 47.7 50.3 52.4 54.4 Working capital (1,179) (2) (28) (131)
Operating profit 207 257 310 372 Operating cash flow 121 652 426 382
Operating margin (%) 20.4 23.1 25.1 27.1 Net - Capital expenditure (2,555) (202) (185) (160)
EBITDA 361 413 468 532 Investing cash flow (2,050) (224) (190) (166)
EBITDA margin (%) 35.6 37.1 37.9 38.8 Net - Borrowings 616 (164) (18) (119)
Other income (expenses) 236 305 60 67 Other financing 1,491 (128) (96) (67)
Pre-tax profit 442 562 370 438 Financing cash flow 2,107 (292) (114) (186)
Income tax - net (23) (28) (34) (41) Net - Cash flow 178 136 121 30
Net profit 385 498 296 353 Cash at beginning 92 271 407 528
Net profit margin (%) 38.0 44.7 23.9 25.8 Cash at ending 271 407 528 558
Yr-end Dec (Rp bn) 14A 15E 16E 17E Yr-end Dec 14A 15E 16E 17E
Cash & ST Investment 271 407 528 558 ROE (%) 5.0 6.1 3.5 4.1
Receivables 94 103 115 127 ROA (%) 3.9 4.8 2.8 3.3
Inventories 943 932 921 910 Revenue Growth (%) 72.3 10.0 10.8 10.9
Others 194 273 303 336 EBITDA Growth (%) 35.6 37.1 37.9 38.8
Total current assets 1,502 1,715 1,866 1,931 EPS Growth (%) 54.7 15.8 -40.6 19.6
Net investment properties 1,479 1,548 1,615 1,682 Interest Coverage (x) 4.3 5.0 6.1 8.1
Net fixed assets 3,126 3,022 2,917 2,811 Debt to Equity (%) 18.7 15.7 15.2 13.3
Other assets 33 55 60 66 Net gearing (%) 0.15 0.1 0.1 0.1
Total assets 9,965 10,273 10,536 10,691
Payables 77 85 105 108
ST. debt and curr. maturity 156 9 111 84
Advance from customers 151 230 274 237 Yr-end Dec 14A 15E 16E 17E
Other current liabilities 155 171 189 210 GDP growth (%) 5.0 5.1 5.5 6.0
LT. debt 1,293 1,275 1,156 1,063 CPI (%) 6.3 5.5 5.3 5.4
Other long term liabilities 113 76 93 94 USDIDR 11,900 12,900 12,500 12,200
Total liabilities 1,946 1,846 1,928 1,797
Total equity 7,763 8,171 8,353 8,639
Profit and Loss Cash Flow
Balance Sheet Key Ratios