Proceedings of the 7th National Radar Seminar And International Conference On
Radar, Antenna, Microwave, Electronics And Telecommunications (ICRAMET) 2013
“Developing Regional and International Scientific Cooperations”
Editor
Mashury Wahab
Yadi Radiansah
Technical Editor
Arief Nur Rahman
Octa Heriana
Hana Arisesa
Taufiqqurrachman
Arief Budi santiko
Layout and Cover
Dicky Desmunandar
ISSN : 1979-2921
Published by :
Research Center for Electronics and Telecommunication
Indonesian Institute of Sciences
Kampus LIPI Jl. Sangkuriang Bandung 40135
Phone : +62 22 2504660
Fax : +62 22 2504659
COMMITTEE
Advisory Chair
Prof. Dr. Lukman Hakim, LIPI Chairman Prof. Dr. Akhmaloka, ITB Rector
Prof. Dr. Leo P. Ligthart, IRCTR-I
Steering Committee Syahrul Aiman, LIPI Hiskia Sirait, LIPI
Josaphat Tetuko S.S., Chiba Univ. Raja Syamsul Azmir A., UPM Malaysia Eko Tjipto Raharjo, UI
Fitri Yuli, UI
Mashury Wahab, LIPI Yuyu Wahyu, LIPI Goib Wiranto, LIPI Purwoko Adhi, LIPI Syamsu Ismail, LIPI Rr. Widhya Yusi S, LIPI
Arwin D.W. Sumari, MABES AU Eko Setijadi, ITS
Achmad Mauludiyanto, ITS Suwadi, ITS
Andriyan B. Suksmono, ITB Nana Rachmana, ITB Adit Kurniawan, ITB Sholeh Hadi P, UNIBRAW A. Andaya Lestari, IRCTR-I Endon Bharata, IRCTR-I Edy Siradj, Balitbang Kemhan Hammam Riza, BPPT
Technical Program Committee
Chairman Yadi Radiansah
Vice Chairman Zaenul Arifin
Secretariat Lisdiani Poppy Sumarni Noorfiya Umniyati
Finance Division Wawat Karwati Zaenul Arifin
Program Division I Dewa Putu Hermida Dadin Mahmudin Emil Kristanti Novita Dwi Susanti
Publication Division Arief Nur Rahman Dicky Desmunandar Hana Arisesa Octa Heriana Fajri Darwis Taufiqqurrachman Arief Budi Santiko
Documentation & Exhibition Division Endang Ridwan
Nani Haryati Eko Joni P Patricius Sriyono
Equipment & Transportation Division Anna Kristina T
PREFACE
Dear colleagues,
On behalf of the Chairman Organizing Committee of The 7th National Radar Seminar and the 2nd International Conference on Radar, Antenna, Microwave, Electronics and Telecommunications (ICRAMET) 2013, I would like to thank to all the participants for their participation during the Seminar and Conference that was hold in Surabaya on March 27th & 28th, 2013.
I would like to specifically express my gratitude to the Chairman of Indonesian Institute of Sciences (LIPI) Prof Dr. Lukman Hakim, who was officially opened the Seminar and Conference. To the distinguished speakers : Mr. Hari Purwanto, he is the advisor to the Defense and Security of The State Ministry of Research and Technology, Republic of Indonesia; to Mr. Asif Q Moosa (Director Business Development and Strategy), Northrop Grumman Corporation Electronic System, ISR Systems Division, USA; to Prof. Josaphat Tetuko Sri Sumantyo Ph.D, he is from Center for Environmental Remote Sensing, Chiba University, Japan; to Dr. Andaya Lestari, from International Research Centre for Telecommunications and Radar-Indonesia and to Dr. Wolfgang-Martin Boerner, he is the director UIC-ECE Communications, Sensing & Navigation Laboratory, Chicago, USA.
This proceeding consists of 32 scientific papers. Some of these papers were presented as oral presentations and the rests were presented as poster presentations. This Seminar and Conference would not be hold successfully without contribution of the Speakers, the Authors, the Advisory Committees and the members of the Organizing Committees. Therefore, I would like to take this opportunity to express my sincere appreciation to all of them for their active participation in The 7th National Radar Seminar and the 2nd International Conference on Radar, Antenna, Microwave, Electronics and Telecommunications (ICRAMET) 2013.
Bandung, 23 April, 2013
Chairman of the Organizing Committee
List of Papers
1. Tracking System for Monitoring Transjakarta Bus using RFID (Samudra, Yaya Suryana, Rona Regen and Hendy Nurjaya) ... 1
2. Design and Realization of Microstrip Band Pass Filter with Interdigital Structure At 3400-3600 Mhz for LTE Application (Nori Afrianto, Saleh Dwi Mardiyanto and Yuyu Wahyu) ... 7
3. Collinear Array Antenna Operates At A Frequency 900 MHz With Ldf (Low Density Foam) Coaxial Cable (Topik Teguh Estu, Sulistyaningsih and Sri Hardiati)... 10
4. Co-Channel Interference in Broadband Satellite Communication Systems (Syahfrizal Tahcfulloh)... 14
5. Meteor Wind Radar Application for the study the dynamics of the behavior of neutral winds (Mesosfer) above Kototabang and Biak station (Effendy) ... 17
6. Performance Analyzes of Video on Demand Over IP Multimedia Subsystem On Wired and Wireless Access Network (Indrarini Dyah Irawati and Ratna Mayasari) ... 25
7. Array Planar Antenna Using Thick Film on Alumina Substrate for X band Radar (Yuyu Wahyu, Yussi Perdana Saputera and I Dewa Putu Hermida) ... 30
8. Spiral Antenna for Electronic Support Measures (ESM) Applications 2-18 GHz (Yussi Perdana Saputera,Yuyu Wahyu, Mashury Wahab and Folin Oktafiani)... 35
9. Double Bow-Tie Antenna Tringular Slot For TV Broadcasting Applications (Sulistyaningsih, Topik Teguh Estu and Sri Hardiati)... 40
10. Irrawaddy Dolphin Monitoring Using SSBL System in Mahakam River (Donny Fahrochi, Idris Mandang, Harumi Sugimatsu, Bohari Yusuf, Arya Misbahul, Ashadi Arifin Nur, Ansorullah Jamal, Tamaki Ura, Junichi Kojima and Tomohiro Kawabata) ... 44
11. Design and Development of polarimetric SAR System for Light Surveillance Aircraft - LAPAN (Musyarofah, Rahmat Arief and Ayom Widipaminto) ... 47
12. Softswitch Network Elements to Support Next Generation Networks (Subekti Ari Santoso, Pramuditoruni Gitomojati and Suci Rahmatia) ... 52
13. Extraction Methods for EEG-P300 Signals Performance Improvement and Its Application for BCI (Arjon Turnip, Demi Soetraprawata and Hanif Fakhrurroja) ... 56
14. SAR Raw Data Compression based on Compressive Sensing (Rahmat Arief, Musyarofah and Kalamullah Ramli) ... 61
15. Miniaturization Design of Horn Antenna Metal Rods Addition Technique for S-Band Applications (Fitri Yuli Zulkifli, Muhammad Ichsan, Basari, Eko Tjipto Rahardjo) ... 67
17. RF Power amplifier Using LDMOS Transistors Technology Components for Digital TV Broadcasting Application (Pamungkas Daud, Suhana Hermana and Dadin Mahmudin) ... 73
18. Design of Comb-Line Band-Pass-Filters Using Rod Rectangular Shaped Resonators for Surveillance Radar (Folin oktafiani, Pamungkas Daud and Dadin Mahmudin) ... 76
19. Characterization Of Dyes Sensitized Solar Cell (DSSC) which used TiO2 Scattering Layer (Lilis
Retnaningsih, Lia Muliani and Goib Wiranto) ... 80
20. Photonic Beam-Former Based on Micro-Ring Resonators for Phased Array Antennas in Radar Applications (Dadin Mahmudin, Yudi Yuliyus, Folin O, Pamungkas Daud and Yusuf NW) ... 84
21. Simulation and Design of compact X-Band Bandpass Filter using Microstrip Stub Resonator with Band Notch Structures (Hana Arisesa, Taufiqqurrachman and Novita Dwi Susanti) ... 86
22. Research and Development on RF Head and Baseband Processing of Electronic Support Measures (ESM) (Mashury Wahab, Daday Rudiyat, Arief Budi Santiko and Novita Dwi Susanti) ... 90
23. Bandwidth and Gain Enhancement Of Proximity Coupled Microstrip Antenna Using Side Parasitic Patch (Taufal Hidayat, Fitri Yuli Zulkifli, Basari and Eko Tjipto Rahardjo) ... 95
24. Nonlinear Indepencent Component Analysis for P300 Component (Arjon Turnip, Aris munandar and Hilman Syaeful Alam) ... 99
25. Design and Implementation of 2-Way Wilkinson Power Divider at 4.928GHz Frequency for Radar
System (Taufiqqurrachman and Arief Nur Rahman) ... 104
26. Process Design of Interconnected Grid Z-type Dye Solar Cell Sub-Modules (Lia Muliani and Jojo
Hidayat) ... 109
27. Design of Web Based Radars Data Integration System (Octa Heriana and Arief Nur Rahman) ... 113
28. Security System for Surveillance Radar Network Communication (Nova Hadi Lestriandoko and
Tutun Juhana) ... 116
29. Comparison of Radar Data Compression Tools for Indonesian Surveillance Radar (ISRA) (Nuryani
and Hendrawan) ... 122
30. Design and Fabrication of Compact Ultra-Wideband (UWB) Bandpass Filter for C-Band Application
(Taufiqqurrachman and Fajri Darwis) ... 127
31. Design of Circular Patch Microstrip Antenna with Rugby Ball Slot for Ultra Wideband Applications
(Rudy Yuwono and Prilla Wendaria) ... 130
Tracking System for Monitoring Transjakarta Bus
using RFID
Samudra1 Yaya Suryana1,2 Rona Regen1 Hendy Nurjaya1
1 Department of Electrical Engineering, Faculty of Science and Technology
University Al Azhar Indonesia
2 BPPT
Email :
[email protected], [email protected], [email protected], [email protected]
Abstract— RFID (Radio Frequency Identification) is an identification system using radio waves. In this research, RFID was built to detect the presence of transjakarta bus in each bus station. This RFID was designed using an AVR ATMega 16 as a microcontroller, YS1020UA as a reader and YS-CS20S RF as a data transceiver. ATMega 16 microcontroller is a chip where ID data tag is stored. ID data from microcontroller is transmitted by YS-C20S RF data transceiver and received by YS1020UA. The data then sent to local computer at the bus station through RS232 serial communication. Data from local computer will be saved in the database at the server computer. The database can be accessed by another computer in each bus station. The performance evaluation of wireless serial communication between YS-C20S and YS1020UA can be obtained by changing the range of transmission from 5 meter, 15 meter, 20 meter, 30 meter, and 35 meter. The user interface application is designed using Microsoft Visual Basic 6. The experimental result showed that the optimal transmission range is for the distace less than 30 meter. The optimal baud rate for speed and less bit error in serial communication between tag, reader and pc is 9600 bps.
Keywords : RFID, bus way, bus station, data base, ATMEga16, YS1020UA, YS-C20S RF data transceiver.
I. INTRODUCTION
Radio-frequency identification (RFID) is a technology that uses radio waves to transfer data from an electronic tag, called RFID tag or label, attached to an object, through a reader for the purpose of identifying and tracking the object. Radio frequency identification (RFID) is a matured technology that incorporates the use of electromagnetic or electrostatic application of bulk reading enables an almost-parallel reading of tags. This small type is incorporated in consumer products, and even implanted in pets, for identification. RFID has come
into increasing use in industry as an alternative to the bar code. The advantage of RFID is that it does not require direct contact or line-of-sight scanning. An RFID system consists of three components: an antenna and transceiver (often combined into one reader) and a transponder (the tag). The antenna uses radio frequency waves to transmit a signal that activates the transponder. When being activated, the tag transmits data back to the antenna. The data is used to notify a programmable logic controller that an action should be done. The action could be as simple as raising an access gate or as complicated as interfacing with a database to carry out a monetary transaction. Low-frequency RFID systems (30 KHz to 500 KHz) have short transmission ranges (generally less than six feet). High-frequency RFID systems (850 MHz to 950 MHz and 2.4 GHz to 2.5 GHz) offer longer transmission ranges (more than 90 feet). In general, the higher the frequency the more expensive the system.
RFID application that will be discussed on this research is transjakarta bus tracking system using RFID. The use RFID as tracking system on transjakarta busway will facilitate the transjakarta information center to find out the position of each bus transjakarta. Besides that, there are some complaints in the field suara anda [9] on the web http://www.transjakarta.co.id/ discussing about late arrival of transjakarta bus at the bus stop and length of waiting time for passenger on bus stop for arrival the bus.
Facility for transjakarta busway manager in regulating bus pass in a corridor will have an effect comfortable enhancement for the passenger, this is because the easily setting the active bus in a corridor will impact the timeliness and less waiting time for the passenger at bus stop.
RFID tag will be installed in each transjakarta bus, and RFID reader will be installed at every bus stop. Every time the bus crossed the bus stop, RFID reader at bus stop will read the unique number from RFID tag at bus as bus identity number.
will store every movement of the bus to database in server computer. Interface between reader, computer, and database is done by the application that created by using visual basic software.
Figure 1. Description of Tracking System
This research is limited on the developing of RFID system design and the interface between the RFID to a computer using Microsoft Visual Basic software and creates a database system to store data that can be accessed from another computer in a network.
1.1 Objectives
Based on the existing background, the author aims to design an RFID system for transjakarta bus and bus stop, and interface between RFID systems, computer, and database by using Microsoft Visual Basic software. The author hopes the results of this research can be used to facilitate the transjakarta busway manager on improving the service for the passenger when they wait for the bus at bus stop.
II. BASIC THEORY
In this chapter the basic theory of the final project will be discussed. The explain of microcontroller, RFID, Interface System, and Database System.
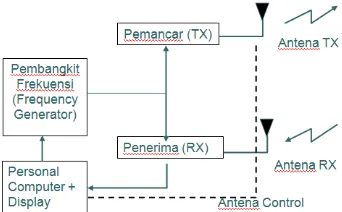
2.1 Radio Communication
Radio communication is wireless communication that use radio frequency as carrier frequency. Working principle of radio communication is described by figure 2 below
Figure 2. Radio Communication System
Information or data transmission in radio communication is done using modulation method, which is sending data by using a carrier frequency. Figure 3 below is represent Amplitude Modulation (AM) and Frequency Modulation (FM).
Figure 3. AM and FM Signal Modulation 2.2 RFID
RFID or Radio frequency identification represents a way of identifying object or people using radio waves. Identification is possible by means of unique numbers that identify object, people, and information stored on microchip [2].
The history of RFID is beginning at 1945 when Leon Theremin invented a spy tools for Uni Soviet that can be retransmitted voice information with radio frequency [7].Even though this device was a covert listening device, not an identification tag, it is considered to be a predecessor of RFID technology.
RFID is mostly used in security application, for example a smartcard that used as a key to access entrance a room. Only certain people who have a smartcard that is allowed to enter the room. RFID system is comprised of two main components, that is RFID Tag, and RFID reader.
2.2.1 Working principles of RFID
The basic principle of RFID system is to transfer stored data from a tag to a reader across a wireless air interface, and the media used is radio frequency. The data received by reader will be forwarded to computer to go to next process. Working principle of RFID system in this research is describe by figure 4 below
Figure 4. RFID System
2.3 Serial Communication.
communications with parallel communication is shown as figure 5 below.
Figure 5. Serial and parallel communication principle
Serial port on computer is DB9. Serial data communication is done by using DB9 serial port. By using this port information can be sent from or to computer. DB9 serial port has 9 pins that have a different function on each pin. Pin configuration of DB9 port serial as shown by figure 2.17 below:
Figure 6. Pin configuration of DB9 serial port [3]
2.4 RF Data Transceiver
To be able sending data serial over the air, needed a device that can make the process of laying a digital data to the carrier frequency with high frequency, and then transmitted to the air. The devices that can do it are YS 1020 UA and YS-C20S.
2.5 Database System
Database system is one of the most important in this project, because each event will be stored to database. Database system to be used in this project is server application database that allows the database can accessed from another computer with same network.
Database application that used in this project is XAMPP software that already integrated with MySQL database server.
2.6 Visual Basic Application
In this project, visual basic application handles two things at once, there are serial interface and database connection [6].
2.6.1 Visual Basic for serial interface
The main purpose of interfacing a device with computer is as means of exchanging data between device and computer [8]. A serial communication between device and computer requires hardware connection and software connection.
Hardware connection is made by connecting the computer with YS1020UA, but to process the data received is required software connection. Software connection is made by visual basic application.
Component of visual basic that used to handle software connection is Microsoft Communication Control or called MSComm Control. Some property that can be set from this component are CommPort, DTREnable, EOFEnable, HandShaking, InBuferSize, InputMode, OutBufferSize, RThreshold, SHreshold, Settings, Input, Output.
2.6.2 Visual Basic for database connection
Visual basic has component that used to setting database connection, which is Microsoft Active Data Object Data
ConnectionString, that is string that contain information about database to be accessed. ConectionString containing, server address, database name, user name, password user, and provider of database.
Recordset. That is a variable whivh used to store data in column and row. This object is similar with array/matriks but is devoted to database.
Query String, which is a string which containing access transaction commands. Language program that used in database programming is Structured Query Language (SQL).
Table, that is an object contained in database which the function is save data in column and row.
III. METHOD
Literature review aims to collect data which related with RFID system for bus tracking system such as collecting basic theory of the component used, electronics and software, minimum system of AVR ATMega16 microcontroller, YS1020UA and YS-C20S RF data transceiver, and LM7805 voltage regulator, serial communication, database application, and visual basic application.
IV. DESIGN, IMPLEMENTATION, AND ANALYSIS
Figure 7. System Overview
Each bus will be installed a tag that have a unique number as ID [4]. Every time a bus passes a bus stop, tag on bus will send data ID information to the reader that has been installed at every bus stop. Data read by the reader will be forwarded to computer via serial communication RS232.
Figure 8. Block Diagram System
Block diagram of RFID system is shown in figure 8 above. Data entered into computer through serial port will be processed by visual application using MSComm component, one of visual basic components which has function to handle serial communication.
Input property from MSComm will gather data from tag as bus ID, by using visual basic data can be displayed on display at bus stop. Data from MSComm will be saved to database at server computer through MS ADO data control.
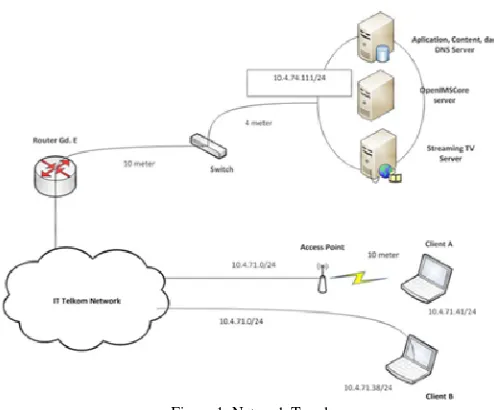
Data on the server computer will be reference for display at all bus stops to shows bus position. The system network topology is illustrated by figure 9 below :
Figure 9. System Network Topology
All of bus stop will save each data arrival bus in one database at server computer. The database at server computer can be accessed by another computer by using XAMPP software.
4.1 MYSQL as Database Server
MySQL is software that used to handle database service. database used by the system is created and managed using MySQL.
Database is collection of information stored in computer, database is usually used for record reality life data, for example the availability rooms in hotels, or other. In database there are several tables, tables is collection of data in row and columns.
Based on accessibility, database can be divided in two kinds, local database and remote database.
Local database is database in a computer and being accessed from the same computer. Different from local database, remote database is a database in a computer but being accessed from another computer.
4.2 Visual Basic Application Design
Visual basic application is used at bus stop to display preference of bus and delay time the bus to arrive at next stop.
Figure 11. Flowchart of Visual Basic Program
4.3 Testing and Analysis
The test includes hardware and software testing. Hardware testing is including minimum system of microcontroller test, serial communication test, and RF communication test. Software testing is including database connection test, interface display test, and database system. After testing of each component is done, the next step is analyzing the suitability result with expectation.
The testing process is aimed to show us whether the microcontroller, RF data transceiver, and the whole system are work properly as we expected or not.
Following are the components that will be tested:
1. AVR atmega16 [5]
2. Serial communication
3. RF data transceiver
4. MySQL database
5. Database connection with VB
6. Display bus position with VB
V. RESULTS
Target to be achieved from this test is to determine reliability from this RF data transceiver for this system. Testing is done by finding farthest distance from the RF transceiver to communicate data. Testing is conducted in two places, line of sight and non-line of sight.
Devices required on this test are:
1. DC Power supply 2. RF data transceiver
3. Minimum system microcontroller AtMega16 4. Computer
5. Visual basic or HyperTerminal software Table 4.2. Distance testing result
Distance (meter) LOS N-Los Moved
5 √ √ √
10 √ √ √
15 √ x x
20 √ x x
25 √ x x
30 √ x x
35 x x x
Based on the result, it can be concluded that the specification of RF data transceiver is qualified for used in this project. RF data transceiver required in this project is RF data transceiver with less range area to keep the accuracy of estimated bus arrival time.
5.1 Database connection using VB
Visual basic is an application that compatible to make database connection, database that be created using MySql. Visual basic needs some object to connect the database. The components are described in chapter 2. Target of this test is to determine the reliability of visual basic to access database from another computer using IP address.
Devices required in this test are:
1. Server computer 2. Computer client
3. AppServ or XAMPP software 4. Visual basic software 5. ODBC driver
Figure 12. Block diagram VB to database connection
5.2 Display bus position with VB
Presence of the bus will displayed at each bus stop display, the display shows the positions of the bus and predicted arrival time to next stop. Target of this test is the display system can work properly according to the presence of bus on database.
Figure 13. Display Arrival Bus
Figure 14. Display Departure Bus
Based on figure 13 and figure 14 above, it is shown that the display system can work properly. Arrival and departure of the bus will be recorded to database, and the display system will displayed preference and time prediction based on database.
VI. CONCLUSIONSANDFUTUREWORK
6.1 Conclusions
The experimental result showed that the optimal transmission range is for the distance less than 30 meter. The optimal baud rate for speed and less bit error in serial communication between tag, reader and pc is 9600 bps. Also it was found that the optimal transmission and reception of 8
byte data asynchronously is 0,045 second. Finally, the user interface application designed using Microsoft Visual Basic 6 is effectively connected the database between server and client.
6.2 Future Work
For further development of transjakarta bus tracking system using RFID, it is needed to test this system on the field directly. This project need to be improved, especially in some features as follow : this system can be combined with GPS system, so that the system can read the movement of the bus in more detail (countdown a minutes or second for each station); driver on the bus can send the information to the data center about what happening on the way.
ACKNOWLEDGMENT
Thank you for my mother, father, and sister. University Al Azhar Indonesia, Electrical Engineering Department, Mr. Yaya Suryana, Ph.D, Rona Regen, Hendy Nurjaya and other friends.
REFERENCES
[1] Chiagozie, G. Ononiwa, Nwaji, G. Okorafor. 2012. “Radio Frequency Identification (RFID) Based Attendance System with Automatic Door Unit”. Nigeria: Academic Research International.
[2] Lehpamer, Harvey. 2008. “RFID Design Principles”. Norwood: Artech House.
[3] Munawar, Aris. 2007. “Pengembangan Sistem Layanan Informasi dan Sistem Pengingat Jadwal otomatis Menggunakan Modul GSM”. Jakarta: Universitas Al Azhar Indonesia.
[4] Anugrah, Rofanaharto. 2008. “Sistem Pelacak Bus Kampus dengan Menggunakan Modul DT-51 LCMS dan Wireless YS 1020 RF Data Transceiver”. Depok: Universitas Indonesia
[5] Mulyana, Reza. 2010. “Early Warning System For Monitoring DLC Using SIM300 GSM Modules and ATMega8535 Microcontroller For PT. Telkom Tbk Kandatel NAD”. Jakarta: Universitas Al Azhar Indonesia.
[6] http://msdn.microsoft.com/en-us/library/hh127540.
“Visual Basic Property”, 23th August 2012.
[7] http://www.rfidjournal.com/article/view/1338. “The
History of RFID Technology”. 29th June 2012.
[8]
http://technologination.blogspot.com/2011/06/tutorial-menampilkan-data-dari-port.html. “Interface
Microcontroller and Computer with Visual Basic”. 30th June 2012.
[9] http://www.transjakarta.co.id/suara.php. “Suara Anda”.
29th August 2012.
DISSCUSSION
Hana Arisesa : The problem of RFID application is about the distance, how could you solve that? Why the most effective range is 10 meter?
Design and Realization of Microstrip Band Pass Filter
with Interdigital Structure At 3400-3600 Mhz
for LTE Application
Nori Afrianto1, Saleh Dwi Mardiyanto1, and Yuyu Wahyu2
1 Faculty of Electrical and Communication, Telkom Institute of Technology, Bandung, Indonesia
[email protected], [email protected]
2Electronics and Telecommunication Research Centre (PPET), LIPI, Bandung, Indonesia
Abstract—Long Term Evolution (LTE) is an advanced standard of wireless communication for mobile phones and data terminals. In this paper, a design and realization of a Band Passs Filter (BPF) at one of LTE frequency band, namely band 42 at 3.400 MHz-3.600 MHz will be presented.
The BPF was designed as a Chebyshev response filter based on microstrip with interdigital structure. Measurement results of this BPF are as follows; insertion loss at centre frequency 13.763 dB, VSWR > 1.196 at frequency range, return loss 14.292 dB, terminal impedance 59.242 + j30.387 (input) 52.386 – j21.372 (output). Hence, the results of VSWR, bandwidth, and return loss had fulfilled the specifitation required, while insertion loss and terminal impedance had not.
Keywords — Band Pass Filter; Microstrip; Interdigital structure; LTE frequency band
I. INTRODUCTION
As an advanced standard for wireless communication of high-speed data for mobile phones and data terminals with data rate of 100 Mbit/s for downlink and 50 Mbit/s uplink, Long Term Evolution (LTE) requires a wideband filter and has many proposed frequency bands. This paper designed and realized a Band Passs Filter (BPF) at one of LTE frequency band, namely band 42 at 3.400 MHz-3.600 MHz used in United Kingdom.
Filter design was done firstly with dimension calculations, and then AWR 2008 software was used for optimization. Filter fabrication was done by photoetching process. After realization, filter was tested using a Network Analyzer.
II. MICROSTRIPFILTERWITHINTERDIGITAL STRUCTURE
A. Band Pass Filter[1]
A BPF is a filter that passes signals in between two cut-off frequencies and rejects (attenuates) frequencies outside that range. The Chevyshev polynomial is expressed as:
A mathematical approach in designing a Chebyshev response for insertion loss is defined in the following equation.
IL1am2Tn2
' where am is ripple factor, n is filter order.
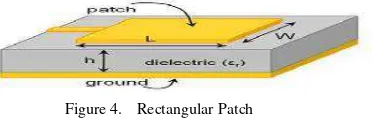
B. Microstrip with Interdigital Structure [2]
Figure 1. A Microstrip
A microstrip line consists of a single dielectric substrat with a ground plane and a strip with width W. The dielectric substrat
defines the relative dielectric contstant (r) and tan .
A microstrip band pass filter has many resonator structures, namely combline, interdigital, end-coupled, parallel-coupled, hairpin, and etc. In this paper interdigital structure was used.
Figure 2. A Wideband Interdigital Structure
The microstrip transmission characteristic parameters are effective dielectric constant εeff and characteristic impedance
Resonator length (L) and physical length (Lt) were defined as:
The band pass filter has a specification as follows:
Band Frequency 3.400MHz – 3.600MHz
Filter type : Chebyshev, ripple 0.1 dB
For dielectric material, substrat Roger4003C was chosen for it has a small loss in high frequency. The substrat has the following specifications : FR4 Epoxy, = 0.894999≤ 2, so theoritically the line width was 1.4767mm.
From (7) and (8), tap width (Wo) was calculated. equals 1.913350, or Wo = 3.157mm.
4) Resonator Length (L) and Physical Length (Lt)
Resonator length was defined in (9), where r was
calculated from(3). So the resonator length was 12,07 mm. From (10) physical length was 9,13 mm.
B. PCB Layout
After calculations, filter design was optimized in AWR software and then drawn in PCB layout.
matching between ports. While the pass band was already 200 Mhz at 3500 – 3600 MHz.
B. Return Loss
Figure 6. Return Loss
Return loss was measured 14.292 dB. This already fulfilled the required specification.
C. VSWR
Figure 7. VSWR
The VSWR measured was 1.196 at centre frequency, and 1.106 at cutoff frequency. This already fulfilled the required specification.
D. Terminal Impedance
Figure 8. Input Impedance
Figure 9. Output Impedance
Input impedance was measured 59.242 + j30.387 Ohm and output impedance 52.386 – j21.372 Ohm. This measurement was not so close to the required impedance 50 Ohm. This could be caused by bad soldering of connectors.
CONCLUSION
The Band Pass Filter realized was not perfect yet and needs improvement. Some of the parameters fulfilled the requirements and some did not. The measurement results of VSWR, bandwidth, and return loss had fulfilled the specifitation required, while insertion loss and terminal impedance had not.
REFERENCES
[1] Bowick, Christ, “RF Circuit Design,” Newnes Elsevier Science, UK, 1982
[2] Hong, Jia-Sheng, M. J. Lancaster, “Microstrip Filters for RF/Microwave Applications,” New York: A Wiley Interscience Publication, 2001 [3] Seviana, Rahma Pratami, “Perancangan dan Realisasi Bandpass Filter
Pada Frekuensi 5925MHz - 6425MHz Berbasis Mikrostrip,” Laporan Proyek Akhir, Program Studi D3 Teknik Telekomunikasi, IT Telkom Bandung, 2011.
[4] Sulaiman, Enceng, “Diktat kuliah : Filter,” Bandung. 2009
[5] http://www.radio-electronics.com/info/cellulartelecomms/lte-long-term-evolution/lte-frequency-spectrum.php (4 January 2012)
[6] http://www.dailywireless.org/2012/03/05/uk-broadband-td-lte-at-3-5ghz/, 2 July 2012
[7] http://www.ukbroadband.com/about-us/press-releases/press-release-1, 3 July 2012
[8] http://arhyblog.blogspot.com/2010/06/filter-gelombang-mikro.html, 4 July 2012
DISSCUSSION
Collinear Array Antenna Operates at a Frequency 900
MHz With LDF (Low Density Foam) Coaxial Cable
Topik Teguh Estu, Sulistyaningsih, and Sri Hardiati
Research Centre For Electronics And Telecommunication – Indonesian Institute Of Sciences Kampus LIPI Gd. 20 Lt. 4 Jl. Sangkuriang Bandung 40135, Indonesia
E-mail: [email protected]
Abstract— This paper discusses the design and realization of Collinear Array Antenna made from LDF coaxial cable that will be applied for GSM (Global System Mobile). This collinier antenna operates at a frequency of 870 MHz - 960 MHz, which is
a type of λ / 2 dipole antenna and made of LDF coaxial cable
and the cable containing a corugated cooper. Collinier antenna
contains an array of a λ/2 dipole antenna by the number of 21
pieces. The measurement results obtained from the realization of the antenna is follow 11 dB gain ,1.3 dB VSWR and omnidirectional radiation pattern. From these results estimated collinier antenna can be applied to GSM mounted on the BTS (Base T ransceiver Station)
Keywords: Omnidirectional antenna, collinear array, GSM antenna.
I. INTRODUCTION
Antenna is a very important part in the communication system, coupling energy between the transmitter or receiver and propagation media. In recent years , the field of mobile communication technologies is develop with rapidly, thus mobile communication networks, such as the Global System for mobile communications is increasing, this growth is apparent in developing countries. BTS (Base Transceiver Systems) is a transceiver radio link to handle relations with the Mobile Station (MS) requires an antenna with a requirement that can be used on the developing network systems. Therefore, this paper discusses the research of collinear array antenna, where the antenna is planned to have an omni-directional radiation pattern is expected to meet and follow of the network development for the purpose of GSM Base Stations.
Collinear array antenna designed for GSM to operate in frequency range of 870 MHz to 960 MHz with an omni-directional radiation pattern, where the antenna consists of an array of λ / 2 dipole antenna with the same length, and these made are parallel so as to form a long line and each the λ / 2 dipole antenna that one another properly connected. A collinear array antenna is usually mounted vertically and the λ/2 dipole antenna elements are added by means stacked one
on top of another antenna, so that the gain and directivity are increased in the horizontal plane.
This antenna is designed with more of one λ /2 dipole antenna with number of 21 elements reaches a value of gain > 10 dB and those collinear antenna was placed in radome. The measuring results of collinear array antennas are estimated to be applicable on the BTS.
II. METHODOLOGY
A. Dipole antenna
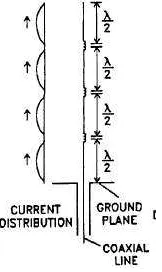
Dipole antenna consists of two terminals or poles where the antenna is the most widely used as a base antenna. The basic form of a dipole antenna in the form of the single-wire or λ/2 conductor pipe and it is fed on the symmetrically center point where the maximum current value Distribution along the dipole is sinusoidal roughly , eventually to zero. This current causes the related voltage and the electromagnetic signals or the radio signal to be emitted.
Single dipole antenna is a resonant antenna having a total length of the carrier frequency. Single dipole antenna also called half-wave dipole antenna. Single dipole antenna is a dipole antenna type that is often used, because it is more efficient. The λ / 2 dipole antenna [1] is shown in Figure 1:
Figure 1 : λ / 2 dipole antenna
The shape of the radiation pattern of a dipole antenna is bi-directional or 2 direction are perpendicular to the plane of the antenna (broadside direction).
connected is called two-wire folded dipole. And dipole antenna consists 3 wires that spliced ends called three wire folded dipole. In this the dipole antenna design using a single wire dipole antenna with a LDF coaxial cable, which is the dipole antenna length theoretically can not yet directly used because of environmental factors at each location is different.
B. Radiation Pattern and Gain of Antenna
The antenna emits radio signals progressively, where farther the antenna from the receiver, become weaker the signal received by the receiver. The weakening of the radio signal emission of antenna is inversely proportional to the square of the distance. Another characteristic of the antenna is that the power is emitted in different directions tend to be the same. Radio emission by a vertical antenna has the same strength in all directions of the wind, the emission of this kind is called omni-directional. So, the omni-directional antenna is an antenna that has a uniform radiation pattern
Gain (directive gain) of an antenna is an antenna cables, and collinear oriented parallel to each other, with little gap in the center of that two conductor. Collinear antenna contains a row dipole antenna, theoretically the antenna length [4] can be calculated using equation 1:
0 conductor is a cable core that made of hard copper coated with insulators, a second conductor coats the outside of the first insulator and enclosed by outer insulator. Coaxial cable as shown in Figure 2, which consists of a center core, a layer of plastic (dielectric insulator) surrounding the copper as function separation between the copper and metal, which this metal as barrier from outside interference.
The most outer layer is a layer of plastic called plastic Jacket that function as a protective of outer part.
Figure 2. Coaxial cable field. Additionally coaxial cable has a smaller flow resistance at higher frequencies. Propagation of electromagnetic energy confined in the pipes, and insulated from the effects of interference. The coaxial cables types such as RG, LDF, which in this experiment, the collinear antenna is made with using the LDF coaxial cable types.
III. ANTENNA DESIGN
Requirements for an antenna needed in the development of the progressive network, especially when used as part of a communication system, the antenna should ideally defining the radiation pattern characteristics is strictly for network planning, because the radiation inter-modulation level and also polarization are coming from the various operators. Collinear array antenna are based of the dipole antenna that is design and made from corrugated coaxial cable, where the specifications of the antenna is intended to be applied in accordance with BTS standard which is described in [3]
Illustration of the collinear antenna is made from a train of sections coaxial cable are it consists of the outer and inner conductors , and transposition at each intersection, as shown in Figure 3.
Polarization : linier vertikal
Impedance : 50 Ω
Antenna dimension : 5 cm
Length : 3 m
Cabel : LDF4
Figure 3. Illustration of collinear array antenna
The material are used in this research are the LDF (Low Density Foam) Coaxial Cable. Outer conductor of the cable is made of a copper type, while inner conductor is a copper-coated aluminum wire. Dielectric materials are Polyethylene foam. This cable has an impedance of 50 Ohm and can operate at a frequency of 1-8800 MHz. Average power at a frequency of 890MHz - 960 MHz is 1 K watt.
Figure 4. Electrical schematic of the collinear array antenna.
Figure 4 shows the schematic of a half-wave of the dipole antenna, which is connected to an unbalanced coaxial cable .In order to make easier for a balance that in manner connecting the antenna to the balun.
IV. RESULT AND DISCUSSION
The realization of a Collinear array antenna design is shown in Figure 5. As a protector of antenna, the antenna equipped with Radome is made of PVC with a diameter of 1.5 inch and thick of 5mm.
Figure 5. Collinear array antenna
To determine the antenna performance, then the antenna measurements is performed by means, the antenna included in a radome and the measurement results can be shown in A, B, C and D.
A. Impedance Measurement
Figure 6 shows the results of impedance measurements of a collinear array antenna, that at frequency of 900 MHz , the impedance value of 43.088 Ohm is obtained
Figure 6. Impedance Measurement Results
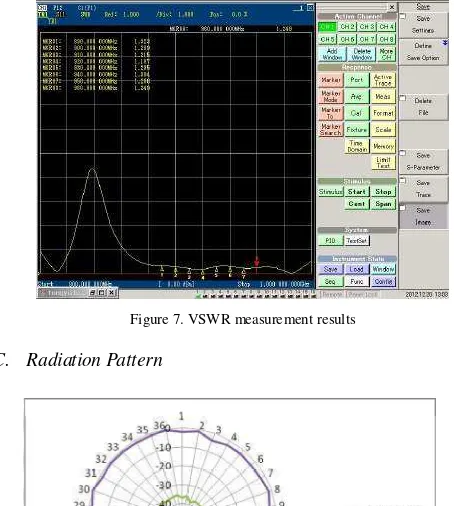
B. VSWR Measurements
Figure 7. VSWR measurement results
C. Radiation Pattern
Figure 8. Antenna radiation pattern
Figure 8 shows the radiation pattern of the antenna, where the measurement results shows omni directional radiation pattern.
D. Antenna Gain
Measuring gain of the antenna is performed using a Vector Signal Generator (VSG) and Spectrum Analyzer (SA). In this measurement, we have to use the cable as a feeder in good condition, so that the measurement results can be more precise and accurate. Table 1 shows the parameters of a reference antenna with the antenna being measured
TABLE I. GAIN MEASUREMENT
Antenna Type Frequency (MHz)
Measurement Level (dBm)
Gain (dB) Antenna reference 900 -48.1 11
Antenna Under Test 900 -48.6 10.5
The Impedance measurements results of the Collinear Array antenna that consists of a array of λ/2 dipole are estimated to be used with good, although the results are not 50 Ω , this causes that the VSWR have been meet the desired specifications. In this the measurement, the position of the antenna is mounted vertically accordance with actual installation, thus increasing the gain, while having a wide band width. The radiation pattern results of that the antenna is omni-directional, so that antenna is compliance for used at the base station of the mobile network, which that the antenna for base station should has be omni-directional radiation pattern , in order to provide equal opportunities for the users in large area
V. CONCLUSION
From these the measurement results, then the value of the gain, VSWR, impedance and radiation pattern of the antenna is obtained according to initial antenna design that applied to the BTS. And to know the direction of the electric field radiated by the collinear array antenna, then will be performed in future research about polarization of this the collinear antenna
REFERENCES
[1] Constantine A. Balanis, “Antenna Theory Analysis and Design”, John Wiley &Sons, INC, 1997.
[2] Dipl.Ing. Peter Scholz, “ Basic Antenna Principles for Mobile Communications”, Kathrein- Werke KG ROsenheim.
[3] Joel N. Holyoak, Ph.D, Geza Dienes, and Michael R. Wolfe Andrew C, “ Base Transceiver station Antenna “ ,Broadband Wireless Access Working Group, IEEE 802.16 ,1999-10-14.
[4] Brian Oblivion and Capt.Kaboom, “ A 2.4 GHz Vertical Collinier
Antenna for 802.11 Applications”,
http://www.nodomainname.co.uk/omnicolinear/2-4 collinear.htm. [5] Mamilus Aginwa Ahaneku,Obinna Okonor, Peter Ogbuna Offor, “
Power Capacity of Transmision Lines (Case Study of Coaxial Cable) “Journal of Information Engineering and Applications, ISSN 2224-5782, Vol 2, No.7, 2012.
[6] M. Polivka and A. Holub, “ Collinear and Coparallel Principles in Antenna Design”, Departement of Electromagnetic Field, Czech Technical University in Prague, Czech Republic, Progress In Electromagnetics Research Symposium 2007, Prague, Czech Republic, August 27-30.
Co-Channel Interference in Broadband Satellite
Communication Systems
Syahfrizal Tahcfulloh
Department of Electrical Engineering, Universitas Borneo Tarakan Jl. Amal Lama No.1 Tarakan, 77123, Indonesia
E-mail : [email protected]
Abstract—This paper presents the simulation results that can be used to calculate co-channel interferences, both in the downlink and in the uplink of a single satellite/space-based mobile communications system, due to the reuse of frequencies in spot beams or coverage cells. The analysis of simulation results can be applied to any type of satellite or platform elevated at ratio (CNIR) is also calculated, which exemplifies the degradation in the carrier to noise ratio (CNR) of the system. In conclusion, as expected, it is observed that the co-channel interference generally increases as we decrease the reuse number employed for the frequency reuse in the cells. It is also o b s e r v e d t h a t c o -channel interference can cause substantial degradation to the overall CNR of a system.
Keywords-co-channel interference; broadband satellite
communication system; carrier to noise ratio; carrier to interference plus noise ratio
I. INTRODUCTION
Interference is inherently detrimental to a communications system. The type of interference that a system designer should be aware of depends on the system in reference. Interference could be classified as intra-system or inter-system interference. Out of band emissions of one system, intra-system interferences that are of primary importance are intermodulation and co-channel interferences [1]. Intermodulation occurs due to the non-linear mixing of two or more different frequencies that fall within the pass band of a receiver. On the other hand, co-channel interference occurs when there are two or more simultaneous transmissions on the same channel [2]. This type of interference is inherent in any system that employs a frequency reuse methodology.
Similar to terrestrial cellular systems employing frequency reuse at two base stations that are separated by some distance, a satellite or platform based communications system can also reuse frequencies in spot beams that form coverage cells separated by some distance on earth. A system designer must be aware of such reuse and the potential for co-channel interference. If designers can calculate the co-co-channel interference, they will be equipped with one more tool to manage their link budget calculations and to optimize their designs. The software tool developed to arrive at results presented in this paper calculates the co-channel interference for a satellite or an elevated platform based telecommunications system employing frequency reuse in different spot beams. Figure 1 shows a simplistic diagram of the co-channel interferers in both the uplink and the downlink.
II. THE MODEL
A. Assumptions
independent wide-sense stationary random processes of zero means.
Figure 1. Depiction of the Satellite Uplink and Downlink Co-channel Interferers
B. Calculations
The calculation of the co-channel interference power in a receiver is crucial for a system designer. This leads to a more relevant performance measure: the overall carrier-to-noise plus interference ratio (CNIR), which includes the intermodulation interferences, respectively. The (CIR)O
may include all types of interferences that need to be calculated. The subject of our discussion in this paper is only co-channel interference. Therefore, the (CIR)O here
includes only co-channel interference as follows:
The downlink co-channel carrier-to-interference ratio
(CIR)CC-DL is primarily a function of the reuse number and of
the aggregate power due to the power in the sidelobes of interfering co-channel spot beams that is received in an earth station receiver. On the other hand, the uplink co-channel carrier-to-interference ratio (CIR)CC-UL is dependent
upon reuse number and the number of co-channel users transmitting simultaneously and received at the sidelobes of the interfered beam. In this case, we’ll assume that one user
in each co-channel cell is transmitting. The placement of these co-channel users is random.
TABLE I. PARAMETERS AND VALUES USED FOR A GEO SCENARIO
Satellite Parameters
Satellite/Platform Orbit and Altitude GEO, Altitude = 35786 km Satellite Transmit Power including Output 10.9 dBW per carrier per beam
Number of Spot Beams 127
Overlapping Coverage is at ─ 4 dB below the beam center Uplink Frequency / Downlink Frequency 1640 MHz / 1550 MHz Antenna Gain for both Uplink and Downlink 47 dBi
Receiver Noise Temperature 398 K
Atmospheric Loss 0.5 dB
Miscellaneous Losses for Uplink/Downlink 2.2 dB / 7 dB Carrier Noise Bandwidth for 50 kHz / 200 kHz
Mobile Terminal Parameters
Transmitter Output Power 0 dBW Antenna Gain (transmit and receive) ─ 4 dBi Receiver Noise Temperature 501 K User Location in the Coverage Cell ─ 3 dB contour
in Table I, the overall link is between two L-band mobile terminals via the satellite.
For the runs above the uplink and downlink carrier to noise ratios, excluding co-channel interference, are:
(CNR)DL = 13.8 dB, (CNR)UL = 18.0 dB. As can be seen from
the first three rows of Table II, for the same sidelobe level, as the reuse number increases, the overall co-channel interference power decreases since CIR increases. It is also evident that, for the same reuse number, as sidelobe level of the spot beam antenna pattern decreases, the co-channel interference also decreases. The last two rows illustrate the fact that the overall interference power is very closely approximated by interference contributions from the co-channel cells in the first co-co-channel tier
IV. CONCLUSION
As evidenced from the results obtained above, the overall Carrier to Co-Channel Interference Ratio depends mainly on the system parameters such as the frequency reuse number, the spot beam’s sidelobe level, and the number of active users and their separation from the main user. Unless the system uses antennas with very low sidelobe levels, employs less frequent frequency reuse or uses a combination of both, it will suffer from overall co-channel interference, which may become the limiting factor in the link budget analysis.
REFERENCES
[1] A.I. Zaghloul and O. Kilic, “Transmission Impairment Parameters in
Multiple-Beam Satellite Communications Systems,” URSI General
Assembly, Maastricht, the Netherlands, August 2002.
[2] United States. National Communications System Technology & Standards Division, “Telecommunications: Glossary of
Telecommunication Terms,” Federal Standard 1037C,
< http://www.its.bldrdoc.gov/fs-1037/>, August 1996.
[3] T. Pratt, C. Bostian and J. Allnutt, “Satellite Communications,” 2nd ed., pp. 128, 137-144, 2003.
[4] W. L. Stutzman and G.A. Thiele, “Antenna Theory and Design,” 2nd ed., p 320, 1998.
[5] Saurbh Chhabra, Amir I. Zaghloul, and Ozlem Kilic, “Co-Channel
Interference in Satellite-Based Cellular Communication Systems”, URSI
General Assembly, New Delhi, October 2005.
DISSCUSSION
Q : How to overcome effect of atmospheric attenuator so SNR ration can be useful and the satellite communication can still exist?
Meteor Wind Radar Application for the study the
dynamics of the behavior of neutral winds (Mesosfer)
above Kototabang and Biak station
Effendy
LAPAN, Jl. Dr.Junjunan 133, Telp: +62226012602, Fax +62226014998, Bandung, Indonesia Email : [email protected]
Abstract—Currently for meteor observation is not only done with the naked eye and optical equipment such as a telescope, the latest development to detect natural phenomena meteor shower rained almost every day the Earth can be detected using radar
output consists of 7th meteor parameter can be used to study the
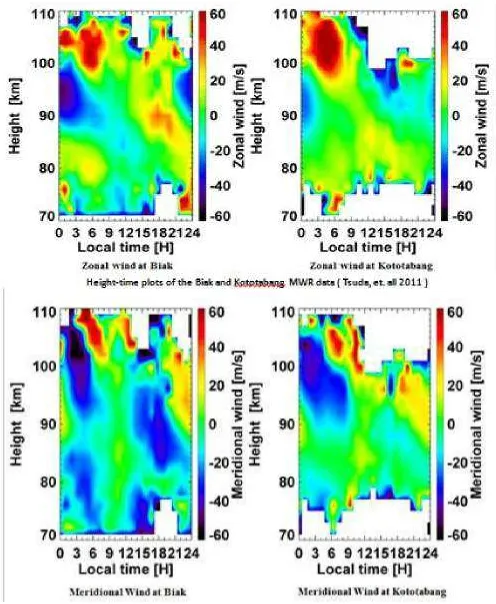
behavior of neutral winds in the Mesosphere. In this paper the utilization of SKiYMet shown to detect Wind speed Meridional and Zonal Wind speed, Temperature in the Mesosphere and the number and received Flux meteor in the Earth, as a sources of data to better understand the dynamics of the neutral winds at an altitude of 70-110 km region of observation locations. Simultaneous measurement data will be shown at Kototabang observations that have been operating since year 2006 and in Biak Station since year 2011. All of the radar installation is a collaboration between LAPAN and RISH - Kyoto, NICT Japan.
Keywords; SKiYMET radar, neutral wind, mesosphere, zonal, meridional.
I. INTRODUCTION
The meteor studies show strong connection between meteor trails and the atmosphere around the trails, which provide a better understanding of the Earth’s atmosphere, e.g. temperature, pressure, wind velocity, etc. At every moment, many meteoroids enter the Earth’s atmosphere and burn up at altitudes from approximately 120 km down to 70 km. Then the meteor trails form and expand quickly, which can be detected by radars. There are two kinds of meteor trails, underdense and overdense, defined by their electron line densities. Currently, the ambipolar diffusion is assumed to be the most significant mechanism for the underdense meteor trails expansion at Mesosphere and Lower Thermosphere (MLT). Model research deduces that there are two possible influences on the meteor trails expansion the neutral or positively charged background dust and the background atmospheric electron density variation Havnes et. all (2005) analyzed the decay time of underdense
trails, which can be affected by a part of the trail electrons being absorbed by dust as the trail expands. Later, Singer et al. (2008) tested this background dust influence for the radar backscatter from underdense meteors by comparing the weak meteor echoes with strong meteor echoes. And there were more studies about this topic, which show approximately the same results, more background dust (neutral or positively charged) will absorb the meteor trail electrons, and then decrease the meteor decay times. With the continued study of the possible influences on the meteor trails expansion, focusing on the effect of background atmospheric electron density variation. Continuous all-sky radar observations of meteors during the year 2006, in Kototabang (0.2° S, 100.3° E), West Sumatera and in the year 2011 at Biak ( 1.2° S,136.1°E) Island Papua, their provide a substantial data set for efficient investigations of meteor decay times at different location and altitudes, time of day and month of year. The meteor data have been processed to quick look for differences in decay times with the background ionization effects and its relevance for the temperature estimation from meteor trail decay times. The work for this paper includes the basic overall meteor study (meteor flux, meteor rates, meteor height distributions, etc.), the meteor decay time study, the D-region ionosphere electron density variation comparison, the atmospheric temperature estimation.
1.a) Meteors in the Atmosphere.
divided into five main layers, Troposphere, Stratosphere, Mesosphere, Thermosphere, and Exosphere. These layers are mainly determined by the vertical temperature profile. The temperature of the atmosphere has a complicated behavior by height. It starts by decreasing in the troposphere from about 290K at the ground and reaching a minimum close at 215K at 15~20 km, called the tropopause. Above the troposphere is the stratosphere, and the temperature increases again up to a maximum of close to 280K, called the stratopause (close to 50km). Above the stratosphere, the temperature decreases again in the mesosphere and reaches the lowest temperature in the atmosphere in the mesopause, at about 70~90 km. The temperature in the mesopause may be as low as 160K or even lower at occasions. It should also be noted that the mesopause have a vertical shift during the year. The thermosphere and exosphere are the outermost layers of Earth's atmosphere extending to the outer space. The ionosphere is also an important layer in the atmosphere, containing charged particles, ions and electrons, produced when X-rays and UV radiation from the Sun ionizes atoms in the atmosphere. The ionospheric layers can be found at altitudes from 50 km up to 2000 km, named D, E, F1 and F2, The electron density in the ionosphere varies on both shod and long timescales. The diurnal variation happens, because the ionization occurs only during daytime, and recombination during nighttime reduces the electron density. There is also a variation with the solar cycle. During solar maximum, when the Sun’s ionizing electromagnetic radiation is more intense, the electron density in the ionosphere is higher. It was known that meteors are one important source for the metal atoms in the upper atmosphere.
1.b) Principle of Operation Radars Meteors.
During the dark clear night, meteors can be seen. To most people, meteors only seem to show up at night time, but meteor phenomena are happening at every moment, daytime and nighttime, which usually can’t be seen by human eyes.
were developed, which yield data from the geometry of the atmospheric trajectory, the dynamics and ablation of the body in the atmosphere, radiation, the spectral distribution of radiation, ionization, sounds and orbits.
Every moment, a large number of meteors burn up in the upper atmosphere around altitudes 70~120 km., These heights are too high for in situ observations of meteors from aircrafts or balloons and too low for satellites or space stations. The sounding rocket measurements are the only alternative for in situ measurement, which are sophisticated and expensive. remote sensing, particularly radar techniques, is the most effective method to explore the atmosphere at those altitudes. In particular, for continuous observations in certain regions, it is really hard with other techniques, e.g. aircrafts, balloons, rockets or satellites. Radar, as a feasible remote sensing method, is very sensitive to meteors (as faint as 10~15 magnitudes) and ionization phenomenon (meteor trails). Also radar is able to work for 24 hours and in all weather conditions, in modernm meteors study, the combination of radar observation and in-situ measurements, assisted with models and simulations, is widely applied, which yields the most complete view of the Earth‘s middle and upper atmosphere and ionosphere environment.
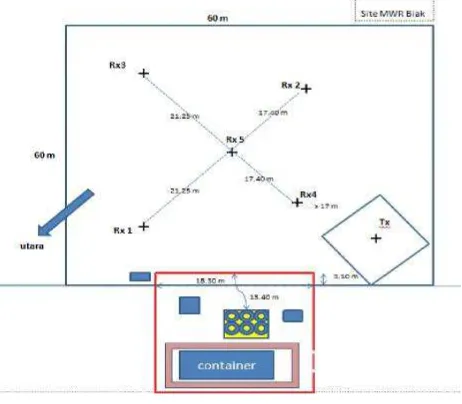
Figure 1.a) The five receiving antennas, Tx transmitter and control room.
Along time ago, scientists started to explore the meteor phenomena in the atmosphere. Different observation methods
Figure 1.b) Receiving Antenna and Transmitter antenna and Balun.
Classical interferometric SKiYMET radars, which have almost identical hardware and software, are used in this study.
Table 1.a) Basic instrument parameters both observatory.
Parameter Biak KTTB
( 1.2° S ,136.1°E) (0.2° S, 100.3° E)
Frequency 33.32 MHz 37.70 MHz
Peak power 6 kW 6 kW
Pulsed width 13 us 13 us
Pulse rep frequency (PRF) 2144 Hz 2144 Hz Transmitting antenna 3 – element cross 3 – element cross
yagi Antenna yagi Antenna Receiving antenna 5 – channel 5 – channel interferometer interferometer
of 2 element of 2 element Cross Yagi Cross Yagi
Antenna Antenna
Sampling resolution 0.94 ms 0.94 ms
Height range 78 – 120 Km 78 – 120 Km
Angular resolution 2° 2°
The following this table shows the radar system setup used
in the measurements.
The connect cables are separated for each receiving antenna with equal phase delay. The next hardware unit is called the Radar Data Acquisition System (RDAS), which includes five identical receivers connecting the five independent receiving antennas to the digitization system. (Fuller, and Vandepeer 2001). Figure 1.c) shows more details about the detection process of all-sky meteor radar. The transmit radar sends out short pulses, which has a broad radiation pattern designed to illuminate a large extent of the sky, "all-sky".
Figure 1.c) The principle of operation of the radar
The short-lived meteor trail forms the reflecting target for the radio waves and part of the incident energy are reflected back. The backscattered signals are received by an array of receiving antennas, and are then detected and recorded by the digital system. The receiving antenna array is arranged as an interferometer and phase differences in the signals arriving at each of the antennas of the interferometer can be used to determine an unambiguous angle of arrival. Together with
range information, the position of the meteor can then be accurately located in the sky.
1.c) Radar experiments
This radar experiment is divided into two parts; primer observation and secondary observation. The first section has a brief review of the sources of radar observable meteors and then discusses the physical processes that occur as a rneteoroid collides with the Earth’s atmosphere. This is followed by a development of the radio theory describing a radar’s interpretation of the meteor phenomenon.
- Primary observation:
(1) Echo range: The distance from the station to the meteoric target is known as the echo range and is a fundamental measurement easily made with pulse or FM backscatter radars. (2) Echo phase: This term is used to describe the phase of the received echo wave relative to the transmitter wave. The echo phase may be regarded as a very precise measurement of relative range.
(3) Echo amplitude or echo power. (4) Echo polarization.
(5) Echo decay time and echo duration: The decay time 1, is defined as the time when the meteor echo amplitude reaches one-half of the peak value. Typical underdense trail echoes rise rapidly to a peak after the meteor passes the nearest point and then decay exponentially see figure.1d)
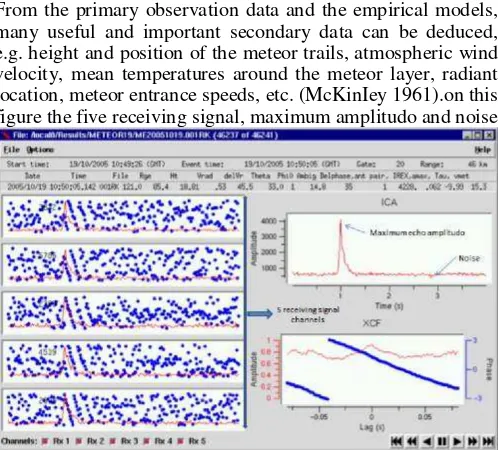
- Secondary observation.
From the primary observation data and the empirical models, many useful and important secondary data can be deduced, e.g. height and position of the meteor trails, atmospheric wind velocity, mean temperatures around the meteor layer, radiant location, meteor entrance speeds, etc. (McKinIey 1961).on this figure the five receiving signal, maximum amplitudo and noise
II. RADAR OBSERVATION.
2.a) The SKiYMET Meteor Radar
The SKiYMET meteor radar uses pulsed radio waves transmitted from a broad-beamed antenna, to detect meteor trails in the upper atmosphere (80-100km altitude). The radio pulses reflect from the trails back to 5 receiver antennas. The antennas are arranged in the form of a cross. By comparing the relative phases of the signals received on these 5 receivers, the position of each meteor in the sky can be determined.
The signal on each receiver is digitized in real-time (typically 2144 points/second), and recorded by a realtime digitizing system. The digitizer is provided by Software Genesys, and the transmitter is provided by an other as a subcontractor. The digitized signal is then analysed, using software, to determine parameters relating to the meteor trail, including meteor entrance speeds, drift speed (winds), and decay time, role in as well as the incoherently averaged amplitude (green) and the cross-correlation amplitude and phase (yellow), Graphs like this are produced and updated as new meteors appear. The user can allow the system to update automatically every 10 seconds or so, or prompt the system for new displays. It is also possible to go back and study earlier meteors which may be of particular interest, This, and all graphs, can be easily resized by the user
Figure 2.a) . Typical plots of received amplitude and phase for 5 receivers.
For the analysis software a number of online analyses are available for the SKiYMET, is a company which specializes in development and deployment of radars with scientific applications. Their specialize particularly in atmospheric and
meteor radars. On this current interests include development of an all-sky meteor system called SKiYMET radar such as :
2.b.) Meteor Detection and Position Determination.
The primary on-line analysis software acts to detect and record candidate meteor events; to discriminate candidate events from noise or from meteor events with unsuitable characteristics; and for accepted meteor events, to determine a range of meteor parameters in real time, meteor parameters include , the time of the detection,the height of the detection above ground, the radial drift velocity of the detection in m/s, the zenith angle of the detection in degrees, the azimuth angle of the detection in degrees, the decay time of the detection in seconds, the entrance speed of the meteor in km/s.
2.c.) Meteors height and position
The simplest method for measuring the height of the meteor trails in atmosphere is to use narrow beam radar and measure the range of the echo. But, this method requires the radar beams about 2° ~ 3° wide. Now the common technique is to use the combination of several radar ranges together to measure the direction of the reflection point by phase comparisons of signals received on closely spaced antennas. Since the range and the angle from zenith for each receiver antennas are known, the height of the meteor can be calculated. And height accuracies of 1~2 km can be expected. At the same time, meteor range and zenith angle can show the position information of meteor trail, by simple triangulation method.
2d.) Upper atmospheric winds
The meteor trails of expanding ionization can drift with the winds, and may also be twisted and bent. Slow variations in the echo phase will occur, which present the velocities of the upper atmospheric winds. Measurements of this parameter are accomplished by measurements of the radial velocity of every meteor detected, and then combining these measurements in an all-sky manner to determine upper level winds. The on-line all-sky least-squares fitting routine currently assumes a uniform wind u = (u, v, w) and then minimizes the quantity:
where i refers to the meteor number in a specified height and time window. Typically, such a window would cover a height region of 3~4 km, and duration of about 1.5 h. Such windows are stepped at time steps of 1 h, and height steps of 3 km. The
vector riu is a unit vector pointing from the radar to the ith
meteor trail. The value vri is the measured radial velocity, and
u. riuis a dot-product. (Hocking, Fuller, and Vandepeer 2001).