THE
AUSTRALIAN
LABOUR
MARKET
IN
2003
JOHNBURGESS*, JULIELEE* ANDMARTINO’BRIEN**
T
he labour market remained strong throughout 2003 with ongoing jobs growth and a continuation of the trend towards a lower unemployment rate. Unlike previous years, in 2003, additional jobs were mainly full-time jobs and the female labour force participation rate declined. After 11 years of ongoing improvement in the condition of the labour market, this boom is lacking the three developments associated with past improvement in the labour market: strong wages growth, strong growth in labour force participation rates, and increased industrial disputation. The review also considers the ongoing growth in the employment services sector associated with the spread of temporary agency employment. The topical issue of the ageing of the population is then considered with a critical examination of the current policy direction of extending the working life of Australian workers. Finally, a related issue is reviewed: the provision of child care services in Australia.INTRODUCTION
For 2003, the number of Australians in work continued to grow and the unem-ployment rate remained below six per cent. While the rate of economic growth continued to be around three per cent, there was some signs of a slowing in the economy. In the first half of 2003, farm sector output contracted considerably, largely in response to extensive drought conditions across Australia. The Reserve Bank of Australia on two occasions increased the cash rate by 0.25 per cent and the Australian dollar appreciated against the US dollar and most of the other major trading currencies. For 2004, the prospects for growth and jobs in the Australian economy are not good given the possibility of a further interest rate rise together with the declining competitiveness of Australian industries as the Australian dollar continues to appreciate. One of the major policy issues emerging in Australia and in many other OECD economies is the ageing of the population with its implications for the financing of retirement incomes and the provision of health services. Both the Federal Treasury and the Reserve Bank have been vocal in warning the community of the looming fiscal crisis associated with the ageing population. The funding of child care and family allowances continues to be in the news following the extended public debate on paid maternity leave in 2002 and 2003.
The review commences with a brief summary of developments in the Australian labour market in 2003. It then discusses the Reserve Bank’s raising of
interest rates as a policy shift, and its consequent impact on the housing and con-struction sector. The appreciating Australian dollar and its impact on employ-ment is then considered. This leads on to a brief overview of the booming employment services sector with an emphasis on the employment arrangements common to the sector. The review then moves on to a discussion and evaluation of the looming fiscal crisis associated with the ageing of the Australian popu-lation. The Treasurer released a statement in February 2004 announcing policy changes to end early retirement and to extend the working life of older workers (Australian Broadcasting Commission[ABC] 2004). Finally, the discussion turns to child care provision and potential policy prescriptions aimed at lifting labour market activity rates of young parents to compensate for the possibility of a labour shortage associated with the ageing of the population.
THE LABOUR MARKET2003
Despite the unemployment rate reaching a 20-year low, wages, participation rates and industrial disputation are not behaving procyclically
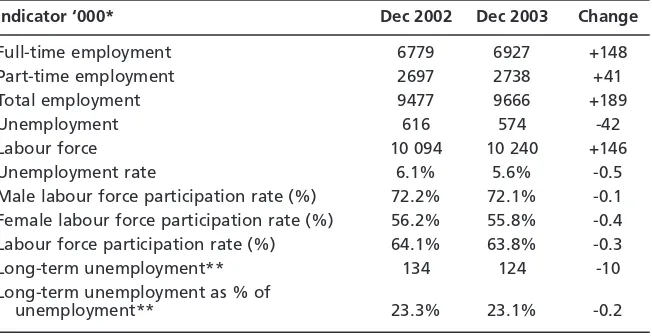
Throughout 2003, the unemployment rate remained below six per cent, and by the end of the year it had declined to 5.6 per cent (seasonally adjusted), a rate not seen in Australia since the late 1970s. Not only has the unemployment rate declined, but also the number of the long-term unemployed has diminished, as has the share of the long-term unemployed in total unemployment (Table 1). While this is good news, it needs to be remembered that around 570 000 people remain officially unemployed and another few hundred thousand are in forms of underemployment and hidden unemployment (Burgess et al. 2003: 131).
Table 1 reveals some interesting developments in the labour market over the past year. Unlike previous years (Burgess et al.2003), the majority of additional 142 THE JOURNAL OF INDUSTRIAL RELATIONS June 2004
Table 1 Australian labour market, December 2002–December 2003
Indicator ‘000* Dec 2002 Dec 2003 Change
Full-time employment 6779 6927 +148
Part-time employment 2697 2738 +41
Total employment 9477 9666 +189
Unemployment 616 574 -42
Labour force 10 094 10 240 +146
Unemployment rate 6.1% 5.6% -0.5
Male labour force participation rate (%) 72.2% 72.1% -0.1 Female labour force participation rate (%) 56.2% 55.8% -0.4 Labour force participation rate (%) 64.1% 63.8% -0.3
Long-term unemployment** 134 124 -10
Long-term unemployment as % of
unemployment** 23.3% 23.1% -0.2
*Seasonally adjusted; **November 2002 to November 2003.
jobs have been full-time jobs. While the male participation rate continues to decline, there was a considerable reduction in female participation rates, again reversing the longer-term trend previously highlighted (Preston & Burgess 2003b). The two developments may be related because past experience demon-strates that strong part-time jobs growth has been associated with an increase in female labour force participation rates.
This marks the 11th successive year in which the average unemployment rate has declined. With such a sustained boom in jobs, nearly two million additional jobs since 1992/93, there are some missing elements associated with past booms in jobs in the Australian economy (see Indecs Economics 1995, Ch. 2–4): (a) increasing nominal wage demands and rising real wages
(b) increasing inflation rate
(c) an increase in labour force participation rates (d) increasing industrial disputation
Why have these elements been missing over the past decade? First, the insti-tutional change to wage determination arrangements has removed coordinated and centralised wage determination from the national agenda. Wage determin-ation is more decentralised, less coordinated, and staggered through time. The concurrent and solidaristic element associated with past wage determination arrangements has diminished (Preston & Burgess 2003a). Many of the new jobs are in sectors that are not traditionally union active, have high part-time employ-ment densities, and are service sector related—in these, it is difficult to bargain for wage increases on the basis of productivity gains (Sullivan et al. 2003). Second, the trade union density has declined and non-union and individual bargaining arrangements have developed and expanded (Burgess & Macdonald 2003). These arrangements are not associated with industrial action. In turn, the ability to legally undertake action and to access the workplace to organise has been diminished within the Federal jurisdiction. Third, the Reserve Bank has a clear mandate to keep inflation within its acceptable range (2-3 per cent on average) and to act pre-emptively if there are any threats to the target. It has already indicated that unacceptable nominal wages growth will result in pre-emptive interest rate increases (Stegman 1997). Finally, the moderate growth in nominal and real wages may have tempered any increase in labour force participation. The gender convergence in participation rates continues: for men, there continues (despite the jobs growth) to be a decline in participation rates, and for women (despite the last 12 month’s experience), there has been a longer-term increase in participation rates. Over the past decade, male rates have declined around two per cent (absolute), while female rates have increased by around four per cent in absolute terms. Previous reviews of the labour market have highlighted the dramatic shift in the industrial composition of jobs as well as the growing share of part-time employment (Burgess and Mitchell 2001). Over the past decade, employment has contracted in agriculture, mining, and utilities and has remained static in manufacturing—all areas of traditional full-time male employment. Most additional jobs are found in three sectors: retailing, property and business services, and health and community services. Despite the modest increase in part-time jobs over the past 12 months,
in December 2003, the part-time employment share was still a considerable 28.3 per cent.
The Reserve Bank moves beyond its inflation watching brief and addresses the growth in household debt: Disturbing implications for the building and construction sector The Reserve Bank raised cash rates by 0.25 per cent in November and December of 2003. In his November statement, Reserve Bank Governor Macfarlane stated that there were no short-term inflationary pressures; indeed, the appreciation of the Australian dollar had reduced inflationary pressure. Over 2003, the inflation rate was around 2.5 per cent, well within the official target range. The main justification for the interest rate increase was the rapid expansion in credit, up 20 per cent for households during the previous 12 months. This was regarded as unsustainable and not consistent with economic stability over the longer term (Macfarlane 2003a). The same statement was released in December, again blaming the rate increase on the rapid expansion in domestic credit (Macfarlane 2003b). This represents a departure from past practice because now the contain-ment of inflationary pressures is not the primary reason behind rates adjustcontain-ment, rather, the justification is related to the perceived non-sustainability of house-hold debt. What the Reserve Bank Governor is saying is that there is too much borrowing, which will only lead to an asset price bubble that will have major destabilising implications for the economy, so lets slow down the borrowing before it gets out of hand.
The major factor behind the growth in household debt is the increase in housing loans. This has been driven by low interest rates, competition in housing loans market and an inexorable rise in housing prices across Australia (Macfarlane 2003c). It is largely the demand for investment housing that is driving the growth in borrowings. This is also linked to the above factors, together with the incentive to borrow provided through the personal taxation system (negative gearing).
As a consequence of the housing boom the housing and construction sector recorded the largest increase in both output and employment of any sector during 2002/2003—employment grew by 11 per cent in the year to September 2003 (Reserve Bank of Australia 2003). This is one of the factors driving the expansion in full-time employment (see Table 1). The November review of economic conditions by the Reserve Bank reported a decline in building activity in the first half of 2003, followed by a slight pick-up in the second half of the year (Reserve Bank of Australia 2003: 21). Towards the end of 2003 there was a decline in building commencements and building approvals (Australian Bureau of Statistics [ABS] Cat. No. 1350.0), although the outlook for the con-struction sector appeared stronger than that of the housing sector (Australian Industry Group 2003). In the media, the reports suggested a more drastic fall-off in building activity with warnings from industry spokespersons of a looming slump in the sector (Gottliebson 2003; Wade 2004).
employment in the sector is predominantly male and full-time, and it is an impor-tant source of apprenticeships (Toner et al. 2003). The danger is that such an interest rate-prone industry can shed jobs and apprenticeships very quickly, and in turn, this will have a flow-on effect to building material supply industries such as timber, steel, concrete, bricks, transport, cabling, and plumbing supplies. While there is the expectation of a further interest rate rise in the next few months (Uren et al. 2004), it could be compounding an already downward adjustment in the building and construction sectors, and in associated sectors (especially manufacturing and transport) that support the industry. A central policy question is whether interest rate increases are the appropriate means of cooling off the industry when the taxation system may be a contributing structural factor behind the industry boom. Further interest rate increases have implications for the value of the Australian dollar (see below).
THE RISE AND RISE OF THEAUSTRALIAN DOLLAR
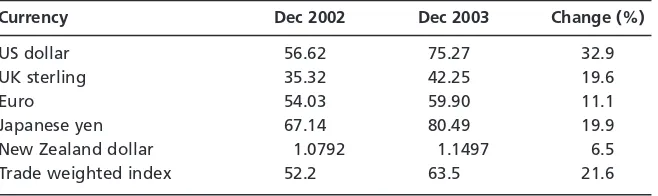
There was a strong appreciation of the Australian dollar throughout 2003, nearly one-third against the US dollar and over 20 per cent against the trade weighted index (the basket of currencies that covers Australian trade) (see Table 2). In general terms,Australian goods and services are more expensive in international markets and internationally produced goods and services are cheaper in Australia. This is favourable for Australian consumers (cheaper cars, French champagne, overseas holidays, computers, software, petrol, and electronics) and for Australian businesses that rely on imported inputs (e.g. the transport industry should have lower operating costs). However, it makes it difficult for traded Australian goods and services that are exported or compete against imports. There is also an increased cost advantage to sourcing production offshore to take advantage of the lower operating costs—this could lead to a growing exodus of service jobs offshore such as aircrew and call centre operations (Burgess & Connell 2003).
What is driving the appreciation of the Australian dollar? First, there is the inherent weakness of the US dollar that has declined against most currencies largely in response to sluggish US growth and a growing US trade deficit (The Economist2004). Second, there has been an increase in commodity prices and in general, those countries that are commodity traders (Australia, New Zealand, THEAUSTRALIANLABOUR MARKET IN 2003 145
Table 2 Currency movements, foreign currency per Australian dollar
Currency Dec 2002 Dec 2003 Change (%)
US dollar 56.620 75.270 32.9
UK sterling 35.320 42.250 19.6
Euro 54.030 59.900 11.1
Japanese yen 67.140 80.490 19.9
New Zealand dollar 1.0792 1.1497 6.5
Trade weighted index 52.200 63.500 21.6
South Africa) have experienced an appreciation of their currency against other trading currencies (Sender 2004). Third, the increase in Australian interest rates draws investors into the Australian bond market that has very attractive yields relative to other bond markets. Further interest rate increases (Uren et al. 2004) will encourage further holdings of Australian bonds.
Australian companies with offshore operations will suffer a decline in their earnings in Australian dollar terms (Ubels 2004). The Australian Industry Group (2004) reported that a survey of 800 manufacturing companies revealed estimated sales losses of A$7 billion in 2003 from reduced export sales and increased imports. The survey revealed that 17 per cent of the survey respondents are considering locating some production operations offshore. The sector leading the way in its intention to relocate was clothing and textiles.
The currency markets remain volatile with the US dollar being supported by Japan and China—major trading partners of the USA who are reluctant to allow the US dollar to continue to depreciate and thus erode their competitive advantage (The Economist2004). At this stage, some sectors will be shedding jobs if the appreciation of the Australian dollar continues. Further interest rate increases in Australia will only exacerbate these problems.
THE EMPLOYMENT SERVICES INDUSTRY: LABOUR OUTSOURCING AND SHORT-TERM EMPLOYMENT ARRANGEMENTS
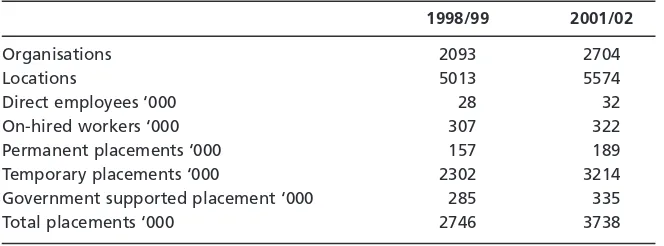
The Australian Bureau of Statistics has published its second survey of the Employment Services industry, covering 2001/2002. The first survey was conducted in 1998/99. The constituent businesses of the industry generate their income through employment placement, which covers both labour hire and the direct placement of staff into employing organisations. What is interesting about the industry, in the context of the Australian labour market, is its growth and the extent of its activity. While to some extent the expansion in the employment services industry is related to the outsourcing of labour services for the unemployed through the Jobs Network (Eardley 2003), these activities only represent a small component of the business activities of the sector.
The two surveys demonstrate a rapid expansion in the sector with an approxi-mate 30 per cent increase in the number of organisations operating in the sector and a 36 per cent increase in the number of job placements being undertaken. Around 10 per cent of total placements are linked to the Jobs Network. Around five per cent of placements are for permanent positions and the balance consists of temporary and contract placements. Over one half of the temporary placements are in health care/medical and trade/labour occupations. The number of on-hired workers (or temps) associated with the sector increased from 307 000 in 1998/99 to 322 000 in 2001/02. While this suggests that the number of workers employed as temps at any one time is around three per cent of the workforce, the impact of the employment services sector in reshaping and restructuring employment should not be understated.
hires of a few hours and contracts covering several years, and supplies a range of labour and human resource services to client organisations. It is expanding across all sectors and all occupations, and has benefited from the rationalisation of the public sector in many countries (Hall 2002). In Australia, the main concerns with the sector are its functioning outside of labour regulations (Campbell et al. 2002), its ability to recontractualise employment, and the potential problems for skills and occupational health and safety associated with a transient and irregular employment (Hall 2002; Labour Hire Taskforce 2001).
What is interesting from Table 3 is the growth in the number of operators in the industry (around 80 per cent have less than 10 direct employees) and the growth in the number of placements. On both counts, the sector exceeds the growth of jobs in the economy. Permanent placements and government-related training and employment placements both increased, but short-term placements increased by around 900 000 in a 3-year period. The number of temps or on-hired workers grew slightly higher than the growth in jobs, but the growth in short-term placements is extraordinary. The reasons for this are unclear. It could represent skills shortages, the restructuring and funding of public services, a shift towards external recruitment and the associated provision of human resource services, or the re-contractualisation of the workforce and associated labour and flexibility advantages (lower on-costs, reduced protection, lower unionisation rates). However, there does appear to be a discernable shift towards outsourcing employment placement and short-term job placements. At the moment, the total placements of the industry represent around one-third of the total jobs in the economy. At the margins, extensive job churning is taking place with many jobs of short-duration being filled through temp agencies.
IS THERE A LOOMING AGEING CRISIS INAUSTRALIA?
Over the past year there have been several official statements on the looming ageing crisis and the negative implications associated with it in terms of increasing dependency ratios (population/workforce) and a deteriorating fiscal position associated with the growing demand for State-provided retirement incomes and TH EAU S T R A L I A NLA B O U R MA R K E T I N 2003 147
Table 3 Employed services sector in Australia 1998/99 to 2001/02
1998/99 2001/02
Organisations 2093 2704
Locations 5013 5574
Direct employees ‘000 28 32
On-hired workers ‘000 307 322
Permanent placements ‘000 157 189
Temporary placements ‘000 2302 3214
Government supported placement ‘000 285 335
Total placements ‘000 2746 3738
health services (Henry 2003; Macfarlane 2003d). Treasurer Costello announced that the government intended to extend the working lives of Australians as a way of addressing the crisis (ABC 2004). This approach assumes that there are jobs available for older Australians—an assumption that is challengeable.
An ageing society is typified by an absolute and relative increase in the number of older people (generally aged 65 years and over) among the population. Coexisting with this situation is a smaller proportion of the population in the traditional working ages of between 15 and 64 years of age. Therefore, while the proportion of the population ‘dependent’ on social expenditure spending is expected to increase, the proportion of persons ‘active’ and working, and thereby forming the traditional income tax base, is expected to shrink. At the very least, this situation is anticipated to place strain on the Commonwealth government’s budget to finance its social security and health obligations (Treasury 2002). At the extreme, this situation could lead to intergenerational conflict from a younger minority financially supporting an ageing majority (Johnson et al. 1989). Of
course, this situation becomes further complicated by a declining older male worker (aged 55–64 years) labour force participation rate.
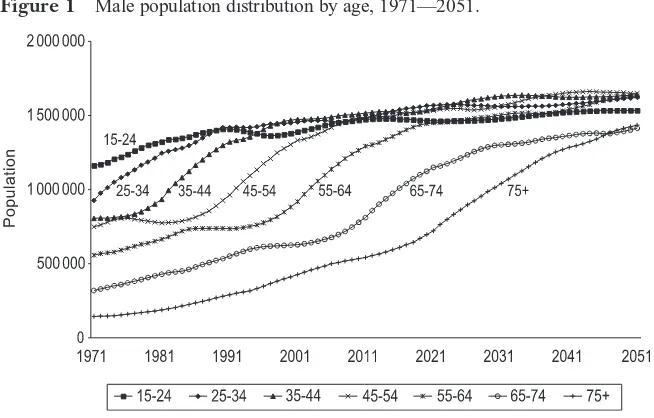
Is there an ageing crisis in Australia? The proportion of the Australian popu-lation aged over 65 years is projected to increase from the current 12 per cent of the population to 18 per cent in the year 2021 and 26 per cent by the year 2051 (Bishop 1999). Figure 1 shows that the proportion of the population in older male age groups is clearly increasing over time. Of particular importance are the steeper sections in the age distribution at regular intervals in time, representing the large proportion of the population comprising the baby boomer generation (individuals born after 1946 and before 1960). This generation started reaching
148 TH E JO U R N A L O F IN D U S T R I A L RE L AT I O N S June 2004
Figure 1 Male population distribution by age, 1971—2051.
Source:Australian Bureau of Statistics. LFS Datasets. Catalogue 6291.0.40.001 Australian Bureau of
the 35 to 44-year-old age group in the early 1980s, and the 45 to 54-year-old age group in the early 1990s. At present, Australia is experiencing a large increase in the number of males aged 55–64 years.
As well as encouraging individuals to finance their own retirement income and health, an alternative policy to allay future budget pressures identified by the Commonwealth government in the 1980s was to encourage longer labour force participation of older workers (Economic Policy Advisory Committee 1988). Research has shown that projections of government social security expenditure in the future are reduced if early retirement trends are reversed and/or a later age of retirement is established (e.g. Guest & McDonald 1999, 2000; Access Economics Pty Ltd 2001). Thus, legislation was introduced at the federal level and in all states throughout the 1990s to prevent age discrimination in employment and retirement practices. More recently, a number of policy reforms have been initiated as part of the ‘National Strategy for an Ageing Australia’ to encourage greater older worker labour force participation. These initiatives are contained in welfare reform proposals (Department of Family and Community Services [DFaCS] 2000), the House of Representatives inquiry into older age unemployment (House of Representatives 2000), the 2001–02 and 2002–03 Commonwealth Budgets (DFaCS 2001, 2002a), and the ‘Australians Working Together’ policy (DFaCS 2002b). Proposed policy is supply-side-based, with the potential role of labour demand constraints to older worker labour force participation generally considered to be minor. For example, policy initiatives include restrictions to social security pensions traditionally used by the older population before the age of 65 years, such and the Disability Support Pension (DSP) and Mature Age Allowance (MAA), and increased access to training for the older unemployed, rather than any job creation or subsidies. It has been stated that these policies will increase the labour force participation of welfare recipients and lower unemployment (DFaCS 2000).
Australia is not alone in experiencing the demographic effects of an ageing society. Therefore, a number of international institutions have researched the demographic and fiscal effects of an ageing society and recommend different policy reforms. The World Bank recommends a gradual shift away from publicly managed pay-as-you-go (PAYG) pension schemes. Instead, a multiple pillar retire-ment income system is advocated, consisting of a mandatory and publicly managed unfunded scheme supported by a privately managed funded scheme, and supplemented by voluntary savings schemes (World Bank 1994, Holzmann 1998). The Organisation for Economic Co-operation and Development (OECD) has also conducted research on ageing society issues and older workers within their ‘Maintaining a Prosperous Society—Ageing Research Project’ (OECD 2003). Their research could be interpreted as involving a three-part process (O’Brien 2001c). First, it identifies the future budget exposure posed by an ageing society, especially for publicly funded pensions. Second, it establishes the role of these pensions in explaining the decline in older labour force participation (Blöndal & Scarpetta 1998). Finally, it justifies pension reform as a means of reversing early retirement trends via restrictions to eligibility and lower pension value, thereby justifying a diminishing role for public pension
financing. In contrast, the International Labour Office (ILO) suggests a full employment policy, anti-age discrimination action, and publicly funded pensions (ILO 1995). The ILO questions the move from public to private funded retire-ment income schemes suggested by other institutions (Gillion 1998). However, it is clear that the Commonwealth government has largely endorsed the OECD and World Bank models.
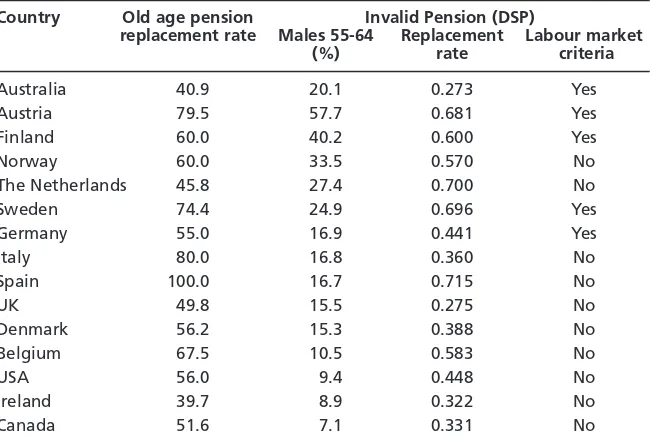
However, it may be argued that Australia occupies a unique position among developed countries and that reforms suggested by the OECD are not applic-able to Australia. First, demographically, Australia only occupies an intermediate position between the relatively young Asian and African countries, and the older Northern European countries (Borowski & Hugo 1997). Therefore, the demographic ageing effects anticipated in Australia are considered mild compared to other nations such as Japan and many European countries (OECD 1995). In comparison to Australia’s 18 per cent in 2021, the percentage of the population aged over 65 in 2020 will be 26 per cent in Japan, 23 per cent in Germany and 24 per cent in Italy (Leibfritz 1995: 57). Second, social security pensions avail-able to older workers are not as generous as those in other nations, meaning that Australia’s government does not inherit the same future budget commitments as other countries. Table 4 displays information for pensions traditionally used by those younger than 65years such as the invalid pension (in Australian known as the Disability Support Pension [DSP]), as well as for those aged over 65 such as the old age pension. Replacement rates are presented as the pension rate expressed 150 TH E JO U R N A L O F IN D U S T R I A L RE L AT I O N S June 2004
Table 4 Older males and social security pensions, OECD Countries, 1995
Country Old age pension Invalid Pension (DSP)
replacement rate Males 55-64 Replacement Labour market
(%) rate criteria
Australia 40.9 20.1 0.273 Yes
Austria 79.5 57.7 0.681 Yes
Finland 60.0 40.2 0.600 Yes
Norway 60.0 33.5 0.570 No
The Netherlands 45.8 27.4 0.700 No
Sweden 74.4 24.9 0.696 Yes
Germany 55.0 16.9 0.441 Yes
Italy 80.0 16.8 0.360 No
Spain 100.0 16.7 0.715 No
UK 49.8 15.5 0.275 No
Denmark 56.2 15.3 0.388 No
Belgium 67.5 10.5 0.583 No
USA 56.0 9.4 0.448 No
Ireland 39.7 8.9 0.322 No
Canada 51.6 7.1 0.331 No
as a percentage of average earnings. In this respect, Australia’s old age pension is the least financially attractive of the OECD countries presented. It is also shown that the invalid pension plays a significant role for older males’ labour force exit in other countries apart from Australia. Invalid Pension receipt is generally higher in countries that have labour market-related eligibility criteria. Also, the Invalid Pension take-up is generally greater in countries with higher replacement rates. Notably, Australia’s Invalid Pension is not financially attractive compared to over-seas replacement rates, and thus, its high rate of take-up is more likely related to the design of its (labour market) eligibility, rather than its relative financial value.
Roseveare et al. (1996) projected pension and health outlays to the year 2030 for OECD countries under various assumptions. If present pension policies were to continue, pension payments as a percentage of Gross Domestic Product (GDP) would be over 10 per cent of GDP for most European nations, including up to 20 per cent for Germany and Italy. In comparison, in the US, Canada, and Iceland, less than 10 per cent of GDP would have been committed. In contrast, commitments for Australia, Ireland and the UK amount to less than five per cent of GDP. These were also projected under various pension reform scenarios such as increasing retirement age to 70 years, reducing pension value, and targeting eligibility to fewer potential recipients. Up to a ten percentage point saving on GDP was evident for some European countries under these reforms. However, only minimal effects were evident for Australia from the proposed reforms. Therefore, it may be argued that Australia does not face an ‘ageing society crisis’ in terms of demographic effects on fiscal commitments.
Finally, O’Brien (2001a) argues that the decline in older male labour force participation rates experienced over recent decades was more caused by a lack of aggregate labour demand rather than inspired by labour supply financial incentives. The relative lack of financial incentives within Australia’s social security system compared to those overseas indicates that pensions have not been used as a tool to entice workers aged 55–64 years from the labour market through their financial attractiveness. Rather, social security pensions, through their eligibility rules, have played a role of accommodation and have allowed an avenue out of the labour force for those otherwise suffering unemployment and facing poor labour market prospects. Findings from econometric modelling of older male labour force participation rates and social security usage confirm a large role for labour force discouragement, challenging the previous consensus in the Australian literature emphasising the role for financial (supply) variables (O’Brien 2001a, 2001b). It is clear that the current reform policy, addressing an ageing society, is aimed at getting the pool of hidden unemployed back into labour force participation, primarily to address future budget concerns. However, the policy ignores the aggregate labour demand cause of declining older male labour force participation rates, and that social security use had accommodated such trends rather than caused it. Therefore, without future labour shortages, which has not been clearly established in the research literature, the pension restrictions suggested may simply reveal hidden unemployment and lead to an increase in official unemployment toward those estimates revealed by O’Brien
(2001a, 2001b, 2003). Therefore, this policy, which is driven by budget concerns, may ultimately backfire through a process of benefit substitution, with an increase in official unemployment and payment of unemployment related benefits to those populations who would have otherwise previously been on various social security pensions and not in the labour force.
In summary, because of milder ageing intensity and lower pension generosity, it may be argued that Australia does not face the same ageing society crisis of other OECD countries. Furthermore, supply-side reform policy inspired by the OECD is ill directed when the cause of declining older male labour force participation appears to be caused by lack of aggregate labour demand. A policy more attune with ILO recommendations would seem more applicable to Australia’s circumstances to avert any form of crisis associated with an ageing society.
LIFTING ACTIVITY RATES THROUGH CHILD CARE PROVISION?
At the other end of the age spectrum, extending the funded provision and access to child care is one way of increasing labour force participation rates of women and alleviating the longer term decline in participation rates associated with an ageing population. With the run-up to the next federal election, child care policy has been attracting more political interest and media commentary. Various proposals have been floated. For instance, McDonald (2002) has argued for an early child education and care policy for Australia that would provide universal access to 20 hours of care per week to every 3 and 4-year-old child. The Australian Council of Trade Unions (ACTU) Childcare Affordability Guarantee 2010 Proposal(2003a) proposes a choice to families earning less than $100 000 per annum of 15 hours free child care per week for every child or a cap on child care contributions at 15 per cent of the household income. While a policy that would allow 10 hours of free care a week for all children below pre-school age and guaranteed access to a free year at pre-school has been canvassed in some ALP circles (Sydney Morning Herald 2/2/04). These proposals have implications for maternal decisions about the timing of re-entry to the labour force after childbirth and the extent of participation. This review aims to explore these implications.
It is a truism that the resolution of the conflicting time demands of work and family requires, among other things, appropriate care arrangements for children in an era when both parents are active in the labour force, and this circumstance is increasingly common. The proportion of couple families with dependent children that have both parents in the workforce has increased from 44 per cent in 1981 to 62 per cent in 2000 (ACTU 2003b: 4). Moreover, mothers of quite young children are increasingly seeking paid employment. ‘The proportion of mothers who work with children aged less than 12 months more than doubled from 17 per cent in 1976 to 36 per cent in 2001’ (ACTU 2003b: 4). ‘By the time a child is in its second year, 57 per cent of mothers are working. By the time their children have turned 3 years old, 68 per cent of mothers are back in the workforce’ (Crean 2002: 7). However, the choice of appropriate child care is complex. The child care solutions vary with the age of the child, have different
financial implications for the family, will invariably confer other benefits apart from releasing the parents from full-time care, may attract government subsidy and may need to be synchronised with other care arrangements where there are multiple children in the family or multiple care types used. For the sake of easy exposition, this review will primarily be concerned with the care options available to children aged 0–4 years as this age range corresponds to the ages implied in the recent media pronouncements.
The child care options open to parents range from adjustments to working hours to enable the parents to care for children themselves through to the use of market-based paid child care service providers. The period 1990 to 2002, has seen the proportion of 0 to 4-year-olds that use only parental care decline from 40 per cent to 36 per cent, while the share using some formal care has consistently risen from 28 to 44 per cent (ABS 2003, Child Care). Thus, not withstanding significant changes in the funding arrangements for the various care providers, there has been a marked shift toward formal care. It is these care arrangements that have been the subject of the debate. For 0 to 4-year-old children, long day care, family day care and preschools are the major suppliers of formal care. However, as McDonald points out (2002) these services embody different philo-sophies. Preschools have developed under the auspices of State and Territory governments to provide low or zero-cost early childhood education in the years immediately before school age, while federal government funding of long day care and family day care has been aimed at providing child care for working parents. These federally subsidised services are work-tested and means-tested, and require a co-payment from parents. The child care proposals above cut across these differences, but for now, these practical issues of implementation will be put to one side. It is also acknowledged that there is no firm political commitment to any of these scenarios at present, so they should be taken as indicative of possible policy developments. Nevertheless, they serve to raise three issues of importance: the ages of eligible children; the hours of care to be subject to subsidy; and the conditions attached to eligibility.
The McDonald proposal specifically mentions ages 3 and 4 years, while the other proposals appear to have children before school age as the target. The broader the age range, the higher the fiscal impost of subsidised care. In 2002, 83 per cent of 4-year-old children participated in formal care, with this age cohort accounting for 62 per cent of all preschool attendees. For 3-year-olds, 63 per cent experienced some formal care with over a half in long day care and a quarter attending preschool (ABS 2003, Child Care). However, the proportion of 2-year-olds in some formal care was only 41 per cent and the proportions for younger children are even lower. Thus, a proposal targeting 3 and 4-year olds could expect to draw more children into early childhood education, but the greatest effect will be for families with 3-year-olds. Some mothers not presently in the workforce might be induced by these changes to consider employment.
For all children using preschools, the median weekly hours of care was 10 hours in 2002. The comparable figures for long day care and family day care were 16 hours and 12 hours, respectively (ABS 2003, Child Care). Current provisions under the federal government’s Child Care Benefit allow up to 50 hours of
subsidised care per child per week for work related care in approved care (as per formal care above but excluding preschools) but only three per cent of children attended long day care centres for this long (DFACS 2003) with 59 per cent attending for less than 20 hours per week (the system also allows for up to 20 hours of subsidised care for non-work-related purposes). On existing usage patterns, 20 hours of universal care would seem generous, with 15 and 10 hours less so. However, the free care provision would effectively lower the average price of any care purchased by a family provoking a rise in demand from both existing and new users of the system. This would be consistent with the rise in service usage following the introduction of the more generous benefits available to families with the Child Care Benefit available from 2000 (DFaCS 2003). So working parents might be expected to combine the universal care provision with some ‘top-up’ care hours, making it easier to accommodate work and family pressures, provided the family could secure a child care place. It is not possible to link child care hours for children aged 0–4 years to maternal working hours, though for children aged 0–11 years in couple families, 77 per cent of mothers worked part-time with 37 per cent working less than 16 hours per week (ABS 2003, Child Care), so there is potential to increase the effective labour force by extending maternal working hours.
The median weekly net cost to parents (after the Child Care Benefit has been paid) per child for preschool, long day care and family day care was $13, $38 and $21, respectively, in 2002 (ABS 2003, Child Care).But the weekly cost of formal care is sensitive to the hours of care, which in turn is linked to parental work hours and parental weekly income. For instance, the median weekly out-of-pocket cost to parents of all types of formal care for all children aged 0–11 years was $21 but for 30 to 39 hours of weekly care the median cost was $100. The proposals under discussion offer families a quantum of child care that is free and not subject to other eligibility criteria. Hence, the effect would be to reduce the effective price of all care hours used for all family income groups as noted above. For some mothers this may provoke a substitution from domestic duties to paid employment, but for others already in the labour force it may result in a reduction in the patchwork of care arrangements for more formal care arrange-ments and a reduction in the ‘juggling act’ that accommodating work and family can impose.
The current Child Care Benefit invokes family income as the basis to determine eligibility. It is debatable whether family income is an appropriate benchmark, given disincentive effects, if the objective is to encourage maternal labour force retention in the face of an aging population, but putting that to one side, the current means test is quite stringent. In July 2002, for families with one child in care, maximum child care benefit was paid on annual family incomes up to $30 806 (Lee 2003) and maximum benefit was received by 43 per cent of all families using long day care and family day care (DFaCS 2003). If such a family, in 2002, were paying the average weekly fee in private long day care centres of $186 and receiving the maximum benefit of $133, then they would have a fee gap of $53 per week (Popple and Martin 2003). If the fee gap is expressed as a percentage of weekly disposable income, then 11–13 per cent of weekly incomes above
$40 000 were devoted to expenditure if the family had one child in full-time long day care (Popple and Martin 2003). Of course, the stringent incomes test results in the bulk of the child care benefit outlays going to families with very low incomes. This is in contrast to the absence of an incomes test in some of the new proposals and a benchmark that child care costs should not exceed five to six per cent of disposable income suggested by the Australian Council of Social Services and the Brotherhood of St Laurence (cited in Lee 2003).
Thus, the changes, if implemented, would improve the affordability of child care services for all families, would provoke a rise in demand for the services, would deliver universal access to early education services, but would be less targeted to low-income families and would offer some families a more convenient way of dealing with some aspects of work–family imbalance. Of course, any scheme might be amended to restore greater assistance to low-income families. It should be noted that the fiscal impost associated with these proposals is not excessive. The ACTU (2003a) cites an OECD study that estimated the OECD average expenditure on early education and care was 0.6 per cent of GDP compared to Australia’s 0.1 per cent of GDP. However, all of this discussion still leaves at least one notable gap and that is the appropriate care arrangements for children under the age of 3 years.
Very young children raise particular care issues. Parents have a strong preference for parental care for this age group. Resource requirements to care for these children result in higher centre-based fees and fewer places are available. In 2002, 2-year-olds represented 14 per cent of children in private long day care and 19 per cent of children in community-based schemes (DFaCS 2003). In July 2003, the ACTU lodged an application with the Australian Industrial Relations Commission to bring a Work and Family Test Case with provisions that address the needs of care for young children. The test case seeks to increase the flexibility available to families to alter hours of work, including moving between full-time and part-time work, depending on the stage of family formation. Australian industrial relations provisions currently allow 12 months unpaid parental leave around the birth (or adoption) of a child, with return to employment on a part-time basis at the employer’s discretion. The test case includes a claim to extend this allowance to 24 months unpaid parental leave with the right to return part-time resting with the employee. In addition, the test case argues for the right to part-time hours to continue until the child is school aged and for access to reasonable unpaid emergency leave and the right to vary daily hours to fit child care times (the test case also proposes changes associated with caring for school aged children and the aged and disabled, but these are not central to the current theme). If accepted, the clauses would have the effect of providing parents, and especially mothers, with the means to accommodate work and care needs of children under 3 years of age, again facilitating return to work and labour force participation. It needs to be acknowledged that the right to return to employment on a part-time basis should not be seen as a justification for further erosion of work conditions available to part-time and casual workers.
Finally, part-time work and flexible hours have been used to satisfy family care needs for some time but there is little sign of change. Adoption of family-friendly
work practices have been proclaimed as one means of reducing work–family imbalance. Indeed, the Australian Bureau of Statistics (ABS 2003, Cat. No. 4402.0) points out that in the four child care surveys since 1993, a roughly constant 68 per cent of employed mothers used work arrangements to provide care for children aged 0–11 years. If adjustments to work hours are the sole means of accommodating care requirements, then they will neither require a government subsidy nor impose a monetary cost on families. These work arrangements included flexible working hours, permanent part-time work, shiftwork, working at home, job sharing and other arrangements. Yet despite the increased political and media attention given to family-friendly work practices, there has been surprisingly little change in the diversity of utilised working arrangements across the four surveys. Shiftwork, job sharing and other arrangements constitute a roughly constant 10 per cent share of all working arrangements used by employed mothers over the decade, while working from home has experienced a share declining from 21 per cent to 17 per cent. Flexible working hours and permanent part-time work between them have accounted for more than two-thirds of the chosen working arrangements since 1993. Unfortunately, data constraints mean that it is not possible to determine how frequently and for what specific age cohort of children employed mothers used these arrangements.
This review outlines developments that have the potential to ease the care burden faced by the high proportion of working families with young dependent children. However, implementation will require a commitment to being inno-vative, a willingness to reform the early education sector and the political will to devote adequate funding to the sector. Despite the policy imperative to reduce dependency rates and lift activity rates associated with an ageing of the popu-lation, the issue of child care access and provision and its links to activity rates remains on the policy back-burner.
CONCLUSION
Will 2004 bring an end to the boom in jobs and the decline in the unemploy-ment rate? Strong growth in China and Japan should ensure ongoing demand for Australian commodities; however, the strength of the Australian dollar will hit jobs in import competing and export sectors. The strength of the currency will also give added impetus to the ‘offshoring’ of jobs in manufacturing and services. Further interest rate increases will support the strength of the Australian dollar and place pressure on the housing sector. Over the past few years building and construction has been one of the major sources of new full-time (mainly male) jobs in the economy. A contraction in the housing sector will not only lead to job losses in the sector but also have knock-on effects to suppliers to the building industry.
The federal government is currently developing policies to address the proclaimed crisis associated with the ageing of the population. In this review, both the extent of the crisis and the proposed policy approach towards it have been addressed. The experience of the Australian labour market over the last decade has been one in which older workers have difficulty retaining and
accessing jobs; it is not clear how this situation will be reversed. There does exist scope for lifting activity rates through extended and flexible provision of child care services; however, this option has not been addressed in the current policy discussion.
Finally, the ongoing fragmentation of jobs and the restructuring of the employ-ment relationship is highlighted by the continued growth of the employemploy-ment services sector in Australia. There are not only more agencies in more locations, but also more agency workers. However, the interesting development is the very strong growth in short-term job placements. This could reflect a shortage of skilled labour, or it could represent a shift towards further casualisation of the workforce.
REFERENCES
Access Economics Pty Ltd (2001) Population Ageing and The Economy. Canberra: Commonwealth Department of Health and Aged Care.
Australian Council of Trade Unions (ACTU) (2003a) A Fair Australia: Child Care Policy. http://www.actu.as.au/congress2003/draftpolicies Accessed 3/2/04.
ACTU (2003b) Work and Family Test Case – Information Material. http://www.actu.asn.au/ public/papers Accessed on 3/2/04.
Australian Broadcasting Commission (2004) Help Me, Help You. ABC News Online.
http://www.abc.net.au/news/newsitems/ Accessed 26/02/04.
Australian Bureau of Statistics (1999a) LFS Datasets.ABS Cat. No. 6291.0.40.001.
Australian Bureau of Statistics (1999b) Population Projections, Australia. ABS Cat. No. 3222.0. Australian Bureau of Statistics (2003) Child Care 2002. Cat. No. 4402.0.
Australian Bureau of Statistics (2003) Employment Services 2001/02.Cat. No. 8558.0
Australian Bureau of Statistics (2004) Australian Economic Indicators, February. Cat. No. 1350.0. Australian Industry Group (2003) Construction Outlook, October 2003.http://www.aigroup.asn.au
Accessed 05/02/04.
Australian Industry Group (2004) Australian Dollar Challenges Manufacturing Competitiveness.
http://www.aigroup.asn.au Accessed 08/02/04.
Bishop B (1999) The National Strategy for an Ageing Australia: Background Paper.Available at http://www.health.gov.au
Blöndal S, Scarpetta S (1998) The Retirement Decision in OECD Countries. Ageing Working Paper
1.4, Paris: OECD.
Bororwski A, Hugo G (1997) demographic trends and policy implications. In Borowski A, Encel S, Ozanne E, eds, Ageing and Social Policy in Australia, pp. 19–53. Cambridge: Cambridge University Press.
Burgess J, Connell J (2003) Call Centre Evolution and Development: Implications for Management and Labour.International Employment Relations Association Conference, July 2003, University of Greenwich, London, UK.
Burgess J, Macdonald D (2003) A decade of enterprise bargaining in Australia: An introduction. In: Burgess J, Macdonald D, eds, Developments in Enterprise Bargaining in Australia, pp. 1–14. Melbourne: Tertiary Press.
Burgess J, Mitchell W (2001) The Australian Labour Market in 2000. Journal of Industrial Relations
43 (2), 124–47.
Burgess J, Mitchell W, Preston A (2003) The Australian Labour Market in 2003. Journal of Industrial Relations45 (2), 125–50.
Campbell I, Watson I, Buchanan J (2002) Temporary agency work in Australia: Towards an analysis. Conference on Temporary Agency Employment. Employment Studies Centre, University of Newcastle.
Crean S (2002) A Better Way of Life for Working Families. Labor policy paper 004.
Department of Family and Community Services (2000) Participation Support for a More Equitable Society: Final Report of the Reference Group on Welfare Reform.Available at http://www.facs.gov.au
Department of Family and Community Services (DFaCS) (2001) 2001–02 Budget – What’s new, what’s different. Department of Family and Community Services, Canberra.Available at http://www.facs.gov.au
Department of Family and Community Services (2002a) Budget and additional estimates 2002–03. Department of Family and Community Services, Canberra. Available at http://www.facs.gov.au
Department of Family and Community Services (2002b) What Australians working together means for mature people. Department of Family and Community Services, Canberra. Available at http://www.together.gov.au/Publications/default.asp
Department of Family and Community Services (2003) 2002 Census of Child Care Services – Summary Booklet. Available at http://www.facs.gov.au
Eardley T (2003) Non economic perspectives on the job network. Australian Journal of Labour Economics6 (2), 317–30.
Economic Policy Advisory Committee (1988) Economic effects of an aging population. Council Paper No. 29. Canberra: Australian Government Publishing Service.
Gillion G (1998) The ILO and Pensions. ILO-OECD Workshop on Pension Reform, 15–17 December 1997, Paris, France. Available at http://www.oecd.org
Gottliebson R (2003) Triguboff’s doomsday scenario a jolt to the Reserve Bank. The Australian. 23 December, p. 24.
Guest R, McDonald I (1999) The effect of later retirement on optimal national saving in Australia. In: Productivity Commission and Melbourne Institute of Applied Economic and Social Research, eds,Policy Implications of the Ageing of Australia’s Population: Conference Proceedings. pp. 107–26. Canberra: Ausinfo.
Guest RS, McDonald IM (2000) Population ageing and projections of government social outlays in Australia. The Australian Economic Review33 (1), 49–64.
Hall, R. (2002), Labour hire in Australia: Motivation, dynamics and prospects. Conference on Temporary Agency Employment. Newcastle: Employment Studies Centre, University of Newcastle.
Henry K (2003) The Intergenerational Report 18 Months on. Social Outlook Conference Presentation, 13 November. www.treasury,gov.au/speeches/ Accessed 22/01/04.
Holzmann R (1998) A World Bank Perspective on Pension Reforms. ILO-OECD Workshop on Pension Reform, 15–17 December 1997, Paris, France. Available at www.oecd.org
House of Representatives (2000) Age Counts: An Inquiry into Issues Specific to Mature Age Workers. Canberra: The Parliament of the Commonwealth of Australia.
Indecs Economics (1995) State of Play 8.Sydney: Allen & Unwin.
International Labour Office (1995) World Labour Report 1995. Geneva: ILO.
Johnson P, Conrad C, Thomson D (1989) Workers Versus Pensioners: Intergenerational Justice in an Ageing World. Manchester: Manchester Unity Press.
Labour Hire Taskforce (2001) Final Report.Sydney: NSW Department of Industrial Relations. Lee J (2003) Formal child care services and women at work: Essential or irrelevant? In: Burgess
J, Strachan G, Sullivan A, eds, Women and Work, pp. 27–39. Employment Studies Centre Monograph 2/2003.
Leibfritz W, Roseveare D, Fore D, Wurzel E (1995) Ageing populations, pension systems and government budgets: How do they affect saving? Economics Department Working Paper No. 156. Paris: OECD.
Macfarlane I (2003a) Statement on Monetary Policy, 5 November. http://www.rba.gov.au/ mediareleases/ Accessed 04/02/2004.
Macfarlane I (2003b) Statement on Monetary Policy, 3 December. http://wwww.rba.gov.au/ mediareleases/ Accessed 04/02/2004.
Macfarlane I (2003c) Do Australian households borrow too much? Reserve Bank of Australia Bulletin.
April, pp. 7-16.
Macfarlane I (2003d) Economic Opportunities and Risks over the Coming Decades.Social Outlook Conference, Presentation, 13 November 2003. http://www.rba.gov.au/speeches/ Accessed 20/01/04.
McDonald P (2002) Issues in childcare policy in Australia. Australian Economic Review, 35 (2), 197–203.
O’Brien MJ (2000) Older Workers and Government Policy in Australia.PhD Conference in Economics and Business. November 2000, Australian National University, Canberra, Australia.
O’Brien MJ (2001a) Older male labour force participation: The role of social security and hidden unemployment. Australian Journal of Labour Economics4 (3), 206–23.
O’Brien MJ (2001b) Older males and social security reliance. In: Mitchell WF, Carlson E, eds,
The Tip of the Iceberg, pp. 135–56. Sydney: CAER.
O’Brien MJ (2001c) Patterns of Labour Force Participation and Employment of Older Males in Australia.
Paper presented to the 2001 SASE Conference, 1 July, University of Amsterdam, Amsterdam. O’Brien MJ (2003) Hidden Unemployment and Older Male Workers.Paper presented to the 5th
Path to Full Employment Conference and 10th National Conference on Unemployment, 11 December, University of Newcastle, Australia.
Organisation for Economic Co-operation and Development (2003) Maintaining a Prosperous Society – Ageing Research Project.http://www.oecd.org Accessed 26/11/2003.
Peck J, Theodore N (2002) Temped Out? Industry Rhetoric, Labour Regulation and Economic Restructuring in the Temporary Staffing Industry.Conference on Temporary Agency Employment. Employment Studies Centre, University of Newcastle, Australia.
Popple J, Martin J (2003) The Cost of Child Care.Paper presented to the Australian Institute of Family Studies Eighth Conference, Melbourne, Australia.
Preston A, Burgess J (2003a) Enterprise bargaining and macroeconomic performance. In: Burgess J, Macdonald D, eds, Developments in Enterprise Bargaining in Australia, pp. 176–94. Melbourne: Tertiary Press.
Preston A, Burgess J (2003b) Women’s work in Australia: Trends, issues and prospects. Australian Journal of Labour Economics. 6 (4), pp. 497–518.
Reserve Bank of Australia (2003) Statement on monetary policy. Reserve Bank of Australia Bulletin.
November, pp. 1–48.
Roseveare D, Leibfritz W, Fore D, Wurzel E (1996) Ageing populations, pension systems and government budgets: Simulations for 20 OECD countries. Economics Department Working Papers No 168. Paris: OECD.
Sender H (2004) dollar suffers most against currencies tied to commodities. Wall Street Journal, Eastern Edition. 9 February, p. C1.
Stegman T (1997) Implications for wages policy in Australia of the living wage case. Economic and Labour Relations Review. 8(1), 143–55.
Sullivan A, Strachan G, Burgess J (2003) Women workers and enterprise bargaining. In: Burgess J, Macdonald D, eds, Developments in Enterprise Bargaining in Australia, 158–75. pp. Melbourne: Tertiary Press.
Sydney Morning Herald (2004) Free child care – Labor’s election baby. 2 February 2004. The Economist (2004) Competitive Sport in Boca Raton. 7 February, pp. 61–63.
Toner P, Croce N, Pickersgill R, Van Barneveld K (2003) Trends in Apprenticeship and Traineeship Training in New South Wales.Sydney: NSW Board of Vocational Education and Training. Treasury (2002) Intergenerational Report 2002–03, Budget Paper No. 5, 14 May, Commonwealth of
Australia.
Ubels H (2004) Australian firms expect gains but strong currency may hurt results of foreign operations. Wall Street Journal, Eastern Edition. 3 February, p. C18.
Uren, D, Ooi T, Newman G (2004) Loan approvals still too high: Reserve Bank. The Australian, 18 February, p. 2.
Wade M (2004) Housing Market in Doldrums. Sydney Morning Herald, 14-15 February, p. 6. World Bank (1994) Averting the Old Age Crisis: Policies to Protect Old and Promote Growth. New York:
Oxford University Press.