BIOCHEMICAL GENETIC ANALYSIS OF THREE POPULATION OF MARBLE
GROUPER, Epinephelus polypekhadion
ANALISIS GENETIK BIOKIMIAWI DARI TIGA POPULASI IKAN KERAPU BATIK,
Epinephelus polypekhadion
Gusti Ngurah Permana*)♠), Haryanti*), Sari Budi Moria*), Nyoman Adiasmara Giri*), dan Ketut Sugama**)
Abstract
Genetic variations of marble groupers, Epinephelus polypekhadion were evaluated to know genetic performance of fish to support fish seed production. Fifty fish samples from three locations i.e. West Nusa Tenggara, South Sulawesi and East Java were collected for analysis. Genetic analysis has been examined through allozyme electrophoresis by using 11 enzymes (ADH, GPI, SDH, IDH, LDH, ME, PGM, 6PGD, MPI, SP, EST). The result showed that 16 loci were detected, and three of them were polymorphism enzymes namely Isocitric dehydrogenase (IDH*), Glucose Phosphate Isomerase (GPI-1*) and Esterase (EST-2*). One locus (EST-2) was polymorphic in the East Java and West Nusa Tenggara populations and three loci (EST-2, GPI-1 and IDH) were polymorphic in the South Sulawesi population. The heterozygosity ranged from 0.007 to 0.034. Rogers genetic distance between population pairs were ranged from 0.005 to 0.012 (average = 0.009). Differences between genetic populations were significant (P<0.05). East Java and West Nusa Tenggara populations have same gene pool.
Key words: allozyme electrophoretic, genetic variation, marble grouper
iiIntroduction
Introduction
Sixty three species of genus Epinephelus
have been reported by Randall (1987). At least 21 of them have commercial culture value and source of protein (Shamsudin, 1992). The marble grouper, Epinephelus polyphekhadion is widely distributed throughout the tropical and sub tropical Indo-West Pacific region, Red Sea and from East Coast of Africa to French Polynesia. Due to high economic value, this species is promoted to be cultured in Indonesia waters. Recently, aquaculture industries in Singapore and Indonesia have been interested to culture this species. The demand of grouper is rapidly increase in Asia and Pacific,
mainly Singapore, Hongkong, Taiwan and Southern China (Rimmer et al., 2004). The grouper hatcheries has been successfully developed.
There is little information available on the molecular genetics of this species. One of most advances method to estimate genetic similarity of populations is based on protein electrophoresis (Ayala, 1975). Many biochemical genetic markers have become available through the electrophoresis technique, which has revealed a large amount of molecular variation in proteins and enzymes. This paper describes electrophoretic investigation levels of genetic variability among different populations of the marble *) Research Institute for Mariculture Gondol, PO Box 140 Singaraja 81101 Bali Tel: +62-362-92349
Fax: +62-362-92349
**) Research Centre for Aquaculture, K.S. Tubun 1st, Petamburan, Slipi-Jakarta
♠) Corresponding author : E-mail: [email protected]
grouper. The results are important for future development of grouper breeding and management wild populations.
Materials and Methods
Samples collection
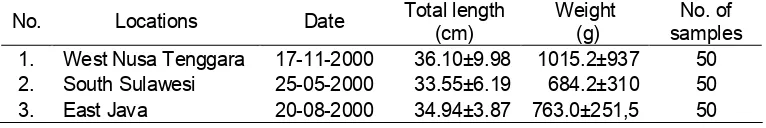
A total of 150 wild fish E. polypekhadion of 33.55 to 36.10 cm in total length range were caught from three locations in Pangkep (South Sulawesi), Lamongan (East Java) and Sumbawa (West Nusa Tenggara) (Table 1).
Biochemical techniques
Sample preparation
Samples (muscle, liver, heart and eye) for electrophoresis analysis were prepared through mechanical disruption, if the samples are not immediately analyzed, the tissue was stored in liquid nitrogen or in -40oC freezer.
Preparation of gels and buffer
Starch gels were made by boiling a mixture of 12.5% hydrolysed starch potatoes (Sigma-S.4501) and suitable buffer, tris citric acid pH-8 (TC-8) or citric acid aminoprophylmorpholine pH-6 (C-APM-6). The gels (20x13x1 cm) were cooled with ice pack during the electrophoresis. According to Whitemore (1990) for each tissue, several electrophoretic buffers should be tried, in order to determine which buffer produces best detection (intense, well separate, sharp and clear of band).
Electrophoresis
[image:2.595.98.481.664.728.2]Small filter paper (blotting paper) were dipped into the tissue (muscle, liver, heart and eye) suspension, blotted on paper
Table 1. Means of body length and body weight of marble grouper, E. polypekhadion
from different location
towell and inserted into a slit of gel. Allozyme electrophoresis is carried out at room temperature.Electric current is 40 mA/plate with CAPM-6 and TC-8 buffer. A small amount of bromophenol blue is inserted into various part or some wells as marker. This marker migrated slightly faster than protein and useful as indicator of migration.
Enzymatic staining
Enzyme analysis was done using horizontal gel electrophoresis recipes (Sugama & Prijono, 1998;Taniguchi & Sugama, 1990). Enzymes staining recipes followed Shaw & Prasad (1970). Enzymes which examined were: alcohol dehydrogen-ase (ADH), malate dehydrogendehydrogen-ase (MDH), lactate dehydrogenase (LDH), sorbitol dehydrogenase (SDH), isocitrate dehydrogenase (IDH), malic enzyme (ME), phosphoglucomutase (PGM), glucose 6 phosphate isomerase (GPI), 6-posphoguconate dehydrogenase (6-PGD), esterase (EST) and aspartate aminotransferase (AAT).
Data analysis
Deviations from expected Hardy Weinberg genotype proportions were tested by ². The genetic variation among population were tested using the software package GENEPOP (Raymond & Rousset, 1995). Loci and allele were named according to the conventions described in Allendorf & Utter (1979). Genetic distance and differentiation among samples were quantified by Rogers (1972) formula and the dendogram was constructed from the matrix genetic distance using un-weighted pair group method with arithmetic average (UPGMA) (Sneath & Sokal, 1973).
No. Locations Date Total length (cm) Weight (g) samples No. of
1. West Nusa Tenggara 17-11-2000 36.10±9.98 1015.2±937 50
2. South Sulawesi 25-05-2000 33.55±6.19 684.2±310 50
Result and Discussion
Tissue and buffer specific
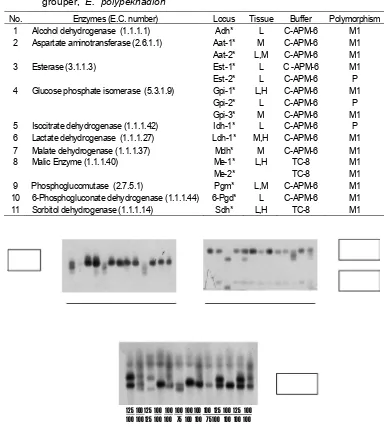
The activity of enzymes were highest in muscle and some in liver. The analyzed enzymes, presumptive loci, tissue sources, and buffer systems are shown in Table 2.
Genetic variation
[image:3.595.111.495.237.664.2]Among eleven enzymes which examined, sixteen loci were monomorphic in all three populations. Three loci, Idh* (isocitrate dehydrogenase), Gpi-1* (glucose 6 phosphate isomerase) and Est-2* (esterase) were polymorphic as showed in Fig.1.
Table 2. Specific tissue and buffer systems for allozyme electrophoresis of marble grouper, E. polypekhadion
Gpi-1
Gpi-2
125 100 75
100 90 100 90 100
90
Idh
Est-2
100 100 100 100 100 100 100 100 100 100100 100 100 90 100 100 100 90 100 100 100 100 90 100 100 100
125 100 125 100 100 100 100 100 100 125 100 125 100 100 100 125 100 100 75 100 100 75 100 100 100 100
100 100 90 100 100 100 100 100 100 100 100 100 100 100 90 90 100 100 100 100 100 100 100 90 100 100
Figure 1. Zymogram polymorphic loci of marble grouper E. polypekhadion
No. Enzymes (E.C. number) Locus Tissue Buffer Polymorphism
1 Alcohol dehydrogenase (1.1.1.1) Adh* L C-APM-6 M1
2 Aspartate aminotransferase (2.6.1.1) Aat-1* M C-APM-6 M1
Aat-2* L,M C-APM-6 M1
3 Esterase (3.1.1.3) Est-1* L C -APM-6 M1
Est-2* L C-APM-6 P
4 Glucose phosphate isomerase (5.3.1.9) Gpi-1* L,H C-APM-6 M1
Gpi-2* L C-APM-6 P
Gpi-3* M C-APM-6 M1
5 Isocitrate dehydrogenase (1.1.1.42) Idh-1* L C-APM-6 P
6 Lactate dehydrogenase (1.1.1.27) Ldh-1* M,H C-APM-6 M1
7 Malate dehydrogenase (1.1.1.37) Mdh* M C-APM-6 M1
8 Malic Enzyme (1.1.1.40) Me-1* L,H TC-8 M1
Me-2* TC-8 M1
9 Phosphoglucomutase (2.7.5.1) Pgm* L,M C-APM-6 M1
10 6-Phosphogluconate dehydrogenase (1.1.1.44) 6-Pgd* L C-APM-6 M1
Table 3. Allele frequencies and Hardy-Weinberg expectation at polymorphic loci of marble grouper, E. polypekhadion.
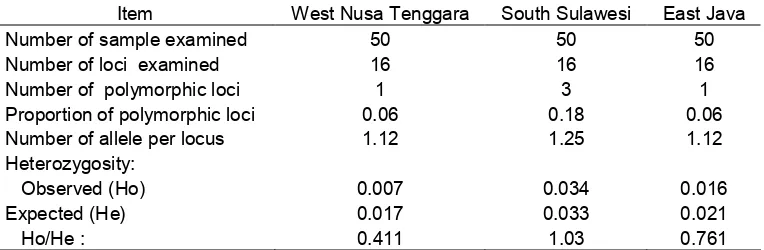
Table 4. Summary of genetic variability of marble grouper, E. polypekhadion hetero-zygosities (Ho) and number of allele per loci (Na) at polymorphic loci based on 16 loci.
Item West Nusa Tenggara South Sulawesi East Java
Number of sample examined 50 50 50
Number of loci examined 16 16 16
Number of polymorphic loci 1 3 1
Proportion of polymorphic loci 0.06 0.18 0.06
Number of allele per locus 1.12 1.25 1.12
Heterozygosity:
Observed (Ho) 0.007 0.034 0.016
Expected (He) 0.017 0.033 0.021
Ho/He : 0.411 1.03 0.761
The protein structure of Isocitrate dehy-drogenase (IDH) and glucose 6 phosphate isomerase GPI *100, GPI*90 enzyme were dimer and controlled by two allele IDH*100, IDH*90. Locus 2 of esterase en-zyme controlled by three allele Est*75, Est*100, and Est*125. Allele frequency of locus polymorphism was shown in Table 3. G-statistic (Sokal & Rohlf, 1981) for allele frequency homogenity was signifi-cantly different for three polymorphic loci (P< 0.01).
The same dominant allele at each locus was common in each populations sur-veyed. Genetic variation was consistently low in all populations (Table 4). The
pro-portion of polymorphic loci ranged from 0.060 to 0.180 (average : 0.10) and the number of allele per locus ranged from 1.12 to 1.25 (average : 1.16). Average of ob-served heterozygosity was 0.019. Ratio Ho/He population of South Sulawesi more than 1 indicated that genetic variation higher than other population. If compared to milkfish from natural population which having locus polymorphic proportion of 48%, amount of allele per locus (1.52) and heterozygosity (0.045) (Permana et al., 2001a), and humpback grouper (Ho : 0.089) (Permana et al., 2001b), marble grouper had very low genetic variation (av-erage : 0.019).
Allele frequency
Enzymes Allele
West Nusa Tenggara South Sulawesi East Java
B 1.000 0.930 1,000
C 0.000 0.070 0.000
Gpi-1*
² 0.000 0.000 0.000
B 1.000 0.970 1,000
C 0.000 0.030 0.000
Idh*
² 0.000 0.000 0.000
A 0.158 0.122 0.097
B 0.842 0.847 0.806
C 0.000 0.031 0.097
Est-2*
[image:4.595.101.483.582.707.2]According to Grant et al. (1981), the difference of allele frequency of marine fish populations was resulted from the action of three forces, i.e. migration, random genetic drift and natural selection. They also suggested that little or no genetic variation was expected between populations of marine fishes due to high potential for gene flow between populations. The genetic difference of marble grouper in this study could be explained by the lack of migration or gene flow particularly between populations of South Sulawesi and the others (East Java, West Nusa Tenggara). Those locations were isolated from others by geographical distance. Consequently there was no genetic differentiation observed between East Java and West Nusa Tenggara.
The genetic difference among West Nusa Tenggara population, East Java and South Sulawesi populations is caused by habitat which an individual, poly settles is genetically determined. That is alternative genotypes preferentially settle in different habitat such as in Bali Sea and Sulawesi Strait. The genetic distance was computed according to Rogers (1972).
Genetic distance of population between West Nusa Tenggara and East Java was shorter (0.005) compare to South Sulawesi population (genetic distance value 0.0115) (Figure 3). The mean Fst values of three polymorphisms loci of 0.145 indicated that about 14% of the total gene diversity observed was due to population differentiation and almost 86% was due to variation among individuals within species. Based on this finding the authors propose to use the parent from South Sulawesi to
minimize the lost of genetic variation in fish breeding.
Conclusions
Fish population at South Sulawesi has higher genetic variation (0.034) than population of West Nusa Tenggara (0.007) and East Java (0.016). East Java and West Nusa Tenggara populations have same gene pool with closely genetic distance (0.005) and South Sulawesi population has far genetic distance value (0.0115).
Acknowledgement
The authors wish to thank Dr. Adi Hanafi as a Director of Gondol Research Institute for Marineculture and also thank to Dr. Gede Sumiarsa as GRIM manuscript evaluator made helpful comments on earlier draft and critically reviewing the manuscript.
WEST NUSA TENGGARA
EAST JAVA
SOUTH SULAWESI
0.005
0.0115
Figure 3. Genetic distance of marble grouper, E. polypekhadion
References
Allendorf, F.W. and F.M. Utter. 1979. Population genetic. In: Fish physiology Vol. VII. W.S. Hoar, D.J. Randall, and J.R. Bred (Eds.). Academic Press. New York. San Francisco London: 407-454.
Ayala, F.J. 1975. Genetic differentiation during the speciation process. Evol. Biol. 8: 1-78.
Rogers, J.S. 1972. Measures of genetic similarity and genetic distance. In: Studies in genetics. VII. M.R. Wheeler (Ed.). Univ. Texas Publ. 7213. 354 p.
Sneath, P. H. and R.R. Sokal. 1973. Numerical taxonomy. Freeman and Co. San Francisco, California. 859 p.
Sokal, R.R. and R.G. Rohlf. 1981. Biometry. Freeman and Co. San Francisco. California. 776 p.
Sugama, K. and A. Prijono, 1998. Biochemical genetic differentiation among wild population of milkfish,
Chanos chanos in Indonesia. IFRJ. IV. (I): 11-19.
Shamsudin, L. 1992. Akuakultur pinggir laut. Dewan Bahasa dan Pustaka. Kuala Lumpur. 395 p.
Taniguchi, N. and K. Sugama. 1990. Genetic variation and populations structure of red sea bream in the coastal water of Japan and in the East China Sea. Bull. JPN. Soc. Sci. Fish, 56:1069-1077.
Whitemore, D.H. 1990. Electrophoretic and isoelectric focusing techniques in fisheries management. CRC pres inc. Boca Raton, Florida. 158-169. Permana, G.N., S.B. Moria, Haryanti, and
K. Sugama. 2001a. Effect of domestication on genetic variability to determine the growth of milkfish,
Chanos chanos using allozyme electrophoresis. Proceeding of Mariculture Technology and Sea Farming Development, March 2001. Jakarta.: 149-158.
Permana, G. N., S.B. Moria, Haryanti, and K. Sugama. 2001b. Effect of domestication on genetic variability of humpback grouper, Cromileptes
altivelis using allozyme
electrophoresis. Indonesian Fisheries Research Journal. 7 (1): 24-30.
Randall, J.E. 1987. A preliminary synopsis of the grouper (Perciformi: Serranidae: Epinephelinae) of Indo-Pacific region. In : Tropical Snapper and Groupers: Biology and Fisheries Management. J.J. Polovina, and S. Ralston (Eds.). : 89-169.
Raymond, M. and F. Roussset. 1995. GENEPOP (Version 1.2); Population genetic software for exact test and ecumenicism. J. Hered. 86:248-249.