FISH FARMER’S ATTITUDE BASED ON PRODUCTION RISK OF TIGER GROUPER, Epinephelus fuscoguttatus GROWING IN FLOATING NET CAGES
IN LAMPUNG GULF
SIKAP PETANI IKAN TERHADAP RESIKO PRODUKSI PEMBESARAN KERAPU
MACAN Epinephelus fuscoguttatus DALAM KARAMBA JARING APUNG
DI PERAIRAN TELUK LAMPUNG
Tajerin)
This study was aimed to investigate fish farmer’s attitude on production risk of Epinephelus fuscoguttatus growing in floating net cages, and to evaluate the impact of input usage on the production risk.The production risk explicitly assumed, reflected in the variability of E. fuscoguttatus production.The study used the case of fish farmer’s production of grouper growth out in floating net cages in Lampung Gulf, Lampung Province as an analysis unit. The respondent of fish farmers were obtained by census method.The analysis result suggested that the fish farmers were risk-averters toward fish seed, fish feed and human labor input. It also appeared that fish seed and fish feed were risk-inducing inputs while the amount of human labour was a risk-reducing input. Fish farmer’s attitude that avoid of the usage of human labour, more considered by decreased effort efficiency which was affected by increasing the amount of human labor whereas production level tend to remained or lower. However by the level domination of adequate E. fuscoguttatus culture technique which owned by the human labour, the usage of human labor could be act as “risk-reducing”.
Key words: Epinephelus fuscoguttatus, floating net cages, fish farmer’s attitude, production risk
Introduction
As a business oriented activity, the main goal of Epinephelus fuscoguttatus growing in floating net cages is to maximize profit by increasing production. Thus, fish farmers must have the ability to acquire opportunities, and manage both fix and variable inputs, so that they will be able to get the desired goal.
Getting the maximum profit is a matter of deciding what the optimum combination of inputs is. The fish farmers’ attitude in optimizing inputs usage is usually done in two ways, (1) by constrained output maximization, and (2) by constrained cost minimization. Thus, the fish farmers must
be able to manage and control both internal factors (seed, feed, labour, area size, equipment, and investment capitals) and external factors (water temperature, rain intensity, and water condition) affecting their business (Purwati & Azhari, 1986).
Fish farmer’s attitude on optimization inputs usage will considerably affect their production decision-making process. The decision made is mainly concerned with the production inputs factors combination, and the consequences of such decision towards the yields and risks. Therefore fish farmers must be able to oversee the possibilities concerning their business that they may encompass in the future (Sharma, 1989).
Abstract
) Center Research of Socio Economic of Marine and Fishery, Jl. KS. Tubun, Petamburan VI – Slipi, Jakarta. E-mail: [email protected]
In fish farming, production risk is related closely to individual attitude of fish farmers on the risk itself, reflected on their production inputs factors combination decision (Kay, 1986). It appears that there is a tendency of difference in fish farmer’s attitude towards the production risk that they are facing. Some farmers are more risk-taking than the others; therefore they are much more open and innovative to new inputs which will possibly raise their business and income (Hakehana & Halcohn, 1986). This phenomenon illustrates that fish farmers attitude towards production risk may pose a crucial threat especially towards planning on fish farming activity and decision making by fish farmers. Therefore there is an urgent need for a study on fish farmer’s attitude towards production risk.
This study was aimed to explicitly show fish farming attitude towards production risk of E. fuscoguttatus growth out culture in floating net cages, reflected in varied production yielded by fish farmers, and to analyze the impacts of inputs usage on production risk.
Materials and Methods
Determining location, sampling and data collecting
This study used E. fuscoguttatus farmers in floating net cages in Lampung Province as respondents. The case in this study was to get detailed condition of the background, and the specific character-istic of a case and put it into a common thing (Natsir, 1988).
Up to then, E. fuscoguttatus growing activity was still concentrated around the gulf of Lampung, which was ad-ministratively part of Padang Cermin Sub District of South Lampung District. As the location was the only production centre of E. fuscoguttatus growing in floating net cages in Lampung Province, the area was chosen as a sample area. Furthermore, fish farmer respondens were determined
by census methods as the relatively small population of fish farmer in this sample area, which were as many as 34 fish farmers.
Literature review and models analysis In many literatures, the subjects on risk were not yet very solid and the approaches used and empirical studies were quite diverse ranging from normative to positive studies, from descriptive to prescriptive analysis, and from subjective to objective models, even though the distinctions were not wide. Risk models could be classified into three classes of decision making rules, namely: (1) decision making rules required information with no probability, (2) decision making rules which put a stressed on security, (3) decision making rules which maximized utilities. Empirical studies of risk handling could be classified into five categories: (1) direct elicitation of utility function (DEU), (2) risk efficiency approach, (3) risk interval approach, (4) experimental methods, and (5) observed economic behavior (OEB) (Hallam et al., 1982; Moscardi de Janvry, 1977; Just & Pope, 1979a; 1979b). In this paper, OEB approach was the method applied to the data acquired.
Application of traditional production function forms such as the Cobb-Douglas requires the prerequisite of additive or multiplicative random error terms, which constrains the variability effect of input usage greatly (Just & Pope, 1979a; 1979b). Naturally, some inputs might have decreasing effect on production risk (measured by the variance of output distribution). However, traditional specifications did not allow for a possibility that higher outputs may also be a function of input used as had been demonstrated by Day (1976), Anderson (1973), Roumasset (1976), Just & Pope (1979a; 1979b), and Antle & Goodger (1984).
flexible stochastic specification as follows:
i
i
ii f X g X u
y ; ; ……….. (1)
where
K
k k
i
X
kX f 1 0 ;
K k ki
X
kX g
1 0
;
In addition, it was assumed that
E(ui) = 0, Var (ui) = 1, and Var {g(Xi; )ui} = i2
This would allowed for a relation between uncertainty and inputs not solely determined through the relationship of input and expected output. Moreover, the term g(Xi; ) ui was possibly the
homogenity allowing sufficient flexibilities such that the signs and magnitudes of ggi
and gjgjj (gi and gii denote the first and
second derivative of g with respect to i were not predetermined a priori and so input with decreasing risk effect could be tested.
The marginal effect of input usage on production variability could be derived as:
iK
k k
i X Var u
y Var k 2 1 0
…… (2)
and i k K k k K k k k
i Varu
X X X X y Var k k 2 1 0 2 1 0 2 …(3)
Equation (1) was estimated through a three-stage procedure in order to yield asymptotically efficient estimates as outlined by Pope & Just (1979a). The estimation steps were:
Step 1: A nonlinear regression of yi on
Step 3: A non-linier regression on
;ˆ 2 / 1 * i i i yg Xy on
;ˆ
*i
X
f
;ˆ
1/2
;ˆi
i g X
X
f
f(Xi; ) obtaining
ˆ
Step 2: An ordinary least square (OLS) regression of
22
* ;ˆ
i i
i Ln y f X
Lnu
on Ln Xi obtaining ˆ
Having estimated these equations, the next issue was to compare the optimal input use under the corresponding production functions. For the production risk model with linier mean-variance utility of profit and no price uncertainty, factor demand equations could be derived as follows (Anderson et al., 1977; Just & Pope, 1979a; Hallam et al., 1982):
k k K k k k k kk w Varu e
P X w y PE X k
2 2 1 0 2 ...(4) Where:
= Is risk aversion coefficient (that is
> 0 represents risk-aversion,
= 0ek = disturbance term such that E(ek) = 0 risk-neutrality, and
< 0 preference/risk-lover, respectively) wk = the price input k1 21 21 11 11 01
1 Z Z e
X
2 22 22 12 12 02
2 Z Z e
X ……… (5)
. . . . . . . . . . . . K K K K K K
K Z Z e
X 0 1 1 2 2
The complete system of factor demand equations would then be written as:
Where:
k k aPEw y
Z1 and
k k wbP
Z2 2 2
Where:
ˆkfrom Cobb-Douglas production a =
ˆkfrom Just-Pope production function
b= ˆk From Cobb-Douglas production
K X Vare
k k
k 2
1 0
ˆ
u Var XK
k k
k 2
1 0
ˆ
function
function
ˆ From Just-Pope production
The risk elasticity for Cobb-Douglas (6) and Just-Pope (7) models derived from Cobb-Douglas production function and Just-Pope production function as follows: (1) For Cobb-Douglas function,
eui i
X
y 0
i
ui Var e
X y
Var 0 2
i ii Var y
X X
y
Var
2
…....(6)
(2) For Just-Pope model
u
i i i
i X
X
y
0
0
i
ui Var e
X y
Var 0 2
i i i Var y
X X
y
Var
2
…...(7)
Result and Discussion
The first step in the estimation of production risk model was by applying Cobb-Douglas production function through its log linear transformation. The model was estimated by ordinary least square (OLS), and estimation results are summarized in Table 1. All of factors of production coefficients were statistically significant in data sets and all coefficients had the expected positive signs. We anticipate that for any percentage increase in a factor of production, ceteris paribus, there would be a percentage increase in yield. With respect to dis-infectans expensed, the sign was negative
but relatively very small and not statistically significant. The insignificance of labour and disinfectans expenses in production was probably dictated by the uncommon application of the factor in the sample farmers.
Table 1. Estimated coefficient of production function for Cobb-Douglas
Remarks:
- Numbers in parentheses are respective asymptotic t-ratios * Significant at 0,01 = 1,645 ** Significant at 0,01 = 1,960 *** Significant at 0,01 = 2,576
The second step, specification estimated was the hetero-scedastic model of Just & Pope type (1979a;1979b). The estimations of mean production are summarized in Table 2. Comparing with the results from the previous alternative, the estimations were quite different. All estimates were statistically (and asymptotically) significant.
Specific to the Cobb-Douglas production type, these estimates were also designated to the elasticity’s of mean production with respected to the corresponding factors of production. By using the nonlinear or hetero-scedastic estimation results, one percent increase in each factor of production of fish seed, fish feed and human labor, respectively, other things remaining constant, would cause a 0.13, 0.04, 0.09 percent increase in yield.
The next important aspect had to be considered was relationship between the
Factor of production Coefficients Intercept
Fish seed
Feed seed
Human labour
Table 2. Estimated coefficient of mean of production for Cobb-Douglas model
Remarks:
- Numbers in parentheses are respective asymptotic t-ratios * Significant at 0,01 = 1,645
** Significant at 0,01 = 1,960 * ** Significant at 0,01 = 2,576
level of inputs and the variance of production as could be deduced from the Cobb-Douglas and the Just-Pope model. We hypothesize that the coefficients associated with human labour, and chemicals expenses, had a risk-reducing effect on the variance of the production.
The amount of human labour spent during the production process was considered to made production more stable to a certain level, especially if it was given at the right time. The same argument holds for fish feed expensed. A fish farmer would be willing to spent additional money for fish feed expecting that production level would become more certain than it would be. Again, this assumption would be true if the timing for application of fish feed was right during the culture.
For fish seed, the coefficients were expected to be positive indicating the risk-inducing effect. As pointed out in the previous section, these inputs were thought to be making production yield more susceptible to environmental condition.
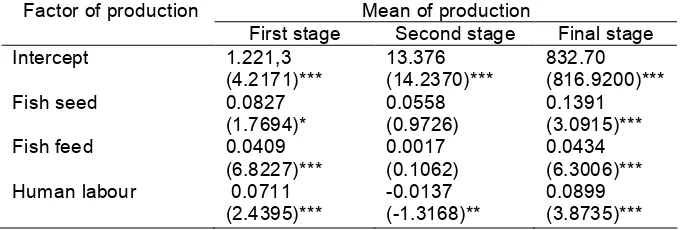
Table 3 showed the coefficient estimates for the Just-Pope model (the corresponding result for the Cobb-Douglas model were not presented because it could be shown
that the magnitude of variance given by the model were very huge and giving interpretation for them was difficult). Table 3 shows that fish seed and fish feed pick up the correct negative sign both showing the risk-inducting factor but again it fails to show the risk-reducing effect to human labour.
Table 3. Estimated coefficient of production function for Cobb-Douglas and Just-Pope
Remarks:
- Numbers in parentheses are respective asymptotic t-ratios * Significant at 0,01 = 1,645 ** Significant at 0,01 = 1,960 *** Significant at 0,01 = 2,576
Mean of production Factor of production
First stage Second stage Final stage Intercept
Fish seed
Fish feed
Human labour
1.221,3 (4.2171)*** 0.0827 (1.7694)* 0.0409 (6.8227)*** 0.0711 (2.4395)***
13.376 (14.2370)*** 0.0558 (0.9726) 0.0017 (0.1062) -0.0137 (-1.3168)**
832.70 (816.9200)*** 0.1391 (3.0915)*** 0.0434 (6.3006)*** 0.0899 (3.8735)***
Factor of
production Variance of production Intercept
Fish seed Feed seed Human labour
13,487 (14,3480)***
0,5669 (6,0837)***
0,3773 (2,6081)***
-0,2534 (-0,1248)
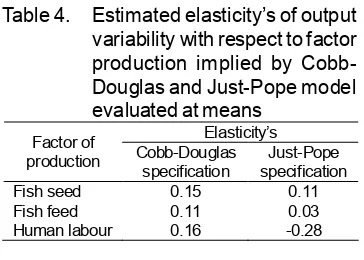
Just-Pope models these elasticity’s are shown in Table 4. The magnitude of estimated elasticity of Cobb-Douglas and Just-Pope model were very close to one another but they were derived from different means of production functions. The signs elasticity in Cobb-Douglas function were already determined in the mean production functions unintentionally while the sign of elasticity’s in Just-Pope model were free from the result of the mean production functions due to the fact that the mean and the variance functions were allowed to be independent from one another. In other word, we could still have an input having positive marginal product but negative marginal risk.This was one of the advantages of using Just-Pope model as outlined in previous section.
[image:6.595.98.280.497.627.2]Turning to the results from Table 4 of Just-Pope model, a one percent increase in the use of fish seed and fish feed, ceteris paribus, results in 0.01 and 0.03 percent increase in the variance of production.The opposite for human labor, a one percent increase in the use of human labor, ceteris paribus, result in 0.28 percent decrease in the variance of production.The same thing could be applied to other remaining estimate elasticity’s.
Table 4. Estimated elasticity’s of output variability with respect to factor production implied by Cobb-Douglas and Just-Pope model evaluated at means
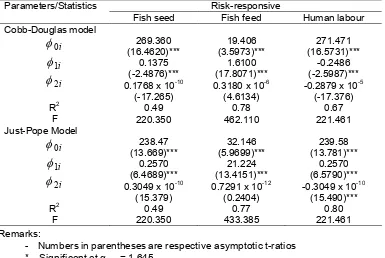
were analyzed. In each model, two varieties were considered, that was, risk-responsive case and risk-neutral case, where risk-neutral was risk-responsive varieties with risk coefficient equal zero. Only two major inputs were considered because the same interpretation could be applied to other inputs.
Most of the coefficients in the input-used equations were statistically significant. In addition, almost in all case, the coefficient of 1i was statistically different from one as implied by the models. Furthermore, the coefficient of 2iwas also statistically,,
significantly different from zero excluding that of nitrogen demand on risk-responsive Just-Pope model. Recalling from equation (4) through (7) by the implication assuming that the models were true, this coefficient measures the risk aversion parameter for particular input. In Table 5. It was found that the coefficient ranges is from 0.12 x 10⁻⁹ to 0.80 x 10⁻⁷ for fish seed and from
0.62x10⁻¹² for 0.21x10⁻⁶ for fish feed and
from -0.17x10⁻⁵ to 0.30x10⁻¹⁰ for human
labour.
However, the results from this analysis had to be taken with caution. Two notes must be in order: (1) the implicit assumption that the amount of input use was solely a function of two “aggregate” variables might not be realistic, (2) the clear departure from the assumption that 1iand 2i=1 that
must be imposed as in equation (6) and (3) the possibility of conflicting inter-pretation of the risk aversion coefficients derived for each input. Hence, those input-used equations have to be interpreted carefully.
In term of human labor input, the sign of the coefficient were in the range from negative to positive for rainy season data and always negative for dry season data. Therefore, it would be saving to conclude that risk coefficient sign for human that farmers were also risk-averter toward labor.
Elasticity’s Factor of
production Cobb-Douglas specification specification Just-Pope Fish seed
Fish feed Human labour
0.15 0.11 0.16
0.11 0.03 -0.28
Table 5. Estimated coefficients of implied input-use equations for Cobb-Douglas and Just-Pope model
Remarks:
- Numbers in parentheses are respective asymptotic t-ratios * Significant at 0,01 = 1,645
** Significant at 0,01 = 1,960 *** Significant at 0,01 = 2,576
Conclusion and Suggestion
Conclusion
This paper performs two alternative production specifications of estimating mean production function and implication of the estimation on the variance of production. The specifications are Cobb-Douglas and Just-Pope models. The mean production estimate of each model gives very different results. In spite of the possibility that they may result in the same positive marginal products of inputs as we expected, the implication of each model on the effect of input on the variability of output may be quite different.
Based on the Just-Pope model, the model that can separate the effect of inputs on mean production and variance of product-ion, the elasticity’s of output with respect to inputs fish seed, fish feed and human labour expense are 0.11, 0.03 and -0.28
respectively. Furthermore, the model confirms that, human labour input behaves as risk-reducing factors while other factors of production perform risk-inducing effects, such as fish seed and fish feed. These risk aversion coefficient, the estimates of production functions are true, are ranging from 0.12 x 10⁻⁹ to 0.80 x
10-7 for fish seed and from 0.62x10⁻¹² for
0.21x10⁻⁶ for fish feed and from -0.17x10⁻⁵
to 0.30x10⁻¹⁰ for human labour. Therefore,
it is probably suggesting that the sample farmers are risk-averter on fish seed, fish feed and human labour.
Suggestion
Be considerate the fish farmer’s still have a certain attitude as risk-averter on using inputs of fish seed, fish feed and human labour, where they need the efforts from policy maker to make condition grow for push the fish farmer’s increase courage to face on production risk surface possibility,
Risk-responsive Parameters/Statistics
Fish seed Fish feed Human labour Cobb-Douglas model
i
0
i
1
i
2
R2
F
269.360 (16.4620)***
0.1375 (-2.4876)*** 0.1768 x 10⁻¹⁰
(-17.265) 0.49 220.350
19.406 (3.5973)***
1.6100 (17.8071)*** 0.3180 x 10⁻⁶
(4.6134) 0.78 462.110
271.471 (16.5731)***
-0.2486 (-2.5987)*** -0.2879 x 10⁻⁵
(-17.376) 0.67 221.461 Just-Pope Model
i
0
i
1
i
2
R2
F
238.47 (13.669)***
0.2570 (6.4689)*** 0.3049 x 10⁻¹⁰
(15.379) 0.49 220.350
32.146 (5.9699)***
21.224 (13.4151)*** 0.7291 x 10⁻¹² (0.2404)
0.77 433.385
239.58 (13.781)***
0.2570 (6.5790)*** -0.3049 x 10⁻¹⁰
until change the fish farmer’s attitude from risk-averter to risk-reverence/risk lover.
References
Anderson, J.R. 1973. Sparse data, climate variability and yield uncertainty in response analysis, American Journal of Agricultural Economics. 55 (1): 77-83.
Anderson, J.R., L. Dillon, and J.B. Hardaker. 1977. Agricultural decision analysis. Iowa State University Press. Ames. Iowa. 234-372.
Antle, J.M. 1983. Testing the stochastic structure of production: a flexible moment: based approach. Journal of Business and Economic Statistics. 1 (3): 192-201.
Antle, J.M. and W.J. Goodger. 1984. Measuring stochastic technology: the case of tulare milk production. American Journal of Agricultural Economics. 66 (3): 342-350.
Barry, P.J.1984. Risk management in agriculture. Iowa State University Press. Ames, Iowa. 117-192.
Hakehana, W.G. and B.C. Halcohn. 1986. Agricultural policy uncertainty and the risk averse firm. European Review of Agricultural Economics. 7(4): 395-411.
Hallam, J.A., R.E. Just, and R.D. Pope. 1982. Positive economic analysis and risk considerations in agricultural production. In: New direction in econometric modeling and forecasting in U.S. Agriculture. G.C. Rauser. (Ed.). New York: North-Hulland. 203-226.
Moscardi, E. and A. de Janvry. 1977. Attitudes toward risk among peasants: an econometric approach.
American Journal of Agricultural Economics. 54 (9): 710-716.
Just, R.E. and R.D. Pope. 1979a. On the relationship of input decision and risk. In: Risk, uncertainty and agricultural development. Roumasset, Boussard, and Sigh. (Eds.). SEARCA and ADC, Laguna.Philippines. 37 p.
Just, R.E. and R.D. Pope. 1979b. Production function estimation and related risk consideration. American Journal of Agricultural Economics. 6 (2): 111-118.
Kay, R.D. 1986. Farm management planning, control and implementation. Mc. Graw Hill International Book Company. New York. 55-68.
Purwati, H.S. dan Azahari. 1986. Pola usaha tani dalam usaha optimasi penggunaan sumberdaya pertanian (kasus optimasi penggunaan masukan dalam usaha tani padi sawah di Jawa). Pusat Penelitian Agro Ekonomi. Badan Penelitian dan Pengembangan Pertanian. Departe-men Pertanian Republik Indonesia. Bogor. 38 p.
Roumasset, J. A. 1976. Rice and risk: decision making among low-income farmers. Amsterdam. North-Holland. 212-304.
Roumasset, J.A. 1979. Risk aversion indirect utility function and market failure. In: Risk uncertainty and agri-cultural development. J.A. Raumasset, G. Feder, and D. Zilbermen (Eds.). International Rice Research Institute, Los Banos, Philippines. IRRI Research Paper Series No.3: 93-113.