Brent Sandstone Reservoir Porosity Mapping using Acoustic
Impedance Inversion and Geostatistical Method Sequential
Gaussian Simulation in FS Field
MUHAMMADFAHMI1), ABDULHARIS2,*), TAKESHIKOZAWA2)
1)Post Graduate Master of Reservoir Geophysics Program, Department of Physics, Mathematics
and Science Faculty, University of Indonesia, Depok, West Java E-mail: [email protected]
Department of Physics, Mathematics and Science Faculty, University of Indonesia, Depok, West Java
ABSTRACT: FS Field which is geologically located in northern part of North Sea Basin had a complex structure. It can lead to uncertainty in mapping of Brent group sandstone reservoir. Brent group sandstone reservoir consist of 5 main formation, Tarbert, Ness, Etive, Rannoch and Broom which is known as deltaic reservoir. This study conducted to evaluate porosity distribution map of Brent reservoir based on acoustic impedance inversion result and geostatistical method sequential gaussian simulation using 3D seismic PSTM, 4 wells complete with well log, geological marker and well report data. The results show the porosity map distribution of Brent reservoir using acoustic impedance inversion results had a comprehensive distribution than using geostatistical method sequential gaussian simulation.
Keyword : Acoustic Impedance Inversion, Sequential Gaussian Simulation, Porosity Distribution Maps.
INTRODUCTION
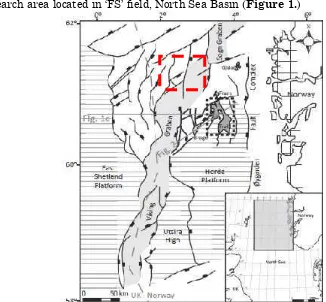
FS Field which is geologically located in northern part of North Sea Basin had many oil and gas field in rifting system of North Sea Basin. Regional geology of FS field had a complex geological structure which is consist of many major fault north-south trend causing formation of graben structure in FS field.
Seismic interpretation process is expected to be accurately find out subsurface condition in order to oil and gas field development. Inversion seismic using acoustic impedance parameter is one of geophysical method that can show rock density layer formation, (Lindseth, 1982). Acoustic impedance value is influenced by wave velocity value in rocks that have certain trends towards other influence parameter such as porosity.
Reservoir modelling aims is to mapping rock porosity of Brent sandstone reservoir in FS field using approach results acoustic impedance inversion result and geostatistical method sequential gaussian simulation (SGS). It is expected to minimize error that occurred in Brent sandstone reservoir mapping process.
RESEARCH METHODOLOGY
Research area located in FS field, North Sea Basin (Figure 1.)
Figure 1. Research area in FS field location map, North Sea Basin is shown by the red box (Fraser et al.,2002)
Here is the data used in this research : 1. Seismic Data
Table 1. 3D Seismic Data Specification
No. Specification Seismic Data
1. Total Inline 2845
2. Total Xline 2145
3. Bin Size 25 x 25 m
4. Record Length 6000 msec 5. Sampling Interval 4 msec
6. Coordinate System Zone 31 N UTM
2. Well Data
In this research had 4 well consist of well S-1, R-1, D-2 and A-3. Well log data availability shown inTable.2.
Table 2. Well Data Avalaibality
No. Data S-1 R-1 D-2 A-3
1. Gamma Ray Log - V V V
2. Resistivity Log - V V
-3. Density Log - V V V
4. Neutron Porosity Log - V V V
5. Sonic Log - V V V
6. Caliper Log - V V
-7. Well Report - V V V
8. Composite Log V V V V
9. Checkshot - V V V
10. Geological Marker - V V V
Remarks - Not available
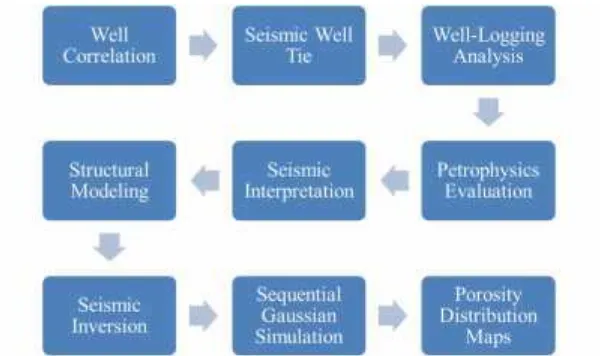
Flowchart in this research shown inFigure 2.:
Figure 2. Brent reservoir porosity distribution mapping flowchart.
1. Well Correlation
In this stages, for well R-1, D-2 and A-3 that had well log and geological marker data will used for well correlation analysis. This is focused correlation on depositional environment process, time depositional, lithology and thickness of every main formation of Brent reservoir.
2. Seismic Well Tie
In this stages, seismic data in time domain will tie with well data in depth domain. Wavelet and checkshot data used for this seismic well tie analysis. There are 3 wavelet that tested in this stages, ricker wavelet with specify dominant frequency, statistical wavelet extract from seismic data near well data and use well wavelet. The best correlation wavelet in this research is using statistical wavelet extract from seismic data near well R-1. Window correlation of seismic well tie analysis focusing on main formation of Brent reservoir and got the best well seismic tie correlation value is 0,8.
3. Well Logging Analysis
Well log data analysis conducted to determine zona interest of Brent sandstone reservoir. Gamma ray log can help to determined for sand or shale lithology, in this research using sand base line 35 API and shale base line is 90 API. Crossover between density and neutron porosity log can help to determined specified zona interest of Brent sandstone reservoir that include any hydrocarbon. Resistivity log can help to determined for hydrocarbon content, oil, gas or water, low resistivity more likely include water zone.
4. Petrophysics Evaluation
After well log analysis, petrophysical evaluation is needed to calculate and evaluate property of Brent sandstone reservoir such as Vshale content, water saturation, total porosity and effective porosity.
The result of seismic well tie analysis is important for seismic interpretation process. In this stage, picking horizon and fault in FS field using 3D seismic data. There are 3 main horizon consist of top brent, mid brent, base brent and 4 major fault north-south trending that picked in this process.
6. Structural Modeling
Horizon and fault picking result used in structural modeling process. The result of this stages is horizon model, fault model, time structure map and structural model.
7. Seismic Inversion
Seismic inversion analysis is this research using acoustic impedance model based method. Input of this process is horizon model, wavelet and well log data from previous stage. This inversion process using iteration 20 times with constrained value from model inversion is 25 % and gate window from 1500 4500 msec. From acoustic impedance value can convert to porosity value using relation between acoustic impendace and porosity with trend formula. Porosity value is inversely from acoustic impedance value.
8. Sequential Gaussian Simulation
Input of this process is porosity property from petrophysical evaluation in previous stage. The porosity value from every well data scaled up and distributed with sequential gaussian simulation method. Porosity mapped distribution is output of this process.
9. Porosity Distribution Maps
Porosity distribution maps obtained from two methods, approach of acoustic impedance inversion result and sequential gaussian simulation method. This two porosity distribution maps analyzed and evaluated to got minimum error for porosity property modeling maps.
RESULT AND DISCUSSION Acoustic Impedance Maps
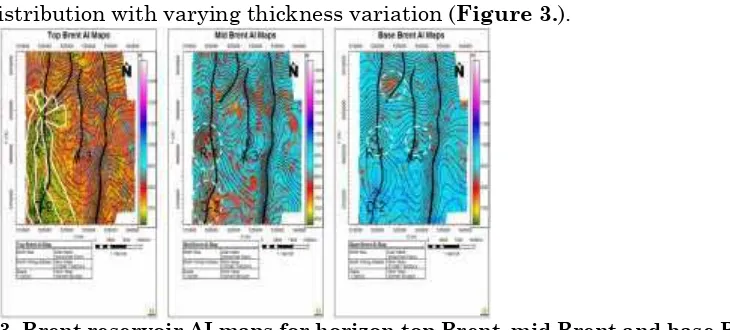
On the horizon top Brent, mid Brent and base Brent extraction of acoustic impedance (AI) result using model based with window gate 50 msec above horizon and 50 msec below horizon. From the petrophysical evaluation result top Brent had a low to medium AI sand with range AI value is from 6.500 9.000 (gr/cc)*(m/s) and from AI maps distribution with varying thickness variation (Figure 3.).
Figure 3. Brent reservoir AI maps for horizon top Brent, mid Brent and base Brent.
thickness caused of many major fault north-south trending. Regarding this AI maps, Brent reservoir in FS field had a channel deltaic feature.
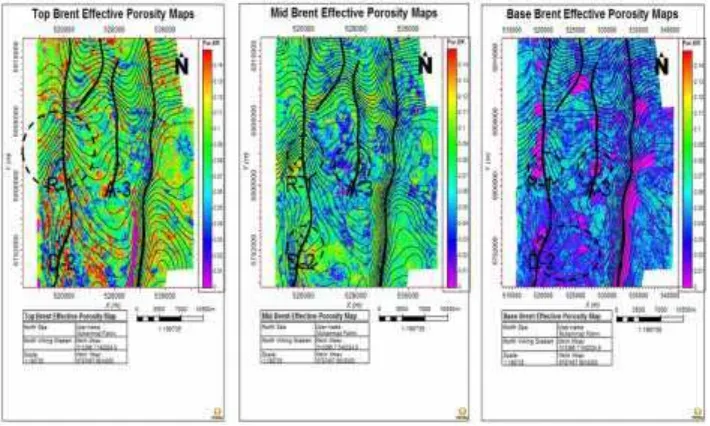
Porosity Maps from AI Maps
Acoustic impedance and porosity had a inverse relationship. Regarding AI value result and relationship formula between AI and porosity, porosity maps obtained from AI value that convert to porosity value using relationship formula :
Effective Porosity = -2,831 x 10-5x AI + 0,367431 (1)
Porosity maps (Figure 4.) from AI maps on horizon top Brent, mid Brent and base Brent had a similar feature condition like AI maps. It is because porosity maps obtained from AI maps. The southern to western area of FS field had low AI value, so that the porosity value in porosity maps from AI maps had a high value and for northern part to eastern part area of FS field had a high AI value and porosity value in porosity maps from AI maps had a low value. The distribution of AI and porosity value is one of the consideration for development oil and gas field.
Figure 4. Brent reservoir Effective Porosity maps from AI maps for horizon top Brent, mid Brent and base Brent.
Comparison Porosity Maps from AI maps and SGS maps
. Figure 5. Brent reservoir Effective Porosity maps from SGS maps for horizon top
Brent, mid Brent and base Brent.
CONCLUSION
1. FS Field complex structure consist of 4 mayor faults north-south trend and formed graben structure
2. Brent sandstone reservoir had acoustic impedance value between 6.500 8.500 (gr/cc)*(m/s)).
3. Porosity maps which is constrained by acoustic impedance result had more comprehensive distribution compared to porosity maps from geostatistical methods sequential gaussian simulation.
4. Porosity maps distribution from geostatistical methods sequential gaussian simulation need more well data to get better porosity distribution.
REFERENCE
Barnes, A. E, 1999,Seismic Attributes: Past, Present, and Future, Tulsa, USA: Society of Exploration Geophysics Expanded Abstracts
Brown, A., 2004, Interpretation of Three-Dimensional Seismic Data Sixth Edition, The American Association of Petroleum Geologists and the Society of Exploration Geophysicists, Dallas, Texas
Christiansson, P., J. I. Faleide, et al, 2000, Crustal structure in the northern North Sea:
An integrated geophysical study, 167: 15-40.
Cornford, C., 1998, Source rocks and hydrocarbons of the North Sea, in K. W. Glennie, ed., Petroleum geology of the North Sea: Basic concepts
Fraser, S.I., Robinson, A.M., Johnson, H.D., Underhill, J. & Kadolsky, D., 2002, Upper
Jurassic. In: Evans, D., Graham, C., Armour, A. & Bathurst, P. (eds) The
Millennium Atlas: Petroleum Geology of the Central and Northern North Sea,
Geological Society, London, 157 189
Gabrielsen, R. H., (1986), "Structural elements in graben systems and their influence on hydrocarbon trap types ( Norwegian continental shelf)." Habitat of hydrocarbons on
the Norwegian continental shelf, Proc. conference, Stavanger, 1985: 55-60.
Gabrielsen, R. H., R. B. Foerseth, et al, (1990), "Architectural styles of basin fill in the
Harland, W. B., Cox, A. V., llewellyn, P. G., Picton, C. A. G., Smith, A. G. & Walters, R., (assisted by KE Fancett), 1982. A geologic time scale, Cambridge Un. press, Cambridge, 131pp
Helland-Hansen, W., Ashton, M., Lømo, L. & Steel, R, 1992, Advance and retreat of the Brent delta: recent contributions to the depositional model: Geology of the Brent
Group, Geological Society Special Publication, v. 61, p. 109-127.
Husmo, T., Hamar, G.P., Høiland, O. et al., 2002, Lower and Middle Jurassic. In: Evans, D., Graham, C., Armour, A. & Bathurst, P. (eds) The Millennium Atlas: Petroleum
Geology of the Central and Northern North Sea, Geological Society, London, 129 155
Odinsen, T., P. Christiansson, et al, (2000), The geometries and deep structure of the
northern North Sea rift system, 167: 41-57.
Pettersen, O., Storli, A., Ljosland, E., Nygaard, O., Massie,I., Carlsen, H., 1992, The Gullfaks field: Chapter 27: In: M54: Giant Oil and Gas Fields of the Decade 1978-1988, p. 429-446.
Russel, B.H., 1988, Introduction to Seismic Inversion Methods (ed : S.N. Domenico), SOC. Of Exploration Geophysicists
Russel, B.H., 1995,Introduction to Seismic Inversion Methods, STRATA workshop. Russel, B.H., 2007,Introduction to Seismic Inversion Methods, STRATA workshop. Ryseth, A., 2000,Differential subsidence in the Ness Formation (Bajocian), Oseberg area,
northern North Sea: facies variation, accommodation space development and
sequence stratigraphy in a deltaic distributary system.: Norsk Geologisk Tidsskrift,
v. 80, p. 9-26.
Schlakker, A., Csizmeg, J., Pogacsas, G., and Horti, A., 2012, Burial, Thermal and
Maturation History in the Northern Viking Graben, The American Association of
Petroleum Geologist International Convention and Exhibition, Milan, Italy
Sukmono, S., 2002, Post and Pre Stack Seismic Inversion for Hydrocarbon Reservoir
Characterization, Laboratorium of Reservoir Geophysics, Department of
Geophysical Engineering - ITB
Sukmono, S., 2007, Seismic Attribute for Hydrocarbon Reservoir Characterization, Laboratorium of Reservoir Geophysics, Department of Geophysical Engineering ITB
Tanner, M.T., 2000,Attributes Revisited.,Texas USA: Rock Solid Images
Tollefsen, S., E. Graue, and S. Svinddal, 1992, The Gullfaks Field Development:
Challenges and Perspectives, European Petroleum Conference, Cannes, France, 1992
Copyright 1992, Society of Petroleum Engineers, Inc.
Yielding, G., Badley, M.E.& Roberts, A.M., 1992, The structural evolution of the Brent
Province: Geology of the Brent Group, Geological Society Special Publication, v. 61,